Hot Springs, AR (Arkansas) Houses and Residents
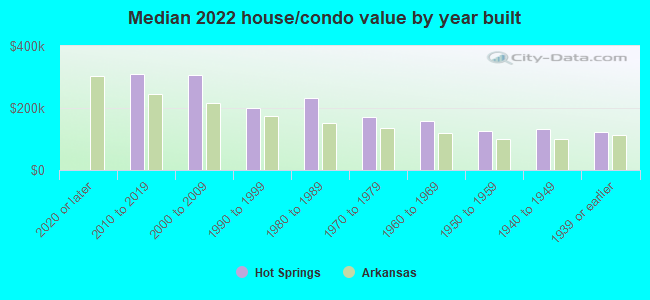
| Hot Springs: | $175,213 |
| Arkansas: | $179,800 |
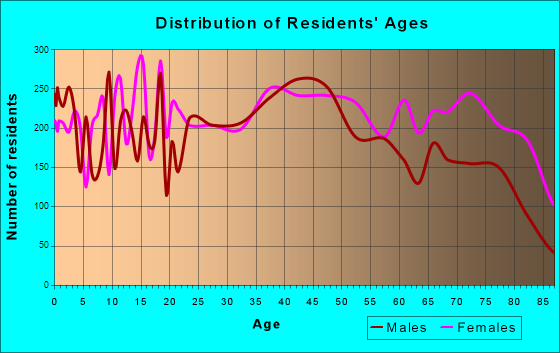
Total population: 35,673 (Urban population: 35,235, Rural population: 378 (all nonfarm))
Houses: 21,363 (17,573 occupied: 10,155 owner occupied, 8,099 renter occupied)
| % of renters here: | 44% |
| State: | 34% |
Housing density: 650 houses/condos per square mile
Median price asked for vacant for-sale houses and condos in 2022: $141,939.
Median contract rent in 2022: $668 (lower quartile is $479, upper quartile is $907)
Median rent asked for vacant for-rent units in 2022: $611
Median gross rent in Hot Springs, AR in 2022: $818
Housing units in Hot Springs with a mortgage: 5,138 (305 second mortgage, 0 home equity loan, 139 both second mortgage and home equity loan)
Houses without a mortgage: 165
Median household income for houses/condos with a mortgage: $64,310
Median household income for apartments without a mortgage: $47,001
Median monthly housing costs: $710
Compare current foreclosures near Hot Springs, AR:
| Photo | Address | Area | Beds / Baths | Price | Details |
|---|---|---|---|---|---|

|
#1
Shady Brook Trl
Hot Springs National Park, AR 71901
|
2,166 sq. feet
|
2 baths 3 beds |
show details | |

|
#2
Dulzura Way
Hot Springs Village, AR 71909
|
1,120 sq. feet
|
1 baths 2 beds |
show details | |

|
#3
Treasure Isle Rd
Hot Springs National Park, AR 71913
|
1,248 sq. feet
|
2 baths 3 beds |
show details | |

|
#4
Springwood Rd
Hot Springs National Park, AR 71913
|
8,690 sq. feet
|
3 baths 4 beds |
show details | |

|
#5
Summer St
Hot Springs National Park, AR 71913
|
1,877 sq. feet
|
2 baths 3 beds |
show details | |

|
#6
3rd St
Hot Springs National Park, AR 71913
|
1,190 sq. feet
|
1 baths 2 beds |
show details | |

|
#7
Phadral Pt
Hot Springs National Park, AR 71913
|
1,470 sq. feet
|
1 baths 2 beds |
show details | |

|
#8
Mountain Pine Rd
Mountain Pine, AR 71956
|
1,764 sq. feet
|
2 baths 3 beds |
show details | |

|
#9
Lakeshore Dr
Hot Springs National Park, AR 71913
|
1,593 sq. feet
|
1 baths 3 beds |
show details | |

|
#10
Lakeside Rd
Hot Springs National Park, AR 71901
|
1,594 sq. feet
|
2 baths 3 beds |
show details |
| Photo | Address | Area | Beds / Baths | Price | Details |
|---|---|---|---|---|---|

|
#11
Pleasant St
Hot Springs National Park, AR 71901
|
1,260 sq. feet
|
1 baths 2 beds |
show details | |

|
#12
Cevico Ln
Hot Springs Village, AR 71909
|
1,596 sq. feet
|
2 baths 3 beds |
show details | |

|
#13
Kenwood St
Hot Springs National Park, AR 71913
|
1,788 sq. feet
|
2 baths 4 beds |
show details | |

|
#14
Kenwood St
Hot Springs National Park, AR 71913
|
1,483 sq. feet
|
1 baths 2 beds |
show details | |

|
#15
Bull Bayou Rd
Hot Springs National Park, AR 71913
|
1,736 sq. feet
|
2 baths 2 beds |
show details | |

|
#16
Fleetwood Dr
Hot Springs National Park, AR 71913
|
1,156 sq. feet
|
1 baths 2 beds |
show details | |

|
#17
Wabash Rd
Hot Springs National Park, AR 71901
|
2,000 sq. feet
|
1 baths 2 beds |
show details | |

|
#18
Cedarwood St
Hot Springs National Park, AR 71901
|
2,230 sq. feet
|
2 baths 3 beds |
show details | |

|
#19
Regency Ter
Hot Springs National Park, AR 71913
|
1,914 sq. feet
|
2 baths 2 beds |
show details | |

|
#20
Victoria Ln
Hot Springs National Park, AR 71901
|
1,084 sq. feet
|
1 baths 3 beds |
show details |
| Photo | Address | Area | Beds / Baths | Price | Details |
|---|---|---|---|---|---|

|
#21
Honeysuckle Cir
Hot Springs National Park, AR 71913
|
1,512 sq. feet
|
2 baths 3 beds |
show details | |

|
#22
Standpipe Rd
Hot Springs National Park, AR 71913
|
1,222 sq. feet
|
1 baths 2 beds |
show details | |

|
#23
Kathy Ln
Hot Springs National Park, AR 71913
|
1,978 sq. feet
|
2 baths 4 beds |
show details | |

|
#24
Galaxy St
Hot Springs National Park, AR 71913
|
2,286 sq. feet
|
2 baths 3 beds |
show details | |

|
#25
Pine Meadows Loop
Hot Springs National Park, AR 71901
|
1,934 sq. feet
|
2 baths 3 beds |
show details | |

|
#26
Cedar Creek Rd
Hot Springs National Park, AR 71901
|
924 sq. feet
|
2 baths 2 beds |
show details | |

|
#27
Indian Springs Rd
Hot Springs National Park, AR 71901
|
1,556 sq. feet
|
2 baths 3 beds |
show details | |

|
#28
Belvedere Oaks Cir
Hot Springs National Park, AR 71901
|
1,548 sq. feet
|
1 baths 3 beds |
show details | |

|
#29
Ledgerock Rd
Hot Springs National Park, AR 71913
|
1,836 sq. feet
|
1 baths 3 beds |
show details | |

|
#30
Ernestway St
Hot Springs National Park, AR 71913
|
1,294 sq. feet
|
2 baths 3 beds |
show details |
| Photo | Address | Area | Beds / Baths | Price | Details |
|---|---|---|---|---|---|

|
#31
Village Rd
Hot Springs National Park, AR 71913
|
2,675 sq. feet
|
2 baths 4 beds |
show details | |

|
#32
Briarmeadow Ln
Hot Springs National Park, AR 71913
|
1,761 sq. feet
|
2 baths 3 beds |
show details | |

|
#33
Bay Ridge Loop
Hot Springs National Park, AR 71901
|
4,950 sq. feet
|
4 baths 4 beds |
show details | |

|
#34
Tunica Trl
Hot Springs National Park, AR 71913
|
2,800 sq. feet
|
2 baths 2 beds |
show details | |

|
#35
Old Church Rd
Hot Springs National Park, AR 71901
|
2,062 sq. feet
|
1 baths 2 beds |
show details | |

|
#36
Monarch Ln
Hot Springs National Park, AR 71913
|
1,438 sq. feet
|
1 baths 2 beds |
show details | |

|
#37
Waterside Ln
Hot Springs National Park, AR 71913
|
2,276 sq. feet
|
3 baths 3 beds |
show details | |

|
#38
King Arthur Ct
Hot Springs National Park, AR 71913
|
1,292 sq. feet
|
2 baths 3 beds |
show details | |

|
#39
Havelock Pl
Hot Springs National Park, AR 71913
|
1,974 sq. feet
|
2 baths 3 beds |
show details | |

|
#40
W Belding St
Hot Springs National Park, AR 71901
|
1,260 sq. feet
|
1 baths 2 beds |
show details |
| Photo | Address | Area | Beds / Baths | Price | Details |
|---|---|---|---|---|---|

|
#41
Avalon Dr
Pearcy, AR 71964
|
1,508 sq. feet
|
2 baths 3 beds |
show details | |

|
#42
Lawler Pl
Hot Springs National Park, AR 71913
|
2,120 sq. feet
|
2 baths 3 beds |
show details | |

|
#43
Perralena Way
Hot Springs Village, AR 71909
|
1,544 sq. feet
|
2 baths 3 beds |
show details | |

|
#44
W Sullenberger Ave
Malvern, AR 72104
|
1,140 sq. feet
|
1 baths - beds |
show details | |

|
#45
Highway 298
Jessieville, AR 71949
|
999 sq. feet
|
1 baths 3 beds |
show details | |

|
#46
Rock Springs Rd
Jessieville, AR 71949
|
1,860 sq. feet
|
2 baths 3 beds |
show details | |

|
#47
Alarcon Ln
Hot Springs Village, AR 71909
|
1,304 sq. feet
|
2 baths 2 beds |
show details | |

|
#48
Cevico Ln
Hot Springs Village, AR 71909
|
1,996 sq. feet
|
2 baths 3 beds |
show details | |

|
#49
Cevico Ln
Hot Springs Village, AR 71909
|
1,596 sq. feet
|
2 baths 3 beds |
show details | |

|
Check over 1 million property listings on Foreclosure.com!
|
browse all offers | |||


 | Hot Springs Spas and Bath Houses (0 replies) |
| Historic homes or just older homes in Hot Springs that may have been moved? (7 replies) |
| Advice wanted re: Hot Springs (4 replies) |
| Fences allowed in Hot Springs Village? (3 replies) |
| Job opportunity in hot springs - relocation question (1 reply) |
| Looking to relocate, how is Hot Springs? (59 replies) |
Median year apartment built: 1971
Household type by relationship:
Households: 38,050- Male householders: 7,969 (2,660 living alone), Female householders: 9,444 (3,682 living alone)
5,546 spouses (5,484 opposite-sex spouses), 1,379 unmarried partners, (1,328 opposite-sex unmarried partners), 8,164 children (7,446 natural, 394 adopted, 324 stepchildren), 1,049 grandchildren, 411 brothers or sisters, 603 parents, 7 foster children, 826 other relatives, 1,207 non-relatives
- In group quarters: 1,439
Size of family households: 4,954 2-persons, 1,875 3-persons, 1,791 4-persons, 481 5-persons, 147 6-persons, 160 7-or-more-persons.
Size of nonfamily households: 7,744 1-person, 1,081 2-persons, 211 3-persons, 39 4-persons, 19 5-persons.
2,500 married couples with children.
2,452 single-parent households (232 men, 2,220 women).
88.1% of residents of Hot Springs speak English at home.
9.2% of residents speak Spanish at home (67% speak English very well, 11% speak English well, 11% speak English not well, 11% don't speak English at all).
2.0% of residents speak other Indo-European language at home (67% speak English very well, 20% speak English well, 12% speak English not well, 1% don't speak English at all).
1.2% of residents speak Asian or Pacific Island language at home (24% speak English very well, 8% speak English well, 60% speak English not well, 8% don't speak English at all).
Foreign born population: 2,513 (6.6%)
(44.6% of them are naturalized citizens)
| Here: | 5.7 |
| State: | 6.1 |
| Here: | 3.8 |
| State: | 4.3 |
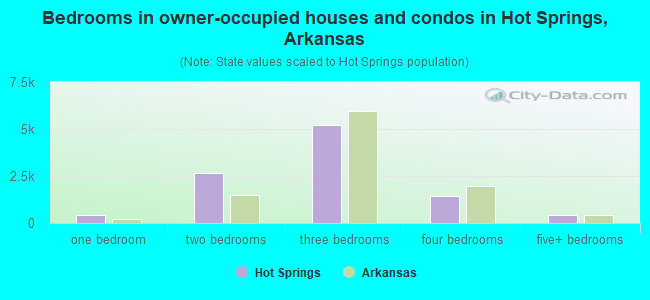
- Bedrooms in owner-occupied houses and condos in Hot Springs, Arkansas
- 21no bedroom
- 4041 bedroom
- 2,6352 bedrooms
- 5,2123 bedrooms
- 1,4494 bedrooms
- 4355+ bedrooms
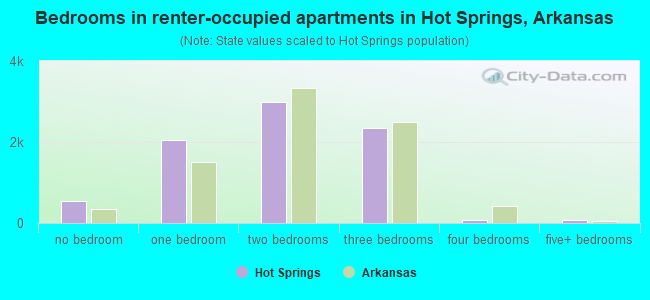
- Bedrooms in renter-occupied apartments in Hot Springs, Arkansas
- 534no bedroom
- 2,0401 bedroom
- 2,9982 bedrooms
- 2,3563 bedrooms
- 864 bedrooms
- 855+ bedrooms
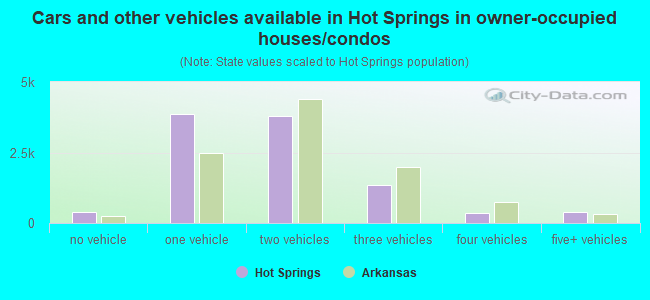
- Cars and other vehicles available in Hot Springs in owner-occupied houses/condos
- 392no vehicle
- 3,8671 vehicle
- 3,7792 vehicles
- 1,3603 vehicles
- 3684 vehicles
- 3905+ vehicles
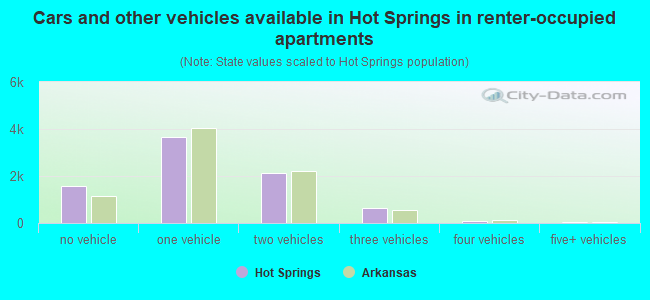
- Cars and other vehicles available in Hot Springs in renter-occupied apartments
- 1,560no vehicle
- 3,6741 vehicle
- 2,1152 vehicles
- 6433 vehicles
- 824 vehicles
- 265+ vehicles
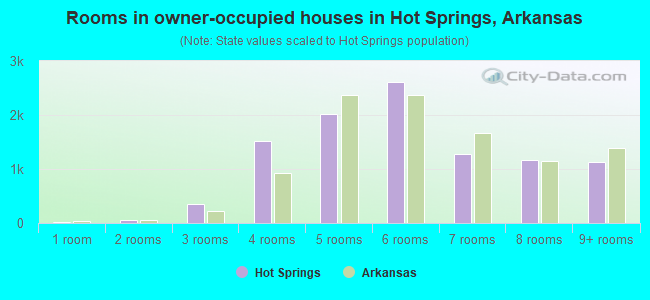
- Rooms in owner-occupied houses in Hot Springs, Arkansas
- 211 room
- 582 rooms
- 3573 rooms
- 1,5194 rooms
- 2,0165 rooms
- 2,6156 rooms
- 1,2857 rooms
- 1,1598 rooms
- 1,1269+ rooms
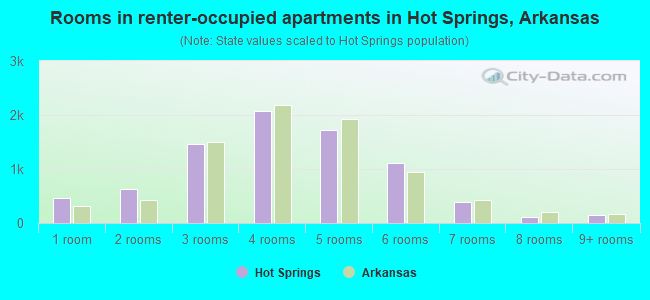
- Rooms in renter-occupied apartments in Hot Springs, Arkansas
- 4641 room
- 6302 rooms
- 1,4573 rooms
- 2,0704 rooms
- 1,7215 rooms
- 1,1066 rooms
- 3957 rooms
- 1058 rooms
- 1519+ rooms
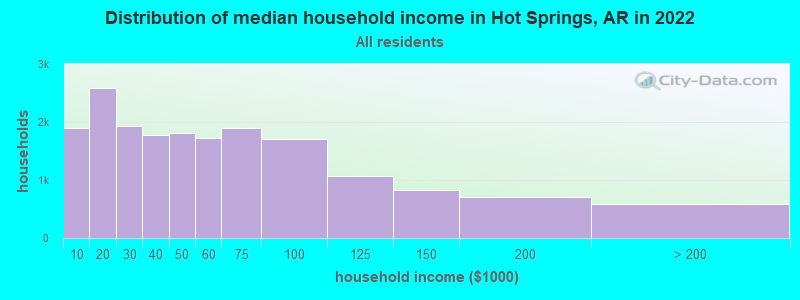
Hot Springs, AR household income distribution

- 1,897Less than $10,000
- 2,582$10,000 to $19,999
- 1,928$20,000 to $29,999
- 1,784$30,000 to $39,999
- 1,805$40,000 to $49,999
- 1,731$50,000 to $59,999
- 1,902$60,000 to $74,999
- 1,712$75,000 to $99,999
- 1,063$100,000 to $124,999
- 820$125,000 to $149,999
- 701$150,000 to $199,999
- 586$200,000 or more
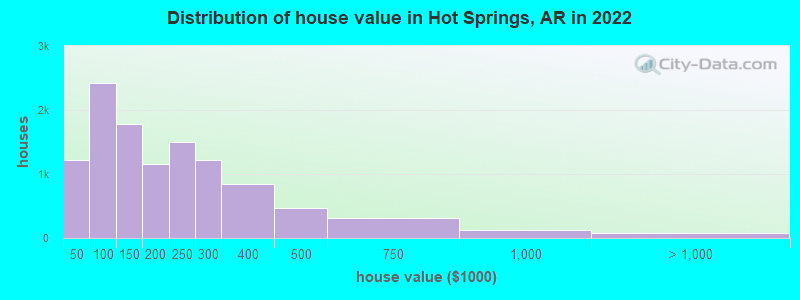
Home value of owner - occupied houses in 2022 in Hot Springs, AR
-
- 176Less than $10,000
- 84$10,000 to $14,999
- 42$15,000 to $19,999
- 106$20,000 to $24,999
- 204$25,000 to $29,999
- 204$30,000 to $34,999
- 67$35,000 to $39,999
- 329$40,000 to $49,999
- 311$50,000 to $59,999
- 199$60,000 to $69,999
- 493$70,000 to $79,999
- 466$80,000 to $89,999
- 623$90,000 to $99,999
- 958$100,000 to $124,999
- 821$125,000 to $149,999
- 772$150,000 to $174,999
- 389$175,000 to $199,999
- 1,505$200,000 to $249,999
- 1,216$250,000 to $299,999
- 845$300,000 to $399,999
- 465$400,000 to $499,999
- 309$500,000 to $749,999
- 119$750,000 to $999,999
- 74$1,000,000 to $1,499,999
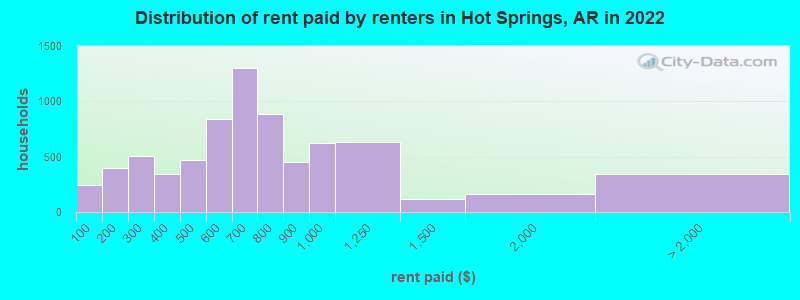
Rent paid by renters in 2022 in Hot Springs, AR
-
- 245Less than $100
- 72$100 to $149
- 328$150 to $199
- 204$200 to $249
- 301$250 to $299
- 298$300 to $349
- 41$350 to $399
- 315$400 to $449
- 156$450 to $499
- 500$500 to $549
- 339$550 to $599
- 381$600 to $649
- 922$650 to $699
- 450$700 to $749
- 433$750 to $799
- 453$800 to $899
- 619$900 to $999
- 635$1,000 to $1,249
- 120$1,250 to $1,499
- 165$1,500 to $1,999
- 55$2,000 to $2,499
- 81$2,500 to $2,999
- 17$3,500 or more
- 188No cash rent
Percentage of workers working in this county: 86.7%
Number of people working at home: 871 (5.5% of all workers)
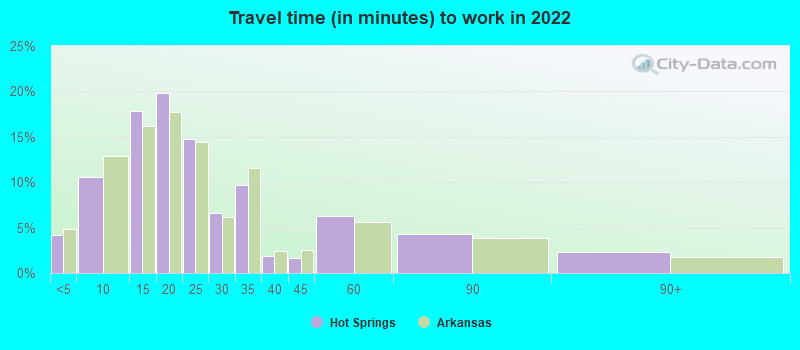
Travel time to work (commute)
- Less than 5 minutes: 1,102
- 5 to 9 minutes: 2,313
- 10 to 14 minutes: 3,485
- 15 to 19 minutes: 3,080
- 20 to 24 minutes: 1,492
- 25 to 29 minutes: 405
- 30 to 34 minutes: 903
- 35 to 39 minutes: 348
- 40 to 44 minutes: 202
- 45 to 59 minutes: 662
- 60 to 89 minutes: 397
- 90 or more minutes: 291
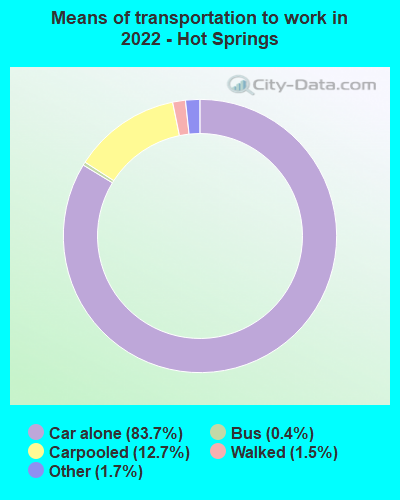
Means of transportation to work:
- Drove a car alone: 23,854 (80.9%)
- Carpooled: 3,164 (10.7%)
- Bus: 130 (0.4%)
- Taxi: 518 (1.8%)
- Walked: 447 (1.5%)
- Worked at home: 871 (3.0%)
- Unemployment by race in 2022
- Unemployment rate for White non-Hispanic residents
- 3.9%Males
- 1.6%Females
- Unemployment rate for Black residents
- 6.8%Males
- 3.3%Females
- Unemployment rate for two or more race residents
- 0.8%Males
- 1.5%Females
- Unemployment rate for Hispanic or Latino residents
- 0.3%Females
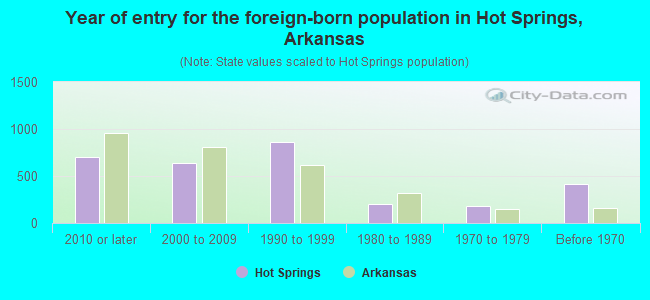
- Year of entry for the foreign-born population in Hot Springs, Arkansas
- 7062010 or later
- 6432000 to 2009
- 8641990 to 1999
- 1971980 to 1989
- 1841970 to 1979
- 410Before 1970
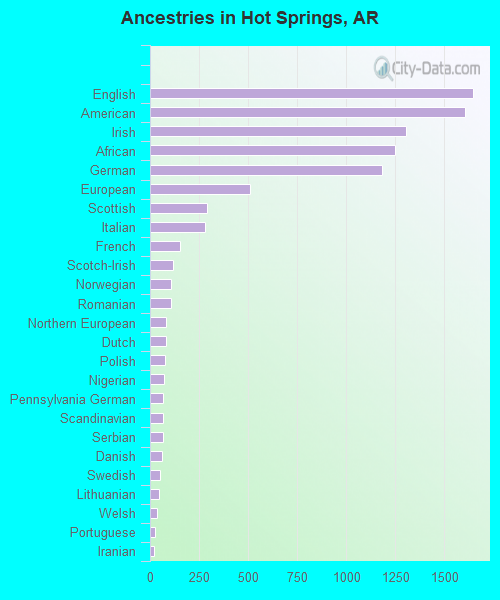
First ancestries reported:
- English: 1,646 (8.7%)
- American: 1,608 (8.5%)
- Irish: 1,303 (6.9%)
- African: 1,248 (6.6%)
- German: 1,184 (6.2%)
- European: 508 (2.7%)
- Scottish: 293 (1.5%)
- Italian: 280 (1.5%)
- French: 151 (0.8%)
- Scotch-Irish: 117 (0.6%)
- Norwegian: 108 (0.6%)
- Romanian: 105 (0.6%)
- Northern European: 84 (0.4%)
- Dutch: 83 (0.4%)
- Polish: 74 (0.4%)
- Nigerian: 71 (0.4%)
- Pennsylvania German: 67 (0.4%)
- Scandinavian: 66 (0.3%)
- Serbian: 64 (0.3%)
- Danish: 63 (0.3%)
- Swedish: 51 (0.3%)
- Lithuanian: 47 (0.2%)
- Welsh: 34 (0.2%)
- Portuguese: 23 (0.1%)
- Iranian: 22 (0.1%)
- Swiss: 22 (0.1%)
- British: 20 (0.1%)
- French Canadian: 19 (0.10%)
- Finnish: 19 (0.10%)
- Dutch West Indian: 19 (0.10%)
- Cajun: 18 (0.09%)
- Eastern European: 13 (0.07%)
- Slovak: 13 (0.07%)
- Ukrainian: 12 (0.06%)
- Czech: 10 (0.05%)
- Carpatho Rusyn: 9 (0.05%)
- Croatian: 8 (0.04%)
- Greek: 6 (0.03%)
- Australian: 6 (0.03%)
- Russian: 4 (0.02%)
Most common places of birth for foreign-born residents (%):
| Hot Springs: | 36.0% (961) |
| Arkansas: | 40.2% (61,075) |
| Hot Springs: | 17.6% (469) |
| Arkansas: | 10.7% (16,210) |
| Hot Springs: | 10.7% (286) |
| Arkansas: | 2.7% (4,028) |
| Hot Springs: | 7.0% (188) |
| Arkansas: | 6.1% (9,278) |
| Hot Springs: | 5.7% (152) |
| Arkansas: | 0.3% (403) |
| Hot Springs: | 3.3% (88) |
| Arkansas: | 0.3% (485) |
| Hot Springs: | 2.7% (73) |
| Arkansas: | 1.1% (1,606) |
| Hot Springs: | 2.3% (62) |
| Arkansas: | 1.8% (2,721) |
Place of birth for U.S.-born residents:
- This state: 20,049
- Other state: 15,079
- Northeast: 1,002
- Midwest: 4,000
- South: 6,659
- West: 3,465
85.5% of Hot Springs residents lived in the same house 1 years ago.
Out of people who lived in different houses, 33.2% lived in this county.
Out of people who lived in different counties, 46.8% lived in Arkansas.
| Hot Springs: | 85.5% |
| State average: | 87.0% |
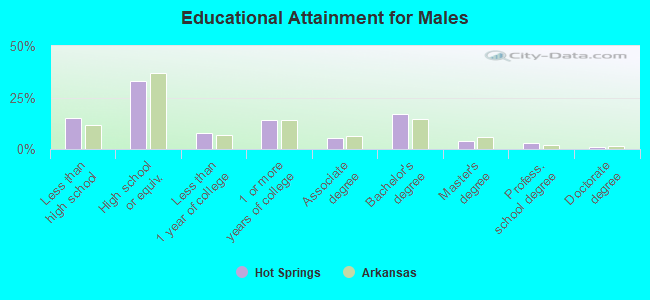
Education attainment for males 25 years and older:
- No schooling: 112
- Nursery to 4th grade: 86
- 5th and 6th grade: 80
- 7th and 8th grade: 349
- 9th grade: 233
- 10th grade: 381
- 11th grade: 436
- 12th grade, no diploma: 177
- High school graduate (or equivalency): 4,097
- Less than 1 year of college: 989
- Some college more than 1 year, no degree: 1,761
- Associate degree: 634
- Bachelor's degree: 2,117
- Master's degree: 459
- Professional school degree: 367
- Doctorate degree: 148
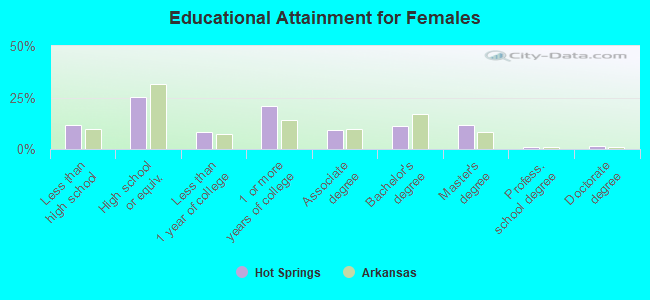
Education attainment for females 25 years and older:
- No schooling: 158
- Nursery to 4th grade: 54
- 5th and 6th grade: 65
- 7th and 8th grade: 281
- 9th grade: 169
- 10th grade: 244
- 11th grade: 321
- 12th grade, no diploma: 454
- High school graduate (or equivalency): 3,800
- Less than 1 year of college: 1,258
- Some college more than 1 year, no degree: 3,130
- Associate degree: 1,365
- Bachelor's degree: 1,694
- Master's degree: 1,790
- Professional school degree: 115
- Doctorate degree: 217
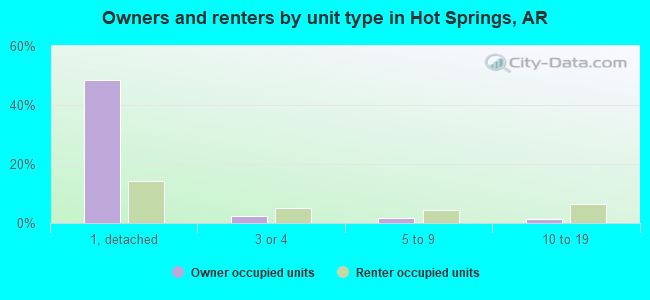
Housing units in structures:
- One, detached: 13,200
- One, attached: 433
- Two: 1,118
- 3 or 4: 1,494
- 5 to 9: 1,575
- 10 to 19: 1,049
- 20 to 49: 497
- 50 or more: 1,138
- Mobile homes: 856
Median worth of mobile homes: $27,786
Housing units lacking complete kitchen facilities in 2022: 3.0%
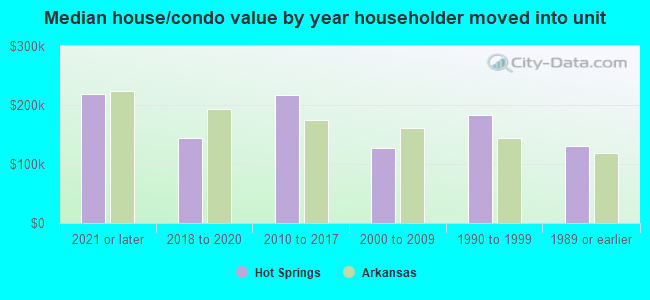
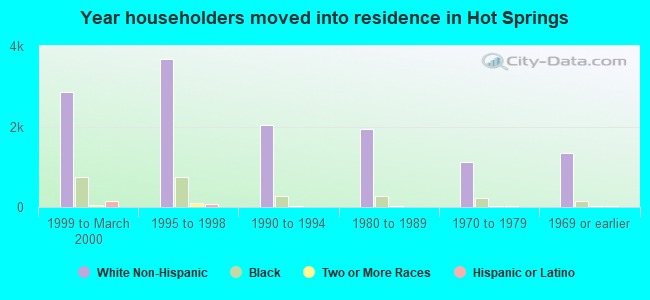
House/condo owner moved in on average 10 years ago
Renter moved in on average 3 years ago
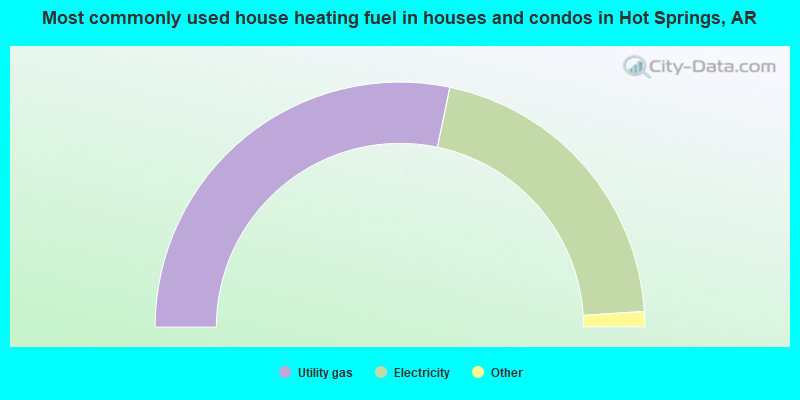
- 57.5%Utility gas
- 40.6%Electricity
- 1.4%Bottled, tank, or LP gas
- 0.5%Wood
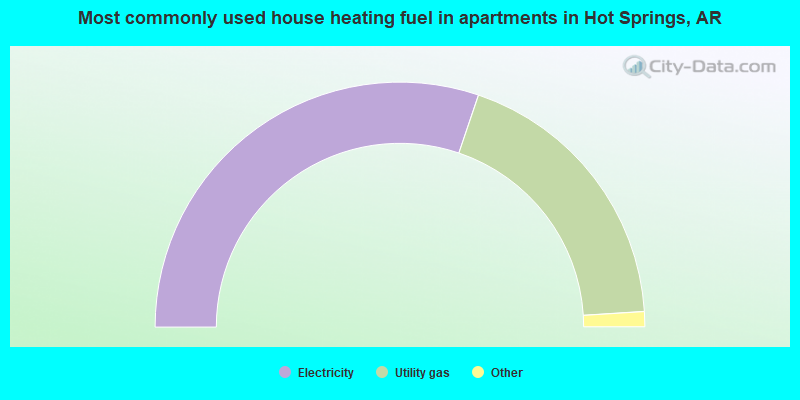
- 60.4%Electricity
- 37.6%Utility gas
- 1.3%Bottled, tank, or LP gas
- 0.5%No fuel used
- 0.2%Wood
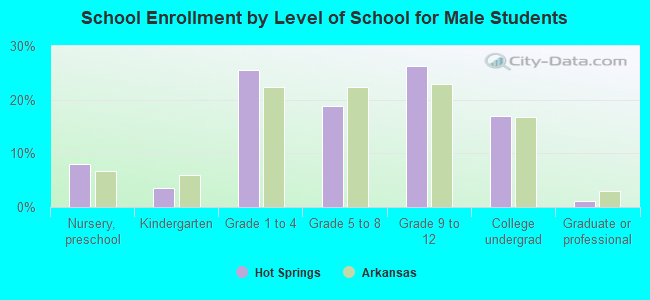
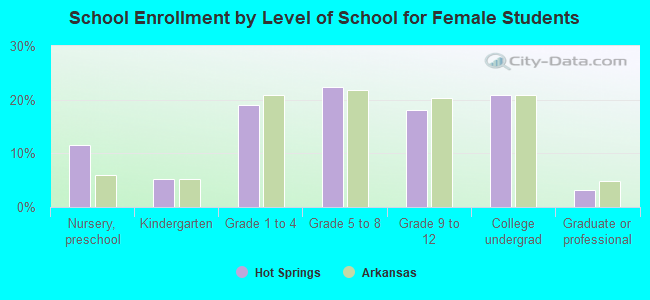
Private vs. public school enrollment:
| Here: | 6.8% |
| Arkansas: | 10.5% |
| Here: | 17.9% |
| Arkansas: | 8.7% |
| Here: | 12.5% |
| Arkansas: | 19.4% |