Hulmeville, PA (Pennsylvania) Houses and Residents
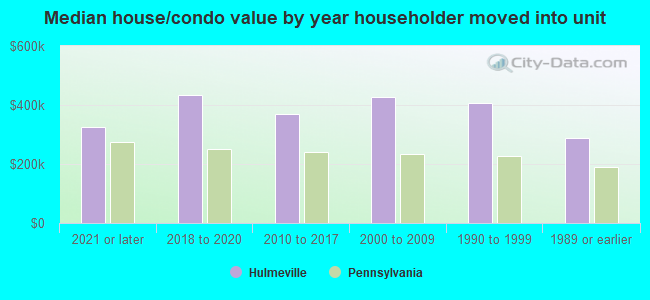
| Hulmeville: | $367,771 |
| Pennsylvania: | $245,500 |
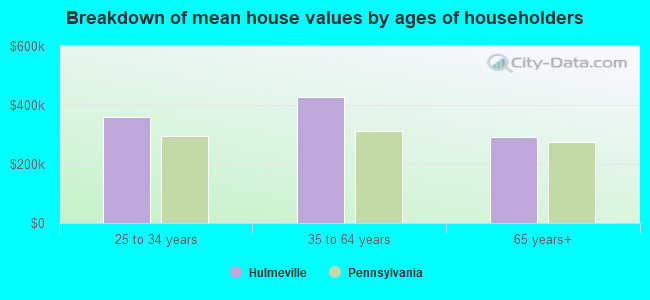
Mean price in 2022:
Detached houses: $423,797
Here: $423,797 State: $317,202 Townhouses or other attached units: $416,805
Here: $416,805 State: $254,369 In 2-unit structures: $525,947
Here: $525,947 State: $249,182
Total population: 999 (Urban population: 893, Rural population: 0)
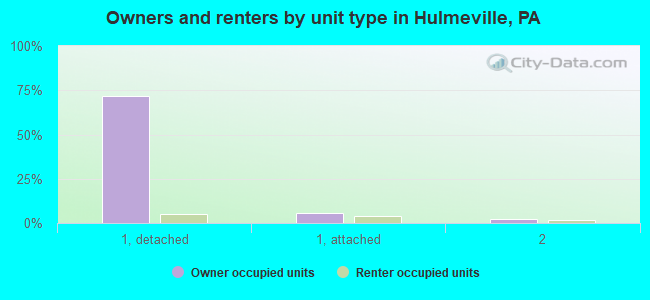
Houses: 358 (348 occupied: 296 owner occupied, 54 renter occupied)
| % of renters here: | 15% |
| State: | 31% |
Housing density: 930 houses/condos per square mile
Median price asked for vacant for-sale houses and condos in 2022 in this county: $426,803.
Median contract rent in 2022: $1,261 (lower quartile is $1,088, upper quartile is $1,611)
Median gross rent in Hulmeville, PA in 2022: $1,509
Housing units in Hulmeville with a mortgage: 217 (35 second mortgage, 0 home equity loan, 27 both second mortgage and home equity loan)
Houses without a mortgage: 14
Median household income for houses/condos with a mortgage: $125,198
Median household income for apartments without a mortgage: $80,643
Median monthly housing costs: $1,839
Compare current foreclosures near Hulmeville, PA:
| Photo | Address | Area | Beds / Baths | Price | Details |
|---|---|---|---|---|---|

|
#1
N Cedar St
Bristol, PA 19007
|
841 sq. feet
|
1 baths 1 beds |
$315,500
|
show details |

|
#2
Manchester Rd
Elkins Park, PA 19027
|
3,444 sq. feet
|
2 baths 3 beds |
$570,000
|
show details |

|
#3
N 10th St
Philadelphia, PA 19141
|
1,154 sq. feet
|
2 baths 2 beds |
$78,000
|
show details |

|
#4
Covered Bridge Rd
Cherry Hill, NJ 08034
|
1,343 sq. feet
|
1 baths 3 beds |
$465,000
|
show details |

|
#5
Harvey Ave
Pennsauken, NJ 08110
|
1,555 sq. feet
|
2 baths 4 beds |
$429,900
|
show details |

|
#6
Benjamin Ct # 141
Philadelphia, PA 19114
|
1,553 sq. feet
|
3 baths 2 beds |
$251,000
|
show details |

|
#7
Brunswick Ave
Trenton, NJ 08618
|
1,088 sq. feet
|
1 baths 2 beds |
$74,900
|
show details |

|
#8
Farragut Ct
Willingboro, NJ 08046
|
954 sq. feet
|
1 baths 2 beds |
$174,900
|
show details |

|
#9
Foxglove Dr
Riverside, NJ 08075
|
840 sq. feet
|
1 baths 2 beds |
$113,683
|
show details |

|
#10
N 5th St
Philadelphia, PA 19126
|
1,420 sq. feet
|
2 baths 3 beds |
$313,900
|
show details |
| Photo | Address | Area | Beds / Baths | Price | Details |
|---|---|---|---|---|---|

|
#11
N Philip St
Philadelphia, PA 19140
|
894 sq. feet
|
1 baths 3 beds |
$42,500
|
show details |

|
#12
Princeton Ave
Philadelphia, PA 19149
|
1,224 sq. feet
|
1 baths 3 beds |
$215,000
|
show details |

|
#13
Moore Ct
Pennington, NJ 08534
|
940 sq. feet
|
1 baths 2 beds |
$195,993
|
show details |

|
#14
N Forklanding Rd
Maple Shade, NJ 08052
|
1,450 sq. feet
|
1 baths 3 beds |
$259,900
|
show details |

|
#15
Arneys Mount Rd
Pemberton, NJ 08068
|
2,514 sq. feet
|
2 baths 3 beds |
$399,000
|
show details |

|
#16
Bunker Hill Ave
Trenton, NJ 08648
|
840 sq. feet
|
1 baths 2 beds |
$275,000
|
show details |

|
#17
E Fariston Dr
Philadelphia, PA 19120
|
1,152 sq. feet
|
1 baths 3 beds |
$140,260
|
show details |

|
#18
Ardleigh St
Philadelphia, PA 19138
|
948 sq. feet
|
1 baths 3 beds |
$9,600
|
show details |

|
#19
Tulpehocken St
Philadelphia, PA 19138
|
1,840 sq. feet
|
1 baths 3 beds |
$185,991
|
show details |

|
#20
Loretto Ave
Philadelphia, PA 19124
|
910 sq. feet
|
1 baths 3 beds |
$44,095
|
show details |
| Photo | Address | Area | Beds / Baths | Price | Details |
|---|---|---|---|---|---|

|
#21
Fairdale Rd
Philadelphia, PA 19154
|
1,152 sq. feet
|
1 baths 3 beds |
$178,593
|
show details |

|
#22
Medford Rd
Philadelphia, PA 19154
|
1,360 sq. feet
|
1 baths 3 beds |
$161,441
|
show details |

|
#23
Torresdale Ave
Philadelphia, PA 19136
|
1,260 sq. feet
|
1 baths 3 beds |
$136,351
|
show details |

|
#24
Guilford St
Philadelphia, PA 19136
|
1,408 sq. feet
|
1 baths 3 beds |
$47,700
|
show details |

|
#25
E Godfrey Ave
Philadelphia, PA 19124
|
896 sq. feet
|
1 baths 3 beds |
$58,976
|
show details |
|
|
#26
N Sydenham St
Philadelphia, PA 19141
|
1,200 sq. feet
|
1 baths 3 beds |
$95,700
|
show details |

|
#27
Dounton St
Philadelphia, PA 19140
|
1,224 sq. feet
|
1 baths 3 beds |
$28,362
|
show details |

|
#28
W Duval St
Philadelphia, PA 19144
|
810 sq. feet
|
1 baths 3 beds |
$159,020
|
show details |

|
#29
E Phil Ellena St
Philadelphia, PA 19150
|
1,170 sq. feet
|
2 baths 3 beds |
$158,152
|
show details |

|
#30
E Sanger St
Philadelphia, PA 19124
|
1,186 sq. feet
|
1 baths 3 beds |
$37,906
|
show details |
| Photo | Address | Area | Beds / Baths | Price | Details |
|---|---|---|---|---|---|

|
#31
E Cosgrove St
Philadelphia, PA 19144
|
1,178 sq. feet
|
1 baths 3 beds |
$93,332
|
show details |

|
#32
Fairfield St
Philadelphia, PA 19152
|
1,628 sq. feet
|
1 baths 4 beds |
$203,591
|
show details |

|
#33
N 25th St
Philadelphia, PA 19129
|
1,092 sq. feet
|
1 baths 3 beds |
$729,241
|
show details |

|
#34
Robbins St
Philadelphia, PA 19111
|
1,040 sq. feet
|
1 baths 3 beds |
$105,475
|
show details |

|
#35
Magnolia St
Philadelphia, PA 19144
|
1,200 sq. feet
|
1 baths 3 beds |
$20,792
|
show details |

|
#36
E Cliveden St
Philadelphia, PA 19119
|
1,456 sq. feet
|
1 baths 3 beds |
$161,652
|
show details |

|
#37
Rosalie St
Philadelphia, PA 19149
|
1,160 sq. feet
|
1 baths 3 beds |
$44,471
|
show details |

|
#38
Dell St
Philadelphia, PA 19140
|
1,110 sq. feet
|
1 baths 3 beds |
$4,000
|
show details |

|
#39
N 15th St
Philadelphia, PA 19141
|
1,280 sq. feet
|
1 baths 3 beds |
$71,287
|
show details |

|
#40
E Cornwall St
Philadelphia, PA 19134
|
1,140 sq. feet
|
1 baths 3 beds |
$65,832
|
show details |
| Photo | Address | Area | Beds / Baths | Price | Details |
|---|---|---|---|---|---|

|
#41
Leonard St
Philadelphia, PA 19149
|
1,024 sq. feet
|
1 baths 3 beds |
$54,557
|
show details |

|
#42
Cottage St
Philadelphia, PA 19135
|
1,536 sq. feet
|
1 baths 4 beds |
$82,339
|
show details |

|
#43
E Haines St # A
Philadelphia, PA 19144
|
1,238 sq. feet
|
1 baths 3 beds |
$100,808
|
show details |

|
#44
Greene St
Philadelphia, PA 19144
|
1,844 sq. feet
|
1 baths 4 beds |
$395,279
|
show details |

|
#45
Knights Bridge Dr
Morrisville, PA 19067
|
2,896 sq. feet
|
2 baths 4 beds |
$596,172
|
show details |

|
#46
Scattergood St
Philadelphia, PA 19124
|
992 sq. feet
|
1 baths 3 beds |
$65,864
|
show details |

|
#47
Pickering St
Philadelphia, PA 19150
|
1,170 sq. feet
|
1 baths 3 beds |
$169,900
|
show details |

|
#48
Conlyn St
Philadelphia, PA 19141
|
1,722 sq. feet
|
2 baths 3 beds |
$132,419
|
show details |

|
#49
Mansfield Ave
Philadelphia, PA 19138
|
1,152 sq. feet
|
1 baths 3 beds |
$152,997
|
show details |

|
Check over 1 million property listings on Foreclosure.com!
|
browse all offers | |||

Latest news about housing in Hulmeville, PA collected exclusively by city-data.com from local newspapers, TV, and radio stations

 | Is George Washington High School as bad it seems? (1 reply) |
| Langhorne - Possibly Relocating Here (18 replies) |
| Bensalem/Bristol (20 replies) |
| Moving to Bensalem next summer - a few questions, trash pick up, animals, the bus (6 replies) |
| DINKs from NJ (7 replies) |
| Langhorne Info Please!! (9 replies) |

Median year apartment built: 1965
Household type by relationship:
Households: 952- Male householders: 191 (33 living alone), Female householders: 153 (21 living alone)
230 spouses (227 opposite-sex spouses), 15 unmarried partners, (15 opposite-sex unmarried partners), 299 children (293 natural, 0 adopted, 5 stepchildren), 14 grandchildren, 3 brothers or sisters, 8 parents, 0 foster children, 12 other relatives, 17 non-relatives
Size of family households: 127 2-persons, 41 3-persons, 96 4-persons, 20 5-persons.
Size of nonfamily households: 56 1-person, 6 2-persons, 2 3-persons.
161 married couples with children.
20 single-parent households (11 men, 9 women).
88.8% of residents of Hulmeville speak English at home.
1.1% of residents speak Spanish at home (100% speak English very well).
7.5% of residents speak other Indo-European language at home (89% speak English very well, 6% speak English well, 2% speak English not well, 3% don't speak English at all).
Foreign born population: 44 (4.6%)
(88.6% of them are naturalized citizens)
| Here: | 6.8 |
| State: | 6.8 |
| Here: | 5.1 |
| State: | 4.3 |
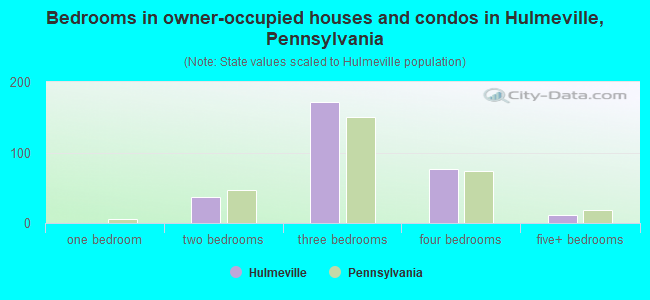
- Bedrooms in owner-occupied houses and condos in Hulmeville, Pennsylvania
- 0no bedroom
- 01 bedroom
- 372 bedrooms
- 1713 bedrooms
- 774 bedrooms
- 125+ bedrooms
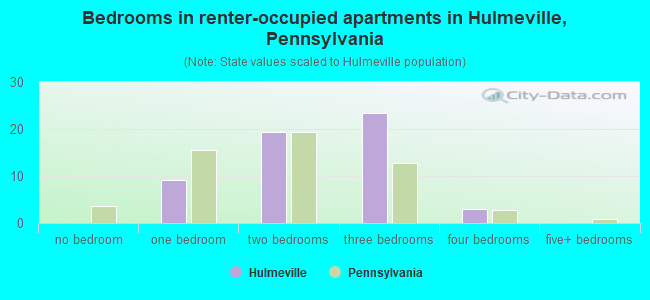
- Bedrooms in renter-occupied apartments in Hulmeville, Pennsylvania
- 0no bedroom
- 91 bedroom
- 192 bedrooms
- 233 bedrooms
- 34 bedrooms
- 05+ bedrooms
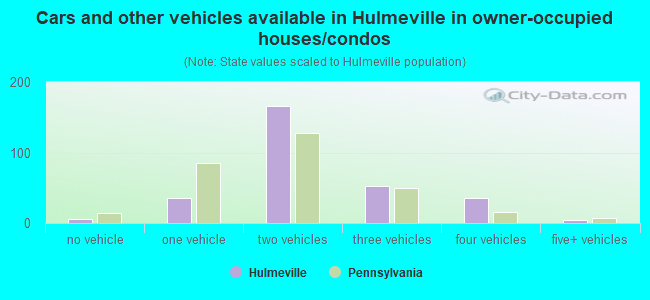
- Cars and other vehicles available in Hulmeville in owner-occupied houses/condos
- 5no vehicle
- 351 vehicle
- 1662 vehicles
- 523 vehicles
- 364 vehicles
- 45+ vehicles
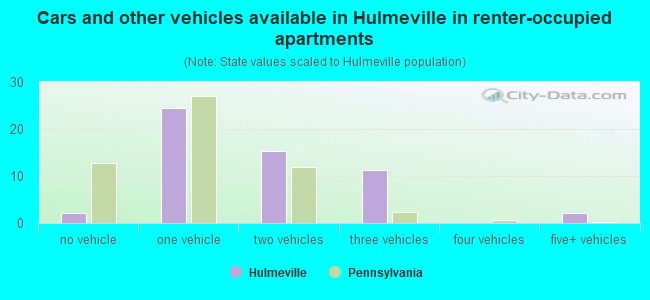
- Cars and other vehicles available in Hulmeville in renter-occupied apartments
- 2no vehicle
- 241 vehicle
- 152 vehicles
- 113 vehicles
- 04 vehicles
- 25+ vehicles
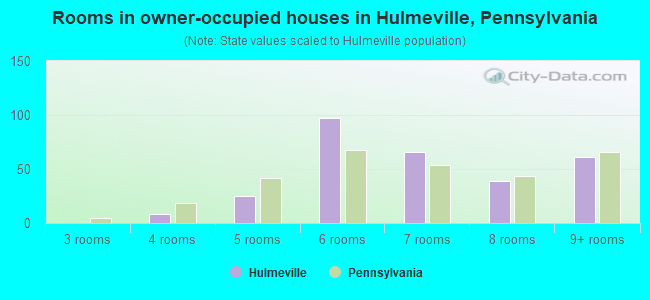
- Rooms in owner-occupied houses in Hulmeville, Pennsylvania
- 01 room
- 02 rooms
- 03 rooms
- 84 rooms
- 255 rooms
- 986 rooms
- 667 rooms
- 398 rooms
- 619+ rooms
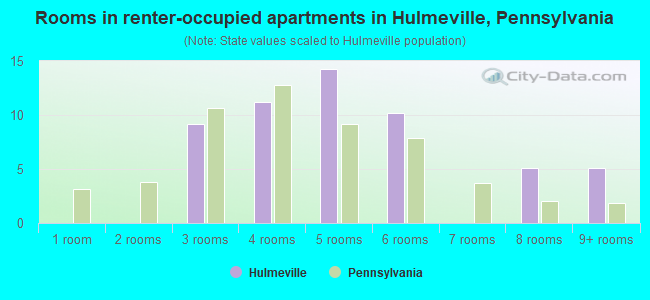
- Rooms in renter-occupied apartments in Hulmeville, Pennsylvania
- 01 room
- 02 rooms
- 93 rooms
- 114 rooms
- 145 rooms
- 106 rooms
- 07 rooms
- 58 rooms
- 59+ rooms
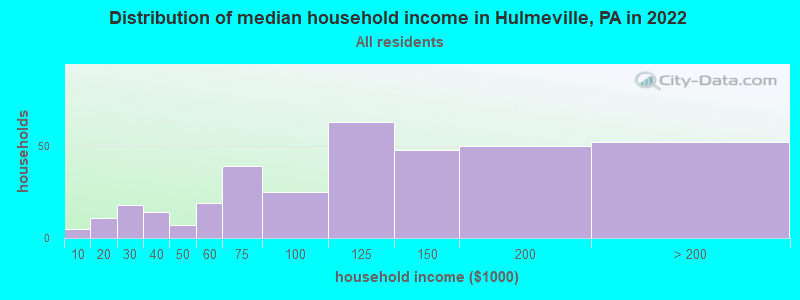
Hulmeville, PA household income distribution

- 5Less than $10,000
- 11$10,000 to $19,999
- 18$20,000 to $29,999
- 14$30,000 to $39,999
- 7$40,000 to $49,999
- 19$50,000 to $59,999
- 39$60,000 to $74,999
- 25$75,000 to $99,999
- 63$100,000 to $124,999
- 48$125,000 to $149,999
- 50$150,000 to $199,999
- 52$200,000 or more
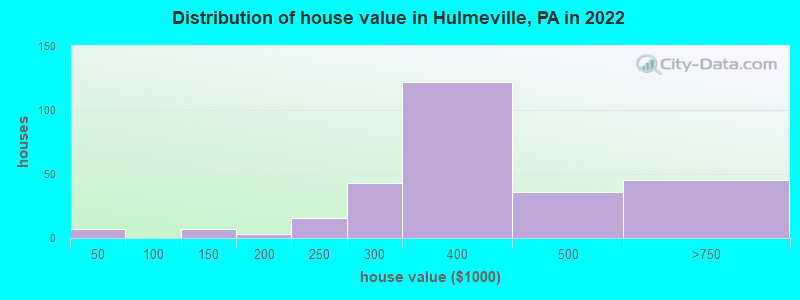
Home value of owner - occupied houses in 2022 in Hulmeville, PA
-
- 2Less than $10,000
- 1$10,000 to $14,999
- 2$15,000 to $19,999
- 1$25,000 to $29,999
- 6$100,000 to $124,999
- 3$175,000 to $199,999
- 16$200,000 to $249,999
- 43$250,000 to $299,999
- 122$300,000 to $399,999
- 36$400,000 to $499,999
- 42$500,000 to $749,999
- 1$2,000,000 or more
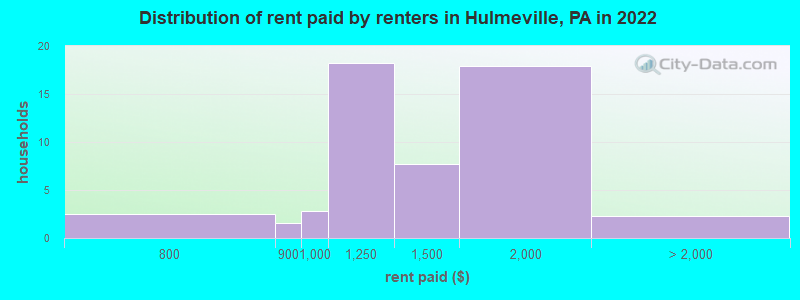
Rent paid by renters in 2022 in Hulmeville, PA
-
- 2$700 to $749
- 1$800 to $899
- 2$900 to $999
- 18$1,000 to $1,249
- 7$1,250 to $1,499
- 17$1,500 to $1,999
- 2No cash rent
Percentage of workers working in this county: 69.3%
Number of people working at home: 89 (18.2% of all workers)
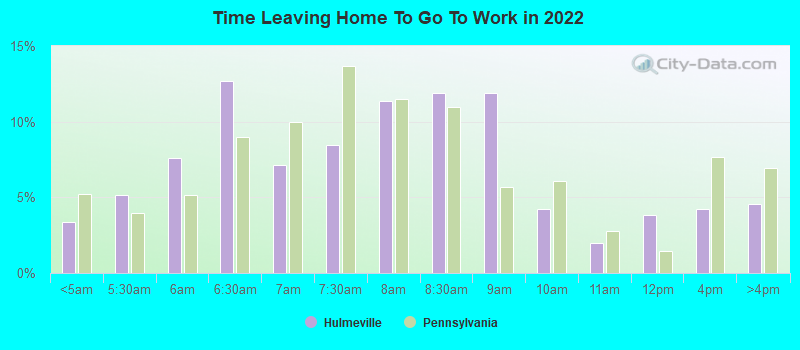
Travel time to work (commute)
- Less than 5 minutes: 20
- 5 to 9 minutes: 24
- 10 to 14 minutes: 98
- 15 to 19 minutes: 52
- 20 to 24 minutes: 33
- 25 to 29 minutes: 13
- 30 to 34 minutes: 28
- 35 to 39 minutes: 23
- 40 to 44 minutes: 33
- 45 to 59 minutes: 42
- 60 to 89 minutes: 27
- 90 or more minutes: 9
Means of transportation to work:
- Drove a car alone: 378 (80.9%)
- Carpooled: 44 (9.4%)
- Bus or trolley bus: 2 (0.4%)
- Railroad: 7 (1.5%)
- Walked: 16 (3.4%)
- Worked at home: 20 (4.3%)
- Unemployment by race in 2022
- Unemployment rate for White non-Hispanic residents
- 8.6%Males
- 3.8%Females
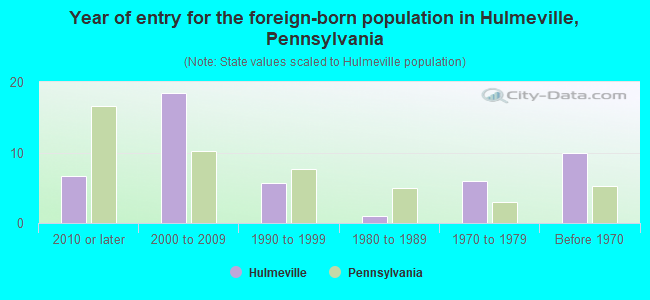
- Year of entry for the foreign-born population in Hulmeville, Pennsylvania
- 72010 or later
- 182000 to 2009
- 61990 to 1999
- 11980 to 1989
- 61970 to 1979
- 10Before 1970
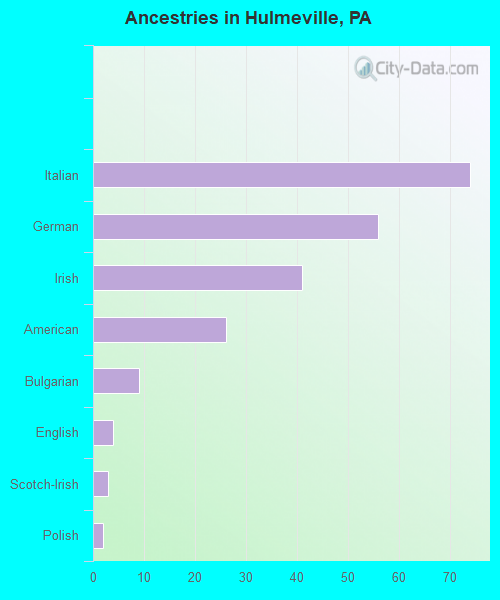
First ancestries reported:
- Italian: 74 (27.5%)
- German: 56 (20.8%)
- Irish: 41 (15.2%)
- American: 26 (9.6%)
- Bulgarian: 9 (3.3%)
- English: 4 (1.5%)
- Scotch-Irish: 3 (1.1%)
- Polish: 2 (0.7%)
Most common places of birth for foreign-born residents (%):
| Hulmeville: | 54.5% (24) |
| Pennsylvania: | 1.2% (11,211) |
| Hulmeville: | 13.6% (6) |
| Pennsylvania: | 0.2% (2,319) |
| Hulmeville: | 13.6% (6) |
| Pennsylvania: | 10.7% (100,596) |
| Hulmeville: | 11.4% (5) |
| Pennsylvania: | 2.2% (21,039) |
Place of birth for U.S.-born residents:
- This state: 737
- Other state: 157
- Northeast: 138
- Midwest: 0
- South: 15
- West: 3
93.1% of Hulmeville residents lived in the same house 1 years ago.
Out of people who lived in different houses, 41.6% lived in this county.
Out of people who lived in different counties, 76.5% lived in Pennsylvania.
| Hulmeville: | 93.1% |
| State average: | 89.3% |
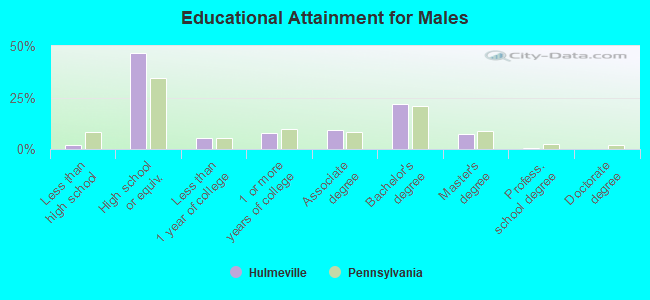
Education attainment for males 25 years and older:
- No schooling: 1
- Nursery to 4th grade: 0
- 5th and 6th grade: 0
- 7th and 8th grade: 0
- 9th grade: 0
- 10th grade: 1
- 11th grade: 1
- 12th grade, no diploma: 4
- High school graduate (or equivalency): 164
- Less than 1 year of college: 18
- Some college more than 1 year, no degree: 27
- Associate degree: 33
- Bachelor's degree: 77
- Master's degree: 26
- Professional school degree: 1
- Doctorate degree: 0
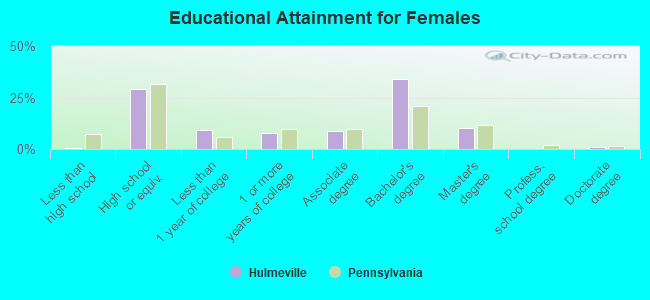
Education attainment for females 25 years and older:
- No schooling: 2
- Nursery to 4th grade: 0
- 5th and 6th grade: 0
- 7th and 8th grade: 0
- 9th grade: 0
- 10th grade: 0
- 11th grade: 0
- 12th grade, no diploma: 0
- High school graduate (or equivalency): 93
- Less than 1 year of college: 29
- Some college more than 1 year, no degree: 24
- Associate degree: 27
- Bachelor's degree: 107
- Master's degree: 32
- Professional school degree: 0
- Doctorate degree: 3


Housing units in structures:
- One, detached: 279
- One, attached: 44
- Two: 12
- 3 or 4: 9
- 5 to 9: 8
- 20 to 49: 5
Housing units lacking complete kitchen facilities in 2022: 0.8%
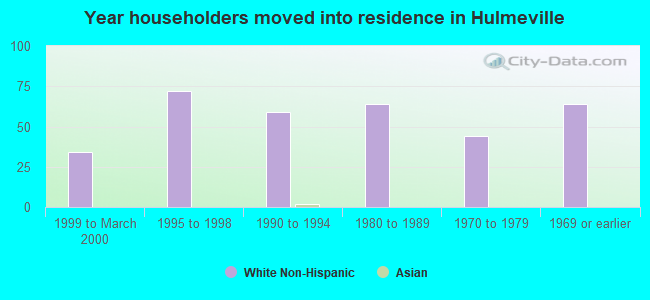
House/condo owner moved in on average 16 years ago
Renter moved in on average 5 years ago
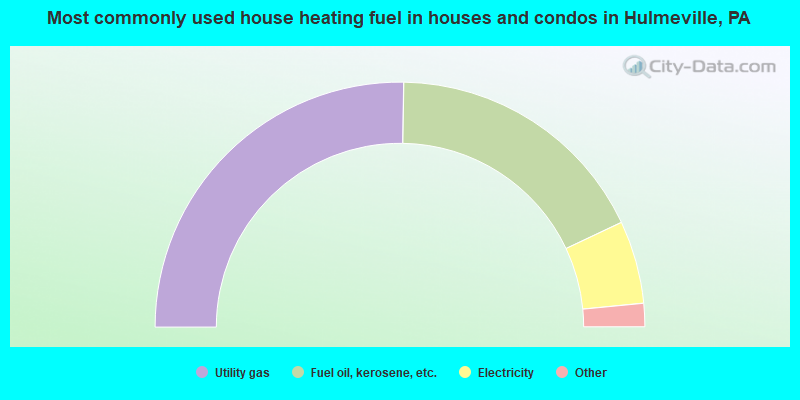
- 50.7%Utility gas
- 35.6%Fuel oil, kerosene, etc.
- 11.0%Electricity
- 1.7%Wood
- 1.0%Bottled, tank, or LP gas
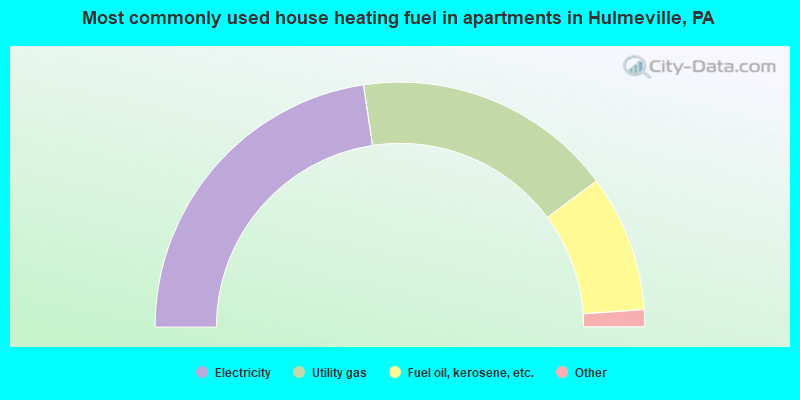
- 46.3%Electricity
- 35.2%Utility gas
- 18.5%Fuel oil, kerosene, etc.
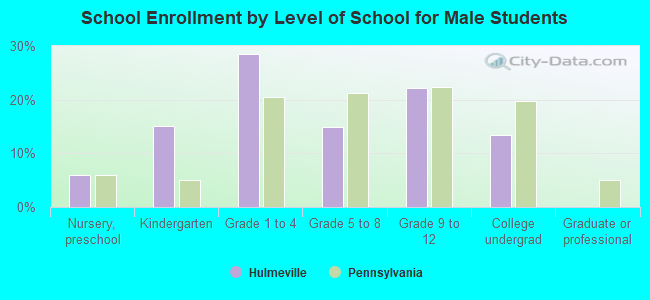
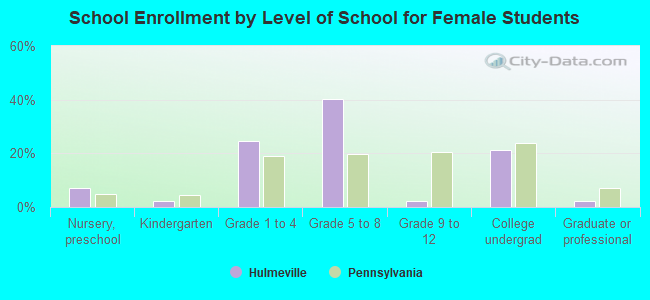
Private vs. public school enrollment:
| Here: | 9.0% |
| Pennsylvania: | 15.7% |
| Here: | 0.0% |
| Pennsylvania: | 13.4% |
| Here: | 9.7% |
| Pennsylvania: | 39.8% |