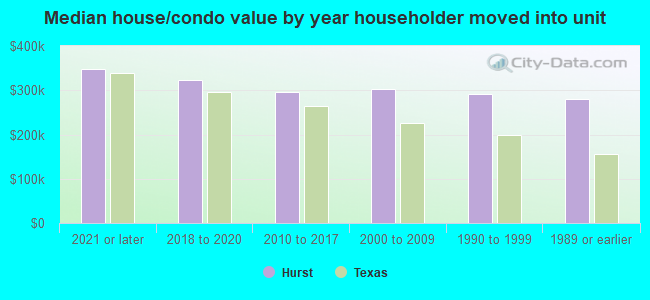
Hurst, TX (Texas) Houses and Residents
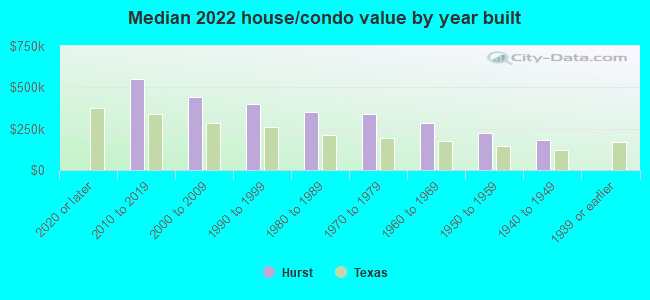
| Hurst: | $302,754 |
| Texas: | $275,400 |
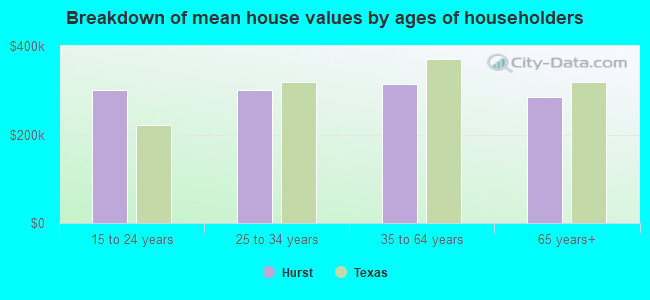
Mean price in 2022:
Detached houses: $301,341
Here: $301,341 State: $369,058 Townhouses or other attached units: $266,142
Here: $266,142 State: $327,631 In 3-to-4-unit structures: $144,960
Here: $144,960 State: $209,652 In 5-or-more-unit structures: $107,106
Here: $107,106 State: $413,944 Mobile homes: $56,472
Here: $56,472 State: $124,413
Total population: 38,733 (Urban population: 36,303, Rural population: 0)
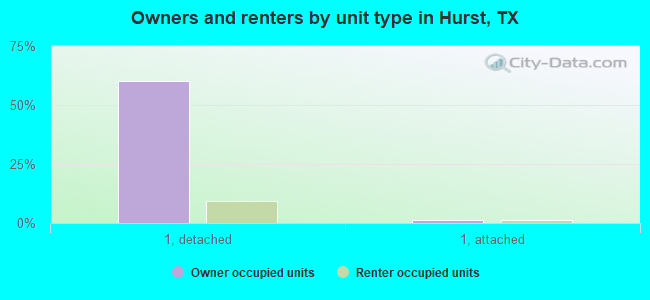
Houses: 17,322 (16,046 occupied: 9,473 owner occupied, 6,625 renter occupied)
| % of renters here: | 41% |
| State: | 38% |
Housing density: 1,749 houses/condos per square mile
Median price asked for vacant for-sale houses and condos in 2022: $272,866.
Median contract rent in 2022: $1,157 (lower quartile is $986, upper quartile is $1,404)
Median rent asked for vacant for-rent units in 2022: $1,304
Median gross rent in Hurst, TX in 2022: $1,280
Housing units in Hurst with a mortgage: 5,306 (241 second mortgage, 14 home equity loan, 171 both second mortgage and home equity loan)
Houses without a mortgage: 70
Median household income for houses/condos with a mortgage: $103,762
Median household income for apartments without a mortgage: $71,176
Median monthly housing costs: $1,273
Compare current foreclosures in Hurst, TX:
| Photo | Address | Area | Beds / Baths | Price | Details |
|---|---|---|---|---|---|

|
#1
Bluebonnet Dr
Hurst, TX 76053
|
1,270 sq. feet
|
2 baths 3 beds |
show details | |

|
#2
Harmon Rd
Hurst, TX 76053
|
1,662 sq. feet
|
2 baths 3 beds |
show details | |

|
#3
Edgehill Dr
Hurst, TX 76053
|
1,439 sq. feet
|
2 baths 3 beds |
show details | |

|
#4
Simmons Dr
Hurst, TX 76053
|
1,616 sq. feet
|
2 baths 3 beds |
show details | |

|
#5
Page St
Hurst, TX 76053
|
1,816 sq. feet
|
2 baths 3 beds |
show details | |

|
#6
Precinct Line Rd
Hurst, TX 76053
|
1,900 sq. feet
|
2 baths 3 beds |
show details | |

|
#7
Edgepoint Trl
Hurst, TX 76053
|
2,008 sq. feet
|
2 baths 3 beds |
show details | |

|
#8
Trinity Vista Trl
Hurst, TX 76053
|
2,010 sq. feet
|
2 baths 3 beds |
show details | |

|
#9
Bedford Ct W
Hurst, TX 76053
|
1,636 sq. feet
|
2 baths 3 beds |
show details | |

|
#10
Green Tree Dr
Hurst, TX 76054
|
2,776 sq. feet
|
3 baths 4 beds |
show details |
| Photo | Address | Area | Beds / Baths | Price | Details |
|---|---|---|---|---|---|

|
#11
Briarwood Ln
Hurst, TX 76053
|
1,494 sq. feet
|
2 baths 3 beds |
show details | |

|
#12
Hurstview Dr
Hurst, TX 76053
|
1,829 sq. feet
|
1 baths 3 beds |
show details | |

|
#13
Zelda Dr
Hurst, TX 76053
|
1,480 sq. feet
|
2 baths 3 beds |
show details | |

|
#14
Ridgeline Dr
Hurst, TX 76053
|
1,266 sq. feet
|
2 baths 3 beds |
show details | |

|
#15
Norwood Dr
Hurst, TX 76053
|
1,448 sq. feet
|
2 baths 3 beds |
show details | |

|
#16
Castle Dr
Hurst, TX 76053
|
1,056 sq. feet
|
1 baths 2 beds |
show details | |

|
#17
W Redbud Dr
Hurst, TX 76053
|
1,037 sq. feet
|
1 baths 3 beds |
show details | |

|
#18
Tanglewood Dr
Hurst, TX 76053
|
1,461 sq. feet
|
2 baths 4 beds |
show details | |

|
#19
Silent Creek Trl
Hurst, TX 76053
|
1,518 sq. feet
|
2 baths 3 beds |
show details | |

|
#20
Fountain Pkwy
Hurst, TX 76053
|
1,335 sq. feet
|
2 baths 3 beds |
show details |
| Photo | Address | Area | Beds / Baths | Price | Details |
|---|---|---|---|---|---|

|
#21
Norwood Dr
Hurst, TX 76053
|
1,108 sq. feet
|
1 baths 3 beds |
show details | |

|
#22
Harrison Ln
Hurst, TX 76053
|
752 sq. feet
|
1 baths 3 beds |
show details | |

|
#23
Henson Dr
Hurst, TX 76053
|
1,269 sq. feet
|
2 baths 3 beds |
show details | |

|
#24
E Plaza Blvd Apt 1073
Hurst, TX 76053
|
- sq. feet
|
- baths - beds |
show details | |

|
#25
Brown Trl Apt 348
Hurst, TX 76053
|
- sq. feet
|
- baths - beds |
show details | |

|
#26
NE Loop 820, Apt 927
Hurst, TX 76053
|
- sq. feet
|
- baths - beds |
show details | |

|
#27
E Pecan St Apt 158
Hurst, TX 76053
|
- sq. feet
|
- baths - beds |
show details | |

|
#28
Sotogrande Blvd Apt 142
Hurst, TX 76053
|
- sq. feet
|
- baths - beds |
show details | |

|
#29
Park Place Blvd
Hurst, TX 76053
|
- sq. feet
|
- baths - beds |
show details | |

|
#30
N Booth Calloway Rd Apt 106k
Hurst, TX 76053
|
- sq. feet
|
- baths - beds |
show details |
| Photo | Address | Area | Beds / Baths | Price | Details |
|---|---|---|---|---|---|

|
#31
Norwood Dr Apt 306
Hurst, TX 76053
|
- sq. feet
|
- baths - beds |
show details | |

|
#32
W Pipeline Rd
Hurst, TX 76053
|
- sq. feet
|
- baths - beds |
show details | |

|
#33
N Booth Calloway Rd # 1045
Hurst, TX 76053
|
- sq. feet
|
- baths - beds |
show details | |

|
#34
N Hills Blvd Apt 5001
Hurst, TX 76053
|
- sq. feet
|
- baths - beds |
show details | |

|
#35
NE Loop 820, Apt 411
Hurst, TX 76053
|
- sq. feet
|
- baths - beds |
show details | |

|
Check over 1 million property listings on Foreclosure.com!
|
browse all offers | |||

Latest news about housing in Hurst, TX collected exclusively by city-data.com from local newspapers, TV, and radio stations

 | Anyone live or familiar with the Hurst neighborhood of Valentine Oaks? (4 replies) |
| Strangest climate I have seen (425 replies) |
| Is Hurst a good place to grow family? (6 replies) |
| Southlake subdivisions (27 replies) |
| Softening in RE market?? (2334 replies) |
| New Doctor coming to FW, have no idea what I'm doing (housing) (17 replies) |

Median year apartment built: 1977
Household type by relationship:
Households: 40,824- Male householders: 7,973 (2,127 living alone), Female householders: 7,765 (2,446 living alone)
7,479 spouses (7,418 opposite-sex spouses), 642 unmarried partners, (628 opposite-sex unmarried partners), 11,980 children (11,348 natural, 163 adopted, 468 stepchildren), 1,091 grandchildren, 578 brothers or sisters, 1,035 parents, 0 foster children, 419 other relatives, 1,578 non-relatives
- In group quarters: 278
Size of family households: 4,347 2-persons, 2,732 3-persons, 1,776 4-persons, 893 5-persons, 260 6-persons, 169 7-or-more-persons.
Size of nonfamily households: 4,951 1-person, 854 2-persons, 62 3-persons, 43 4-persons, 17 5-persons.
6,022 married couples with children.
2,683 single-parent households (581 men, 2,102 women).
75.0% of residents of Hurst speak English at home.
18.8% of residents speak Spanish at home (66% speak English very well, 13% speak English well, 14% speak English not well, 7% don't speak English at all).
2.4% of residents speak other Indo-European language at home (88% speak English very well, 10% speak English well, 2% speak English not well).
2.1% of residents speak Asian or Pacific Island language at home (63% speak English very well, 8% speak English well, 24% speak English not well, 4% don't speak English at all).
2.0% of residents speak other language at home (85% speak English very well, 13% speak English well, 2% speak English not well).
Foreign born population: 5,522 (13.5%)
(36.3% of them are naturalized citizens)
| Here: | 6.4 |
| State: | 6.3 |
| Here: | 3.8 |
| State: | 4.0 |
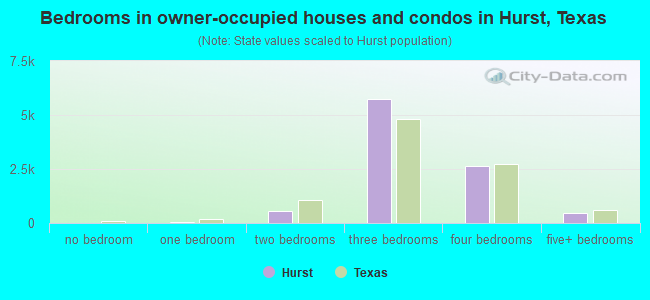
- Bedrooms in owner-occupied houses and condos in Hurst, Texas
- 16no bedroom
- 351 bedroom
- 5532 bedrooms
- 5,7623 bedrooms
- 2,6464 bedrooms
- 4625+ bedrooms
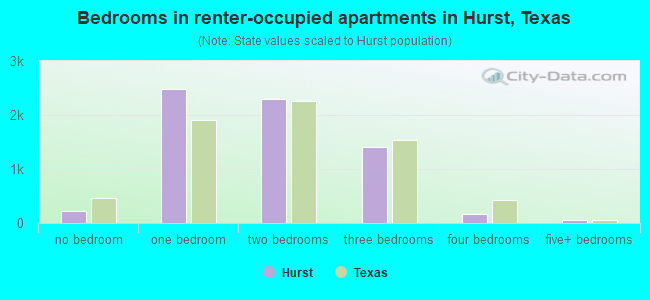
- Bedrooms in renter-occupied apartments in Hurst, Texas
- 226no bedroom
- 2,4731 bedroom
- 2,2892 bedrooms
- 1,4113 bedrooms
- 1704 bedrooms
- 565+ bedrooms
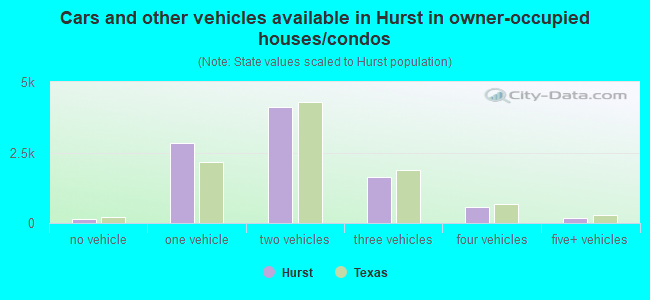
- Cars and other vehicles available in Hurst in owner-occupied houses/condos
- 146no vehicle
- 2,8321 vehicle
- 4,1102 vehicles
- 1,6253 vehicles
- 5684 vehicles
- 1935+ vehicles
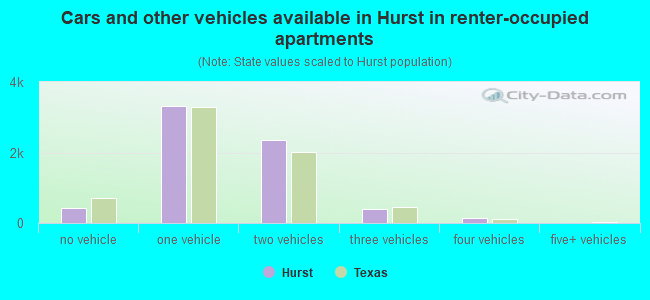
- Cars and other vehicles available in Hurst in renter-occupied apartments
- 428no vehicle
- 3,3111 vehicle
- 2,3432 vehicles
- 4003 vehicles
- 1434 vehicles
- 05+ vehicles
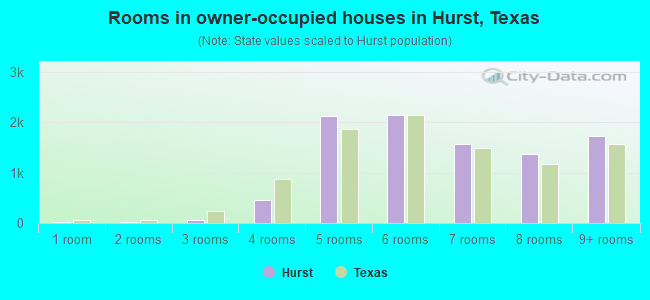
- Rooms in owner-occupied houses in Hurst, Texas
- 161 room
- 142 rooms
- 663 rooms
- 4494 rooms
- 2,1265 rooms
- 2,1466 rooms
- 1,5697 rooms
- 1,3638 rooms
- 1,7269+ rooms
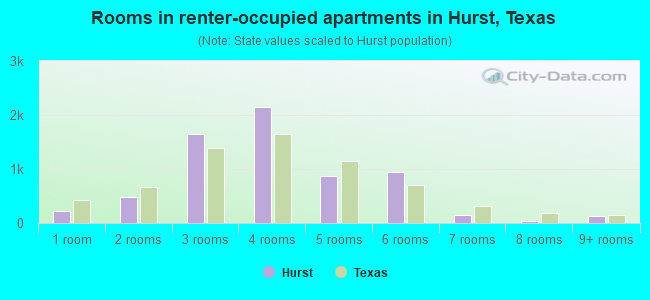
- Rooms in renter-occupied apartments in Hurst, Texas
- 2261 room
- 4772 rooms
- 1,6533 rooms
- 2,1424 rooms
- 8695 rooms
- 9426 rooms
- 1557 rooms
- 388 rooms
- 1219+ rooms
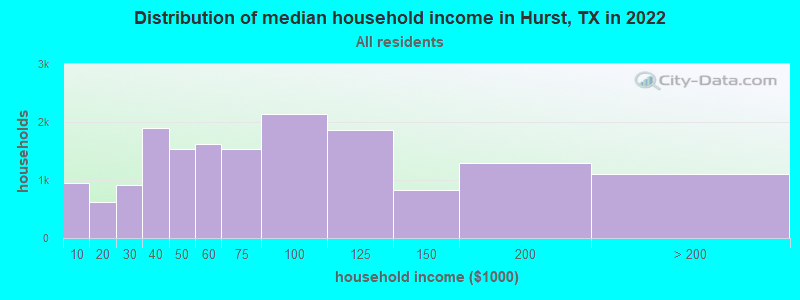
Hurst, TX household income distribution

- 952Less than $10,000
- 614$10,000 to $19,999
- 912$20,000 to $29,999
- 1,898$30,000 to $39,999
- 1,535$40,000 to $49,999
- 1,627$50,000 to $59,999
- 1,526$60,000 to $74,999
- 2,139$75,000 to $99,999
- 1,856$100,000 to $124,999
- 836$125,000 to $149,999
- 1,301$150,000 to $199,999
- 1,100$200,000 or more
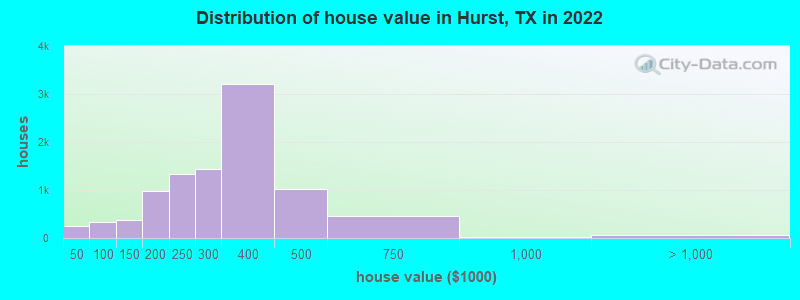
Home value of owner - occupied houses in 2022 in Hurst, TX
-
- 79Less than $10,000
- 29$10,000 to $14,999
- 7$15,000 to $19,999
- 44$20,000 to $24,999
- 50$25,000 to $29,999
- 21$35,000 to $39,999
- 16$40,000 to $49,999
- 72$50,000 to $59,999
- 100$70,000 to $79,999
- 92$80,000 to $89,999
- 46$90,000 to $99,999
- 121$100,000 to $124,999
- 246$125,000 to $149,999
- 408$150,000 to $174,999
- 575$175,000 to $199,999
- 1,329$200,000 to $249,999
- 1,439$250,000 to $299,999
- 3,203$300,000 to $399,999
- 1,026$400,000 to $499,999
- 468$500,000 to $749,999
- 10$750,000 to $999,999
- 43$1,000,000 to $1,499,999
- 21$2,000,000 or more
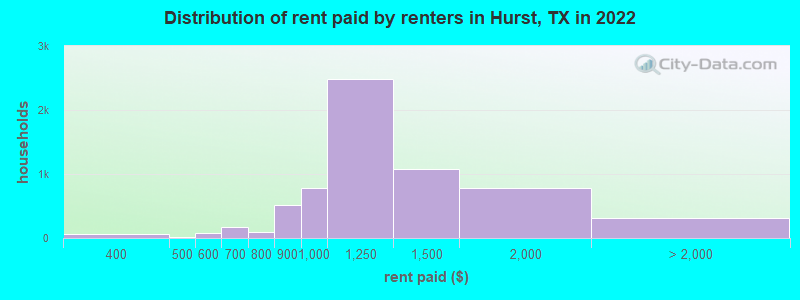
Rent paid by renters in 2022 in Hurst, TX
-
- 9$200 to $249
- 11$250 to $299
- 59$350 to $399
- 22$450 to $499
- 73$500 to $549
- 132$600 to $649
- 39$650 to $699
- 31$700 to $749
- 68$750 to $799
- 518$800 to $899
- 785$900 to $999
- 2,477$1,000 to $1,249
- 1,080$1,250 to $1,499
- 781$1,500 to $1,999
- 135$2,000 to $2,499
- 50$2,500 to $2,999
- 120No cash rent
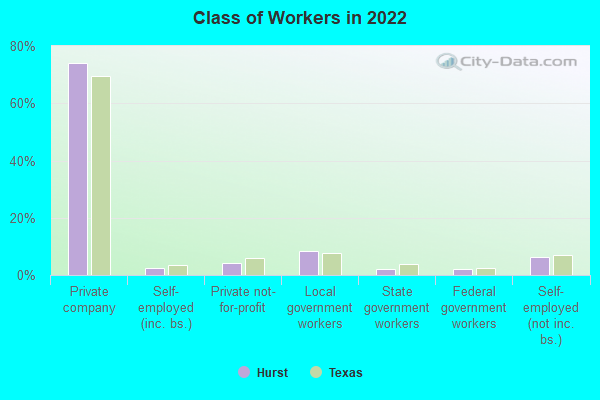
Percentage of workers working in this county: 83.2%
Number of people working at home: 3,418 (16.4% of all workers)
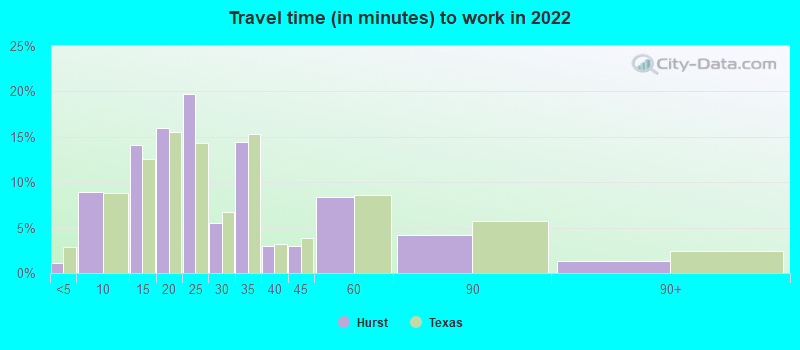
Travel time to work (commute)
- Less than 5 minutes: 187
- 5 to 9 minutes: 1,422
- 10 to 14 minutes: 2,020
- 15 to 19 minutes: 2,350
- 20 to 24 minutes: 3,649
- 25 to 29 minutes: 1,358
- 30 to 34 minutes: 3,220
- 35 to 39 minutes: 510
- 40 to 44 minutes: 600
- 45 to 59 minutes: 1,119
- 60 to 89 minutes: 1,029
- 90 or more minutes: 78
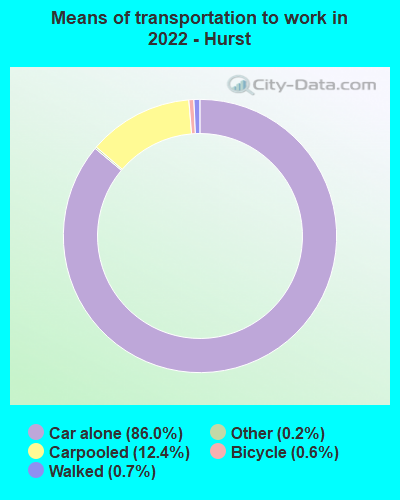
Means of transportation to work:
- Drove a car alone: 14,218 (71.2%)
- Carpooled: 2,119 (10.6%)
- Bus: 12 (0.1%)
- Taxi: 43 (0.2%)
- Bicycle: 76 (0.4%)
- Walked: 119 (0.6%)
- Worked at home: 3,418 (17.1%)
- Unemployment by race in 2022
- Unemployment rate for White non-Hispanic residents
- 2.9%Males
- 2.2%Females
- Unemployment rate for Black residents
- 6.6%Males
- Unemployment rate for Asian residents
- 1.9%Females
- Unemployment rate for other race residents
- 13.3%Males
- Unemployment rate for two or more race residents
- 0.9%Females
- Unemployment rate for Hispanic or Latino residents
- 3.8%Males
- 0.5%Females
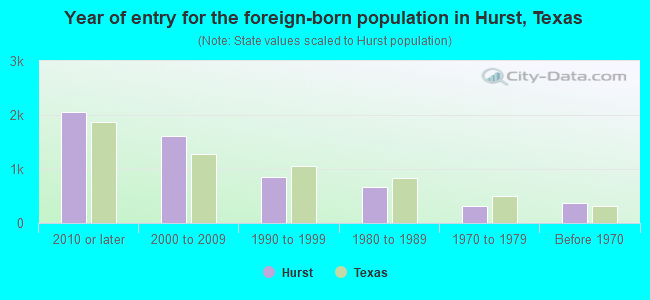
- Year of entry for the foreign-born population in Hurst, Texas
- 2,0472010 or later
- 1,6102000 to 2009
- 8481990 to 1999
- 6651980 to 1989
- 3131970 to 1979
- 373Before 1970
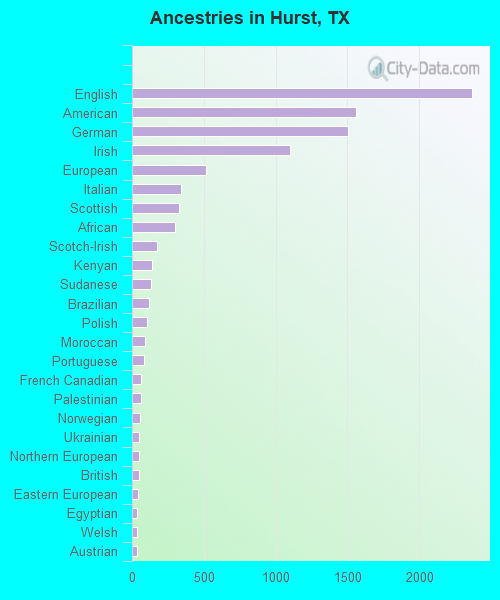
First ancestries reported:
- English: 2,369 (11.7%)
- American: 1,563 (7.7%)
- German: 1,504 (7.4%)
- Irish: 1,102 (5.4%)
- European: 519 (2.6%)
- Italian: 344 (1.7%)
- Scottish: 328 (1.6%)
- African: 303 (1.5%)
- Scotch-Irish: 174 (0.9%)
- Kenyan: 140 (0.7%)
- Sudanese: 135 (0.7%)
- Brazilian: 118 (0.6%)
- Polish: 106 (0.5%)
- Moroccan: 92 (0.5%)
- Portuguese: 86 (0.4%)
- French Canadian: 65 (0.3%)
- Palestinian: 64 (0.3%)
- Norwegian: 54 (0.3%)
- Ukrainian: 51 (0.3%)
- Northern European: 49 (0.2%)
- British: 48 (0.2%)
- Eastern European: 44 (0.2%)
- Egyptian: 38 (0.2%)
- Welsh: 38 (0.2%)
- Austrian: 32 (0.2%)
- Greek: 28 (0.1%)
- Jamaican: 26 (0.1%)
- Canadian: 25 (0.1%)
- French: 23 (0.1%)
- Swedish: 23 (0.1%)
- Belgian: 19 (0.09%)
- Swiss: 17 (0.08%)
- Russian: 12 (0.06%)
- Jordanian: 12 (0.06%)
- Czech: 12 (0.06%)
- Slovak: 11 (0.05%)
- Dutch: 11 (0.05%)
- Syrian: 10 (0.05%)
- Danish: 9 (0.04%)
- Lebanese: 6 (0.03%)
- Hungarian: 3 (0.01%)
Most common places of birth for foreign-born residents (%):
| Hurst: | 33.3% (1,869) |
| Texas: | 48.4% (2,411,723) |
| Hurst: | 9.8% (548) |
| Texas: | 1.5% (72,413) |
| Hurst: | 5.2% (290) |
| Texas: | 1.8% (87,382) |
| Hurst: | 5.0% (282) |
| Texas: | 1.2% (62,159) |
| Hurst: | 4.4% (249) |
| Texas: | 0.2% (9,654) |
| Hurst: | 4.3% (241) |
| Texas: | 4.5% (224,455) |
| Hurst: | 3.6% (204) |
| Texas: | 0.1% (5,522) |
| Hurst: | 2.8% (156) |
| Texas: | 3.0% (147,182) |
| Hurst: | 2.5% (143) |
| Texas: | 2.1% (103,148) |
| Hurst: | 2.5% (139) |
| Texas: | 3.7% (184,770) |
| Hurst: | 2.5% (138) |
| Texas: | 1.2% (60,172) |
| Hurst: | 2.3% (129) |
| Texas: | 6.1% (306,347) |
| Hurst: | 2.1% (116) |
| Texas: | 0.1% (4,509) |
| Hurst: | 2.0% (114) |
| Texas: | 2.3% (115,558) |
| Hurst: | 2.0% (114) |
| Texas: | 0.1% (5,241) |
| Hurst: | 2.0% (111) |
| Texas: | 1.3% (62,978) |
| Hurst: | 1.7% (93) |
| Texas: | 0.2% (9,294) |
Place of birth for U.S.-born residents:
- This state: 22,613
- Other state: 11,970
- Northeast: 1,252
- Midwest: 3,509
- South: 3,612
- West: 3,627
91.3% of Hurst residents lived in the same house 1 years ago.
Out of people who lived in different houses, 39.0% lived in this county.
Out of people who lived in different counties, 79.4% lived in Texas.
| Hurst: | 91.3% |
| State average: | 85.7% |
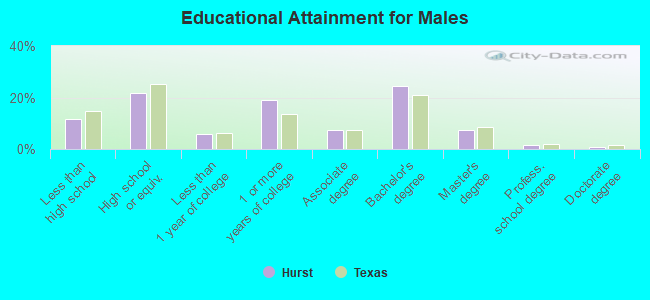
Education attainment for males 25 years and older:
- No schooling: 283
- Nursery to 4th grade: 43
- 5th and 6th grade: 80
- 7th and 8th grade: 162
- 9th grade: 430
- 10th grade: 198
- 11th grade: 107
- 12th grade, no diploma: 220
- High school graduate (or equivalency): 2,826
- Less than 1 year of college: 783
- Some college more than 1 year, no degree: 2,471
- Associate degree: 964
- Bachelor's degree: 3,205
- Master's degree: 959
- Professional school degree: 193
- Doctorate degree: 112
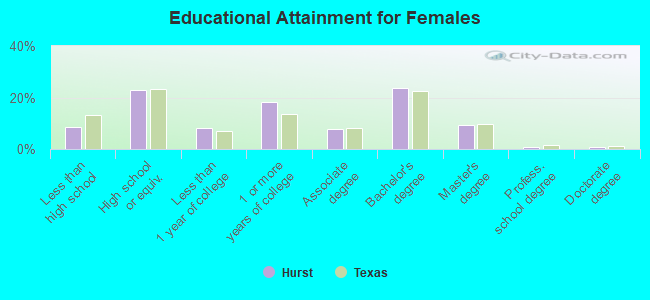
Education attainment for females 25 years and older:
- No schooling: 295
- Nursery to 4th grade: 66
- 5th and 6th grade: 165
- 7th and 8th grade: 106
- 9th grade: 91
- 10th grade: 135
- 11th grade: 157
- 12th grade, no diploma: 235
- High school graduate (or equivalency): 3,346
- Less than 1 year of college: 1,161
- Some college more than 1 year, no degree: 2,628
- Associate degree: 1,131
- Bachelor's degree: 3,419
- Master's degree: 1,349
- Professional school degree: 122
- Doctorate degree: 122


Housing units in structures:
- One, detached: 11,042
- One, attached: 647
- Two: 311
- 3 or 4: 1,165
- 5 to 9: 1,499
- 10 to 19: 1,660
- 20 to 49: 338
- 50 or more: 431
- Mobile homes: 211
- Boats, RVs, vans, etc.: 13
Median worth of mobile homes: $105,153
Housing units lacking complete kitchen facilities in 2022: 1.7%
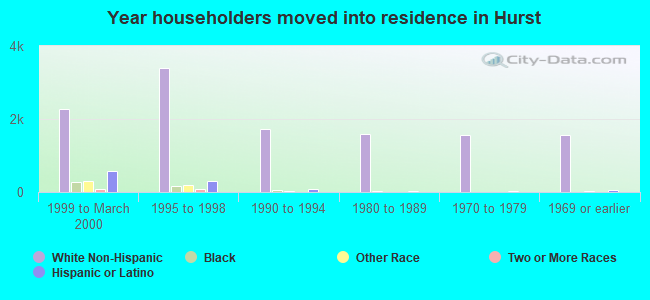
House/condo owner moved in on average 15 years ago
Renter moved in on average 4 years ago
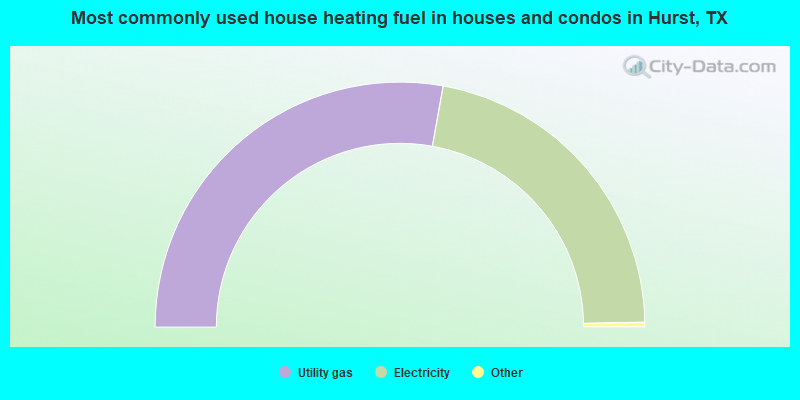
- 55.7%Utility gas
- 43.8%Electricity
- 0.2%Bottled, tank, or LP gas
- 0.2%Wood
- 0.2%No fuel used
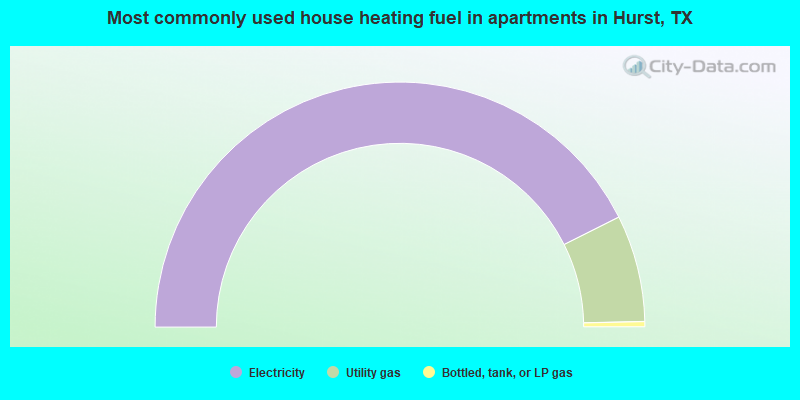
- 85.2%Electricity
- 14.1%Utility gas
- 0.7%Bottled, tank, or LP gas
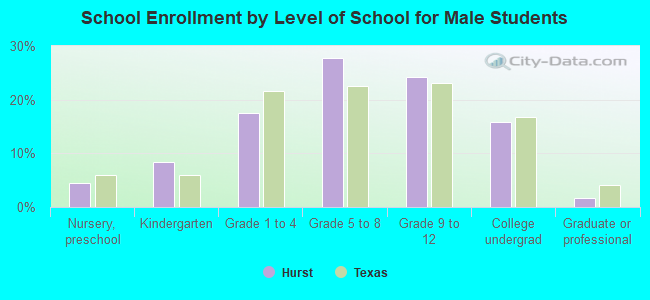
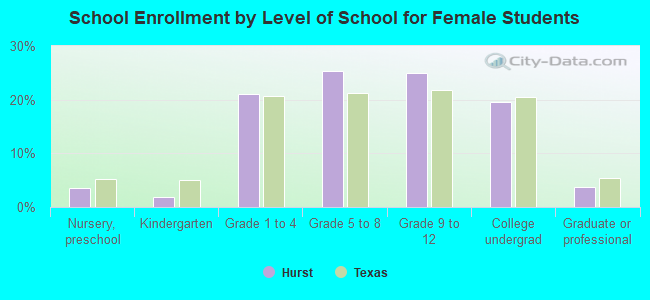
Private vs. public school enrollment:
| Here: | 12.2% |
| Texas: | 8.8% |
| Here: | 8.7% |
| Texas: | 8.0% |
| Here: | 12.5% |
| Texas: | 16.2% |