Irving, TX (Texas) Houses and Residents
Estimated median house or condo value in 2022: $292,600 (it was $92,600 in 2000 )
Irving:
$292,600Texas:
$275,400
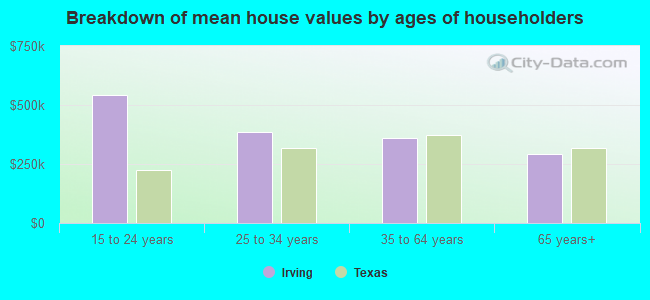
Lower value quartile - upper value quartile: $205,200 - $460,500Mean price in 2022: Detached houses: $349,761 Here:
$349,761State:
$369,058
Townhouses or other attached units: $390,307 Here:
$390,307State:
$327,631
In 2-unit structures: $378,985 Here:
$378,985State:
$374,947
In 3-to-4-unit structures: $278,103 Here:
$278,103State:
$209,652
In 5-or-more-unit structures: $236,843 Here:
$236,843State:
$413,944
Mobile homes: $37,808 Here:
$37,808State:
$124,413
Occupied boats, RVs, vans, etc.: $30,418 Here:
$30,418State:
$73,921
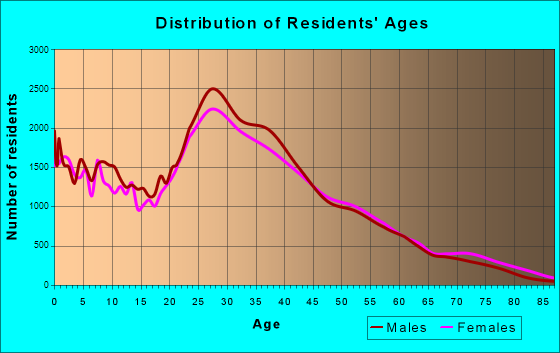
Total population: 232,406 (Urban population: 191,503, Rural population: 108 (all nonfarm) )
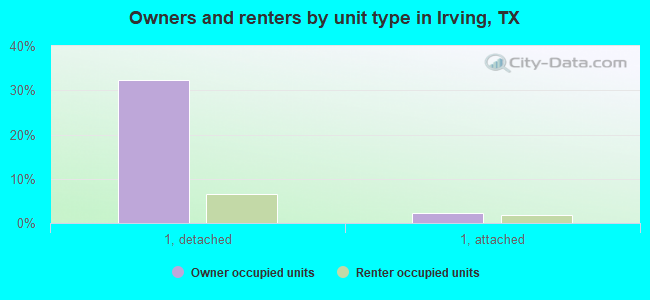
Houses: 99,501 (93,837 occupied: 36,308 owner occupied, 57,529 renter occupied )
% of renters here:
61%State:
38%
Housing density: 1,480 houses/condos per square mile
Median price asked for vacant for-sale houses and condos in 2022: $406,306.
Median contract rent in 2022: $1,332 (lower quartile is $1,064, upper quartile is $1,691)
Median rent asked for vacant for-rent units in 2022: $1,480
Median gross rent in Irving, TX in 2022: $1,495
Housing units in Irving with a mortgage: 20,142 (1,028 second mortgage, 27 home equity loan, 815 both second mortgage and home equity loan )Houses without a mortgage: 425
Median household income for houses/condos with a mortgage: $118,452
Median household income for apartments without a mortgage: $80,735
Median monthly housing costs: $1,481
Data:
Median house or condo value ($)
Median house or condo value ($ change since 2000)
Median house or condo value ($) - White
Median house or condo value ($) - Black or African American
Median house or condo value ($) - Asian
Median house or condo value ($) - Hispanic or Latino
Median house or condo value ($) - American Indian and Alaska Native
Median house or condo value ($) - Multirace
Median house or condo value ($) - Other Race
Median price asked for mobile homes ($)
Household density (households per square mile)
Mean house or condo value by units in structure - 1, detached ($)
Mean house or condo value by units in structure - 1, attached ($)
Mean house or condo value by units in structure - 2 ($)
Mean house or condo value by units in structure by units in structure - 3 or 4 ($)
Mean house or condo value by units in structure - 5 or more ($)
Mean house or condo value by units in structure - Boat, RV, van, etc. ($)
Mean house or condo value by units in structure - Mobile home ($)
Median contract rent ($)
Median contract rent - Lower quartile ($)
Median contract rent - Upper quartile ($)
Median gross rent ($)
Urban houses (%)
Rural houses (%)
Houses occupied (%)
Houses occupied (% change since 2000)
Houses owner occupied (%)
Houses owner occupied (% change since 2000)
Houses renter occupied (%)
Houses renter occupied (% change since 2000)
Vacant housing units - For rent (%)
Vacant housing units - For rent (% change since 2000)
Vacant housing units - For sale only (%)
Vacant housing units - For sale only (% change since 2000)
Vacant housing units - Rented or sold, not occupied (%)
Vacant housing units - Rented or sold, not occupied (% change since 2000)
Vacant housing units - For seasonal, recreational, or occasional use (%)
Vacant housing units - For seasonal, recreational, or occasional use (% change since 2000)
Vacant housing units - For migrant workers (%)
Vacant housing units - For migrant workers (% change since 2000)
Vacant housing units - Other vacant (%)
Vacant housing units - Other vacant (% change since 2000)
Median monthly housing costs ($)
Median household income for houses/condos with a mortgage ($)
Median household income for houses/condos without a mortgage ($)
Median household income ($)
Median household income ($) - White
Median household income ($) - Black or African American
Median household income ($) - Asian
Median household income ($) - Hispanic or Latino
Median household income ($) - American Indian and Alaska Native
Median household income ($) - Multirace
Median household income ($) - Other Race
Mortgage status - with mortgage (%)
Mortgage status - with second mortgage (%)
Mortgage status - with home equity loan (%)
Mortgage status - with both second mortgage and home equity loan (%)
Mortgage status - without a mortgage (%)
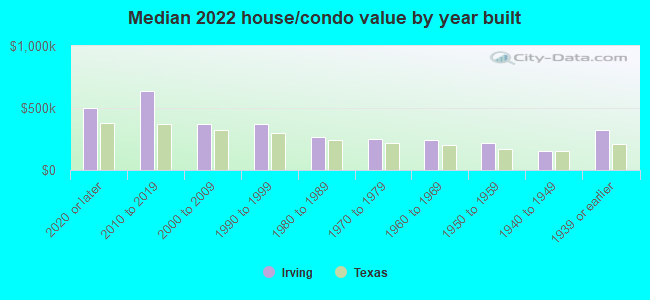
Median year house/condo built
Median year apartment built
Household type by relationship - Male householder living alone (%)
Household type by relationship - Male householder not living alone (%)
Household type by relationship - Female householder living alone (%)
Household type by relationship - Female householder not living alone (%)
Household type by relationship - Opposite-Sex spouse (%)
Household type by relationship - Same-Sex spouse (%)
Household type by relationship - Opposite-Sex unmarried partner (%)
Household type by relationship - Same-Sex unmarried partner (%)
Household type by relationship - In group quarters (%)
Size of family households - 2-person household (%)
Size of family households - 3-person household (%)
Size of family households - 4-person household (%)
Size of family households - 5-person household (%)
Size of family households - 6-person household (%)
Size of family households - 7-or-more-person household (%)
Size of nonfamily households - 1-person household (%)
Size of nonfamily households - 2-person household (%)
Size of nonfamily households - 3-person household (%)
Size of nonfamily households - 4-person household (%)
Size of nonfamily households - 5-person household (%)
Size of nonfamily households - 6-person household (%)
Size of nonfamily households - 7-or-moreperson household (%)
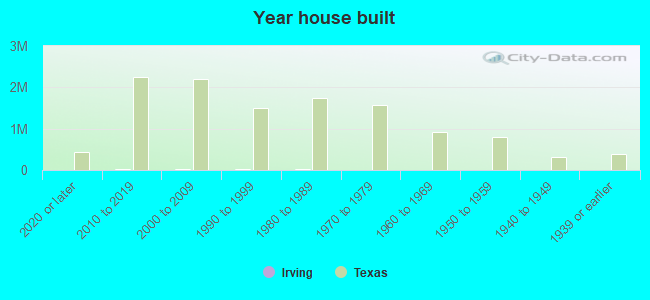
Year house built - Built 2010 or later (%)
Year house built - Built 2000 to 2009 (%)
Year house built - Built 1990 to 1999 (%)
Year house built - Built 1980 to 1989 (%)
Year house built - Built 1970 to 1979 (%)
Year house built - Built 1960 to 1969 (%)
Year house built - Built 1950 to 1959 (%)
Year house built - Built 1940 to 1949 (%)
Year house built - Built 1939 or earlier (%)
Median number of rooms in houses and condos
Median number of rooms in apartments
Median number of bedrooms in owner occupied houses
Mean number of bedrooms in owner occupied houses
Median number of bedrooms in renter occupied houses
Mean number of bedrooms in renter occupied houses
Median number of vehichles in owner occupied houses
Mean number of vehichles in owner occupied houses
Median number of vehichles in renter occupied houses
Mean number of vehichles in renter occupied houses
Rooms in owner-occupied houses - 1 room (%)
Rooms in owner-occupied houses - 2 rooms (%)
Rooms in owner-occupied houses - 3 rooms (%)
Rooms in owner-occupied houses - 4 rooms (%)
Rooms in owner-occupied houses - 5 rooms (%)
Rooms in owner-occupied houses - 6 rooms (%)
Rooms in owner-occupied houses - 7 rooms (%)
Rooms in owner-occupied houses - 8 rooms (%)
Rooms in owner-occupied houses - 9+ rooms (%)
Rooms in renter-occupied houses - 1 room (%)
Rooms in renter-occupied houses - 2 rooms (%)
Rooms in renter-occupied houses - 3 rooms (%)
Rooms in renter-occupied houses - 4 rooms (%)
Rooms in renter-occupied houses - 5 rooms (%)
Rooms in renter-occupied houses - 6 rooms (%)
Rooms in renter-occupied houses - 7 rooms (%)
Rooms in renter-occupied houses - 8 rooms (%)
Rooms in renter-occupied houses - 9+ rooms (%)
Bedrooms in owner-occupied houses - no bedrooms (%)
Bedrooms in owner-occupied houses - 1 bedroom (%)
Bedrooms in owner-occupied houses - 2 bedrooms (%)
Bedrooms in owner-occupied houses - 3 bedrooms (%)
Bedrooms in owner-occupied houses - 4 bedrooms (%)
Bedrooms in owner-occupied houses - 5+ bedrooms (%)
Bedrooms in renter-occupied houses - no bedrooms (%)
Bedrooms in renter-occupied houses - 1 bedroom (%)
Bedrooms in renter-occupied houses - 2 bedrooms (%)
Bedrooms in renter-occupied houses - 3 bedrooms (%)
Bedrooms in renter-occupied houses - 4 bedrooms (%)
Bedrooms in renter-occupied houses - 5+ bedrooms (%)
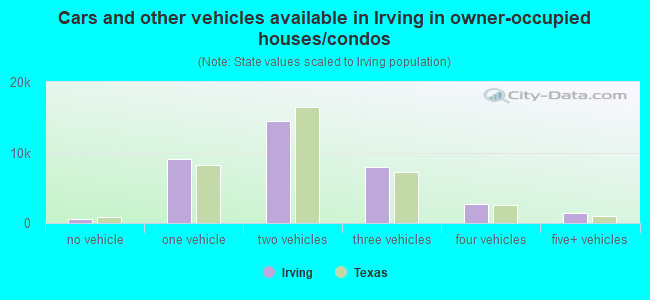
Vehicles available in owner-occupied houses - no vehicle available (%)
Vehicles available in owner-occupied houses - 1 vehicle available(%)
Vehicles available in owner-occupied houses - 2 Vehicles available (%)
Vehicles available in owner-occupied houses - 3 Vehicles available (%)
Vehicles available in owner-occupied houses - 4 Vehicles available (%)
Vehicles available in owner-occupied houses - 5+ Vehicles available (%)
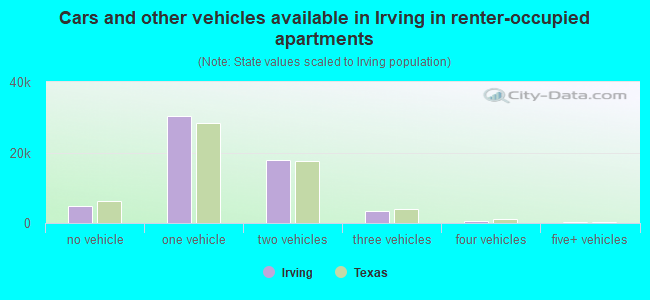
Vehicles available in renter-occupied houses - no vehicle available (%)
Vehicles available in renter-occupied houses - 1 vehicle available (%)
Vehicles available in renter-occupied houses - 2 Vehicles available (%)
Vehicles available in renter-occupied houses - 3 Vehicles available (%)
Vehicles available in renter-occupied houses - 4 Vehicles available (%)
Vehicles available in renter-occupied houses - 5+ Vehicles available (%)
Housing units in structures - 1, detached (%)
Housing units in structures - 1, attached (%)
Housing units in structures - 2 (%)
Housing units in structures - 3 or 4 (%)
Housing units in structures - 5 to 9 (%)
Housing units in structures - 10 to 19 (%)
Housing units in structures - 20 to 49 (%)
Housing units in structures - 50 or more (%)
Housing units in structures - Mobile home (%)
Housing units in structures - Boat, RV, van, etc. (%)
Housing units in structures - Owners - 1, detached (%)
Housing units in structures - Owners - 1, attached (%)
Housing units in structures - Owners - 2 (%)
Housing units in structures - Owners - 3 or 4 (%)
Housing units in structures - Owners - 5 to 9 (%)
Housing units in structures - Owners - 10 to 19 (%)
Housing units in structures - Owners - 20 to 49 (%)
Housing units in structures - Owners - 50 or more (%)
Housing units in structures - Owners - Mobile home (%)
Housing units in structures - Owners - Boat, RV, van, etc. (%)
Housing units in structures - Renters - 1, detached (%)
Housing units in structures - Renters - 1, attached (%)
Housing units in structures - Renters - 2 (%)
Housing units in structures - Renters - 3 or 4 (%)
Housing units in structures - Renters - 5 to 9 (%)
Housing units in structures - Renters - 10 to 19 (%)
Housing units in structures - Renters - 20 to 49 (%)
Housing units in structures - Renters - 50 or more (%)
Housing units in structures - Renters - Mobile home (%)
Housing units in structures - Renters - Boat, RV, van, etc. (%)
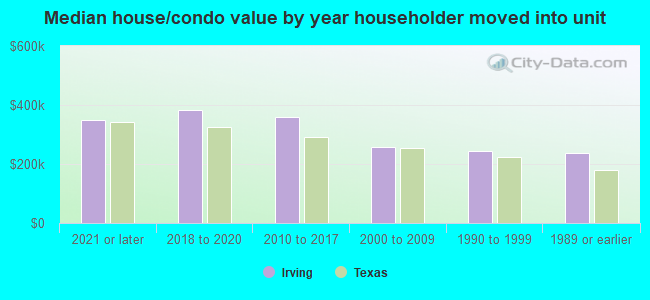
House/condo owner moved in on average (years ago)
Renter moved in on average (years ago)
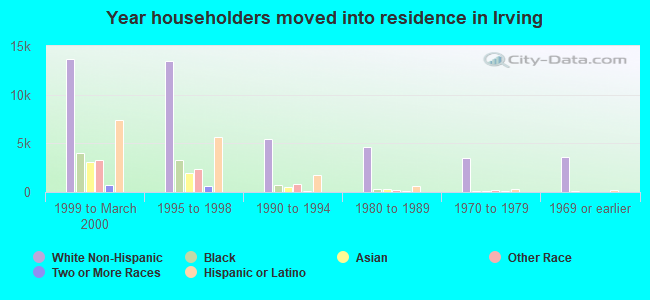
Year householder moved into unit - Moved in 1999 to March 2000 (%)
Year householder moved into unit - Moved in 1999 to March 2000 (%) - White
Year householder moved into unit - Moved in 1999 to March 2000 (%) - Black or African American
Year householder moved into unit - Moved in 1999 to March 2000 (%) - Asian
Year householder moved into unit - Moved in 1999 to March 2000 (%) - Hispanic or Latino
Year householder moved into unit - Moved in 1999 to March 2000 (%) - American Indian and Alaska Native
Year householder moved into unit - Moved in 1999 to March 2000 (%) - Multirace
Year householder moved into unit - Moved in 1999 to March 2000 (%) - Other Race
Year householder moved into unit - Moved in 1995 to 1998 (%)
Year householder moved into unit - Moved in 1995 to 1998 (%) - White
Year householder moved into unit - Moved in 1995 to 1998 (%) - Black or African American
Year householder moved into unit - Moved in 1995 to 1998 (%) - Asian
Year householder moved into unit - Moved in 1995 to 1998 (%) - Hispanic or Latino
Year householder moved into unit - Moved in 1995 to 1998 (%) - American Indian and Alaska Native
Year householder moved into unit - Moved in 1995 to 1998 (%) - Multirace
Year householder moved into unit - Moved in 1995 to 1998 (%) - Other Race
Year householder moved into unit - Moved in 1990 to 1994 (%)
Year householder moved into unit - Moved in 1990 to 1994 (%) - White
Year householder moved into unit - Moved in 1990 to 1994 (%) - Black or African American
Year householder moved into unit - Moved in 1990 to 1994 (%) - Asian
Year householder moved into unit - Moved in 1990 to 1994 (%) - Hispanic or Latino
Year householder moved into unit - Moved in 1990 to 1994 (%) - American Indian and Alaska Native
Year householder moved into unit - Moved in 1990 to 1994 (%) - Multirace
Year householder moved into unit - Moved in 1990 to 1994 (%) - Other Race
Year householder moved into unit - Moved in 1980 to 1989 (%)
Year householder moved into unit - Moved in 1980 to 1989 (%) - White
Year householder moved into unit - Moved in 1980 to 1989 (%) - Black or African American
Year householder moved into unit - Moved in 1980 to 1989 (%) - Asian
Year householder moved into unit - Moved in 1980 to 1989 (%) - Hispanic or Latino
Year householder moved into unit - Moved in 1980 to 1989 (%) - American Indian and Alaska Native
Year householder moved into unit - Moved in 1980 to 1989 (%) - Multirace
Year householder moved into unit - Moved in 1980 to 1989 (%) - Other Race
Year householder moved into unit - Moved in 1970 to 1979 (%)
Year householder moved into unit - Moved in 1970 to 1979 (%) - White
Year householder moved into unit - Moved in 1970 to 1979 (%) - Black or African American
Year householder moved into unit - Moved in 1970 to 1979 (%) - Asian
Year householder moved into unit - Moved in 1970 to 1979 (%) - Hispanic or Latino
Year householder moved into unit - Moved in 1970 to 1979 (%) - American Indian and Alaska Native
Year householder moved into unit - Moved in 1970 to 1979 (%) - Multirace
Year householder moved into unit - Moved in 1970 to 1979 (%) - Other Race
Year householder moved into unit - Moved in 1969 or earlier (%)
Year householder moved into unit - Moved in 1969 or earlier (%) - White
Year householder moved into unit - Moved in 1969 or earlier (%) - Black or African American
Year householder moved into unit - Moved in 1969 or earlier (%) - Asian
Year householder moved into unit - Moved in 1969 or earlier (%) - Hispanic or Latino
Year householder moved into unit - Moved in 1969 or earlier (%) - American Indian and Alaska Native
Year householder moved into unit - Moved in 1969 or earlier (%) - Multirace
Year householder moved into unit - Moved in 1969 or earlier (%) - Other Race
Housing units lacking complete plumbing facilities (%)
Housing units lacking complete kitchen facilities (%)
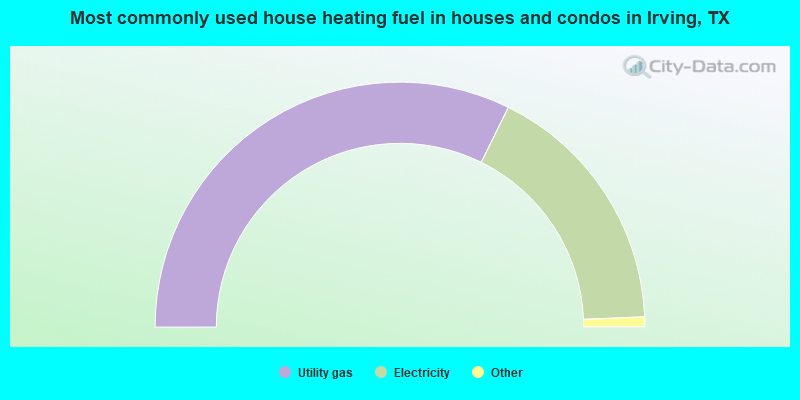
House heating fuel used in houses and condos - Utility gas (%)
House heating fuel used in houses and condos - Bottled, tank, or LP gas (%)
House heating fuel used in houses and condos - Electricity (%)
House heating fuel used in houses and condos - Fuel oil, kerosene, etc. (%)
House heating fuel used in houses and condos - Coal or coke (%)
House heating fuel used in houses and condos - Wood (%)
House heating fuel used in houses and condos - Solar energy (%)
House heating fuel used in houses and condos - Other fuel (%)
House heating fuel used in houses and condos - No fuel used (%)
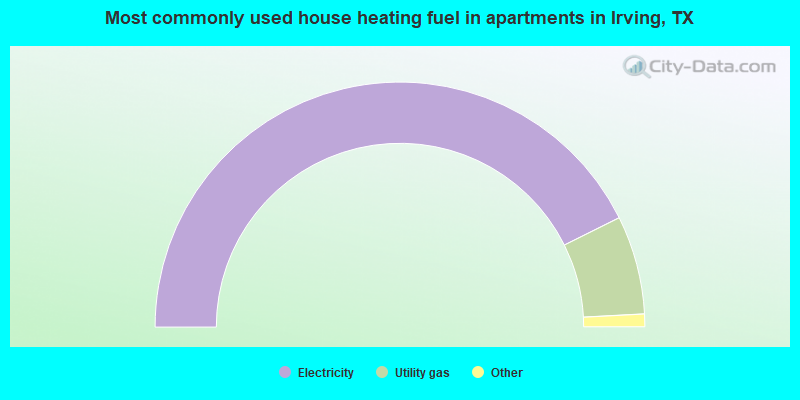
House heating fuel used in apartments - Utility gas (%)
House heating fuel used in apartments - Bottled, tank, or LP gas (%)
House heating fuel used in apartments - Electricity (%)
House heating fuel used in apartments - Fuel oil, kerosene, etc. (%)
House heating fuel used in apartments - Coal or coke (%)
House heating fuel used in apartments - Wood (%)
House heating fuel used in apartments - Solar energy (%)
House heating fuel used in apartments - Other fuel (%)
House heating fuel used in apartments - No fuel used (%)
Latest news about housing in Irving, TX collected exclusively by city-data.com from local newspapers, TV, and radio stations
Median year house/condo built: 1984Median year apartment built: 1989Household type by relationship:
Households: 254,712
Male householders: 52,086 (12,560 living alone ), Female householders: 41,751 (13,796 living alone )44,244 spouses (43,799 opposite-sex spouses ), 5,452 unmarried partners , (5,194 opposite-sex unmarried partners ), 82,445 children (77,640 natural , 2,064 adopted , 2,741 stepchildren ), 7,732 grandchildren , 4,088 brothers or sisters , 3,397 parents , 218 foster children , 4,266 other relatives , 7,522 non-relatives In group quarters: 1,511
Size of family households: 20,817 2-persons , 14,745 3-persons , 15,123 4-persons , 7,197 5-persons , 2,107 6-persons , 1,265 7-or-more-persons .
Size of nonfamily households: 26,356 1-person , 4,828 2-persons , 499 3-persons , 900 4-persons .
43,663 married couples with children. single-parent households (3,988 men , 10,851 women ).
42.8% of residents of Irving speak English at home. of residents speak Spanish at home (54% speak English very well , 14% speak English well , 17% speak English not well , 15% don't speak English at all ).of residents speak other Indo-European language at home (80% speak English very well , 17% speak English well , 3% speak English not well , 1% don't speak English at all ).of residents speak Asian or Pacific Island language at home (79% speak English very well , 13% speak English well , 6% speak English not well , 2% don't speak English at all ).of residents speak other language at home (75% speak English very well , 14% speak English well , 11% speak English not well , 1% don't speak English at all ).
Foreign born population: 100,596 (39.5%)of them are naturalized citizens )
Median number of rooms in houses and condos:
Median number of rooms in apartments
Owner-occupied Renter-occupied
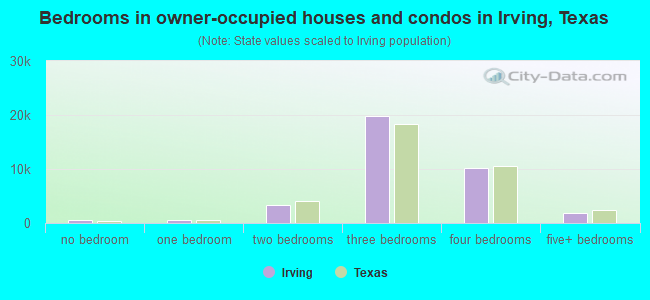
Bedrooms in owner-occupied houses and condos in Irving, Texas
464 no bedroom 556 1 bedroom 3,335 2 bedrooms 19,819 3 bedrooms 10,234 4 bedrooms 1,900 5+ bedrooms
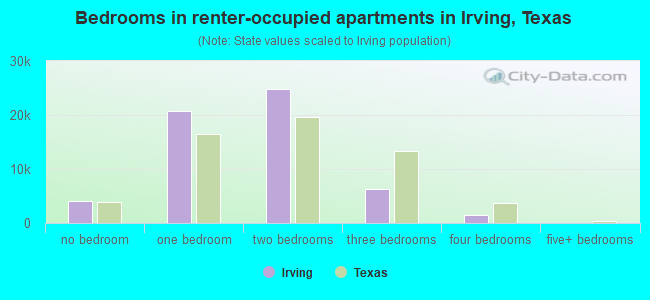
Bedrooms in renter-occupied apartments in Irving, Texas
4,165 no bedroom 20,781 1 bedroom 24,773 2 bedrooms 6,305 3 bedrooms 1,505 4 bedrooms 0 5+ bedrooms
Owner-occupied Renter-occupied
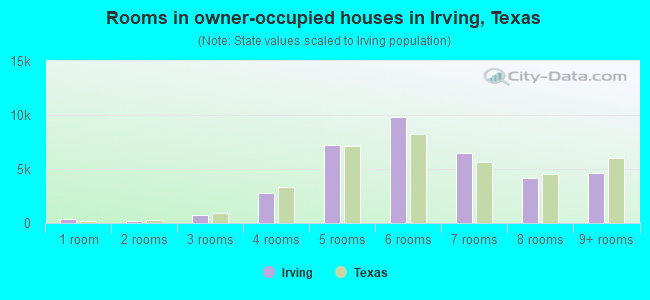
Rooms in owner-occupied houses in Irving, Texas
334 1 room 211 2 rooms 736 3 rooms 2,804 4 rooms 7,176 5 rooms 9,821 6 rooms 6,450 7 rooms 4,146 8 rooms 4,630 9+ rooms
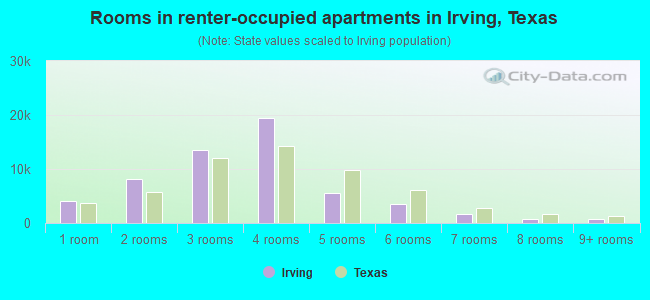
Rooms in renter-occupied apartments in Irving, Texas
4,004 1 room 8,216 2 rooms 13,591 3 rooms 19,396 4 rooms 5,640 5 rooms 3,566 6 rooms 1,703 7 rooms 665 8 rooms 748 9+ rooms
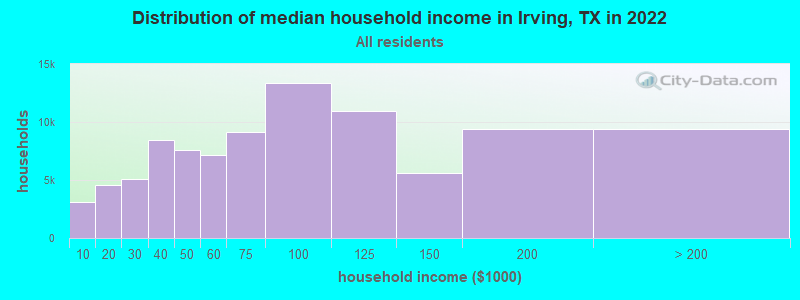
Irving, TX household income distribution 3,134 Less than $10,0004,607 $10,000 to $19,9995,100 $20,000 to $29,9998,418 $30,000 to $39,9997,548 $40,000 to $49,9997,191 $50,000 to $59,9999,142 $60,000 to $74,99913,359 $75,000 to $99,99910,966 $100,000 to $124,9995,567 $125,000 to $149,9999,371 $150,000 to $199,9999,434 $200,000 or more
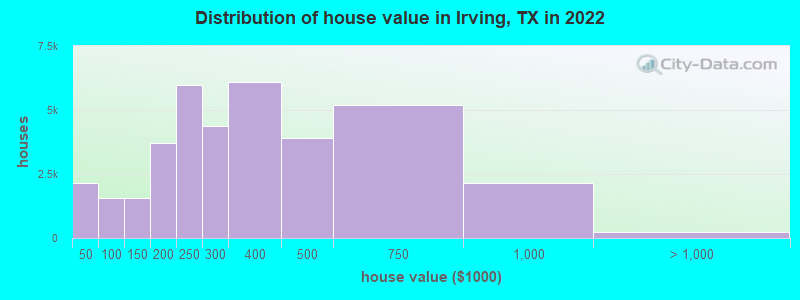
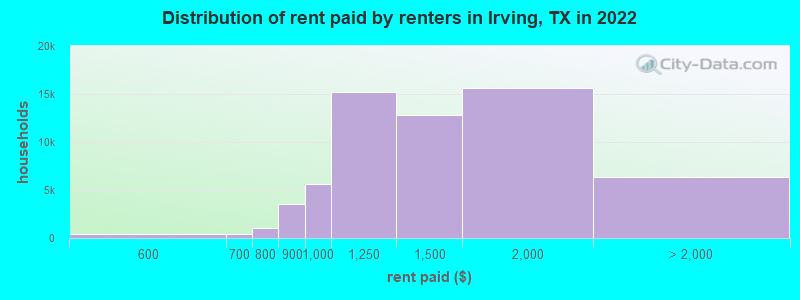
Home value of owner - occupied houses in 2022 in Irving, TX 405 Less than $10,000448 $10,000 to $14,999130 $15,000 to $19,999138 $20,000 to $24,999283 $25,000 to $29,999212 $30,000 to $34,999544 $40,000 to $49,999143 $50,000 to $59,99948 $60,000 to $69,999444 $80,000 to $89,999376 $90,000 to $99,999857 $100,000 to $124,999716 $125,000 to $149,9991,687 $150,000 to $174,9992,025 $175,000 to $199,9995,968 $200,000 to $249,9994,375 $250,000 to $299,9996,081 $300,000 to $399,9993,887 $400,000 to $499,9995,191 $500,000 to $749,9992,131 $750,000 to $999,999145 $1,000,000 to $1,499,99974 $2,000,000 or moreRent paid by renters in 2022 in Irving, TX 49 Less than $10022 $100 to $14979 $150 to $19929 $200 to $24967 $250 to $29922 $300 to $34935 $350 to $39948 $400 to $44923 $450 to $499256 $500 to $549140 $550 to $599290 $600 to $649164 $650 to $699365 $700 to $749672 $750 to $7993,500 $800 to $8995,577 $900 to $99915,173 $1,000 to $1,24912,764 $1,250 to $1,49915,611 $1,500 to $1,9993,725 $2,000 to $2,499816 $2,500 to $2,999418 $3,000 to $3,499166 $3,500 or more1,194 No cash rent
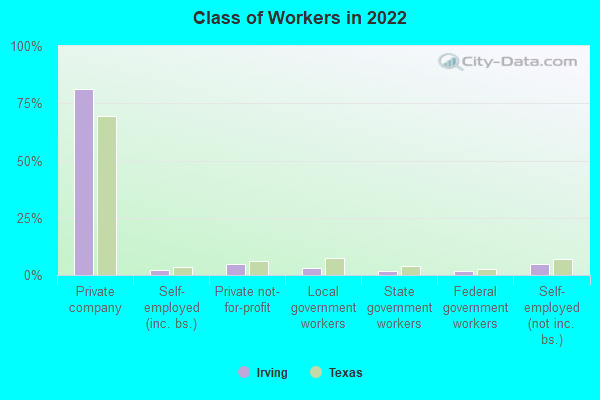
Percentage of workers working in this county: 78.7%Number of people working at home: 24,610 (18.4% of all workers )
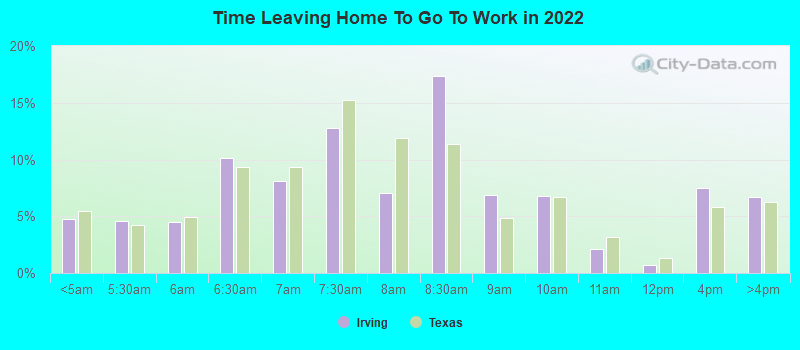
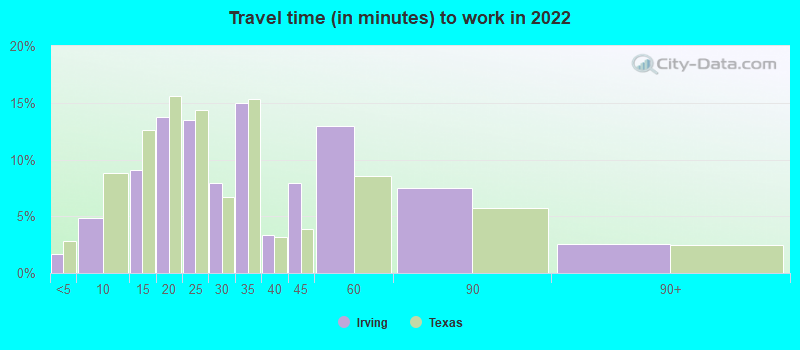
Travel time to work (commute)
Less than 5 minutes: 2,0135 to 9 minutes: 6,89710 to 14 minutes: 14,21415 to 19 minutes: 21,09520 to 24 minutes: 21,41225 to 29 minutes: 9,09730 to 34 minutes: 16,81735 to 39 minutes: 2,84040 to 44 minutes: 2,84445 to 59 minutes: 6,90860 to 89 minutes: 3,35190 or more minutes: 1,300
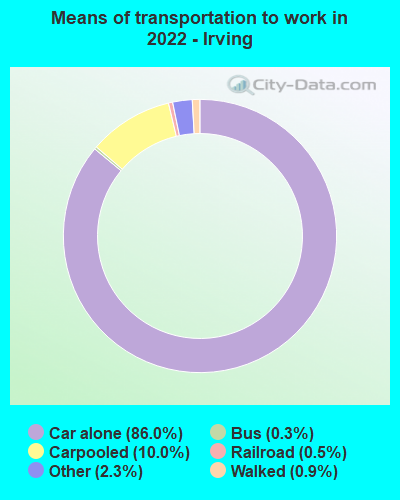
Means of transportation to work:
Drove a car alone: 135,218 (74.4%)Carpooled: 15,688 (8.6%)Bus : 498 (0.3%)Light rail, streetcar or trolley : 737 (0.4%)Taxi: 3,634 (2.0%)Bicycle: 113 (0.1%)Walked: 1,350 (0.7%)Worked at home: 24,610 (13.5%)
Unemployment by race in 2022
Unemployment rate for White non-Hispanic residents 1.9% Males5.0% FemalesUnemployment rate for Black residents 7.6% Males3.8% FemalesUnemployment rate for American Indian and Alaska Native residents 6.3% FemalesUnemployment rate for Asian residents 4.9% Males3.6% FemalesUnemployment rate for other race residents 0.4% Males0.7% FemalesUnemployment rate for two or more race residents 10.5% Males1.1% FemalesUnemployment rate for Hispanic or Latino residents 2.4% Males1.4% Females
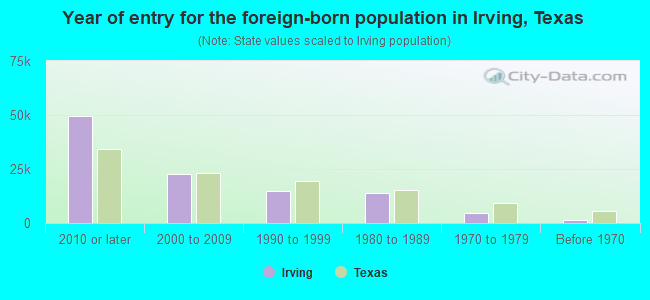
Year of entry for the foreign-born population in Irving, Texas
49,452 2010 or later 22,674 2000 to 2009 14,968 1990 to 1999 14,110 1980 to 1989 4,489 1970 to 1979 1,472 Before 1970
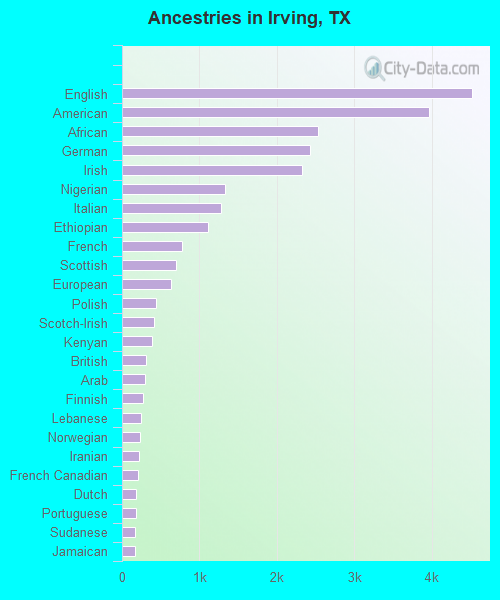
First ancestries reported:
English: 4,516 (2.5%)
American: 3,969 (2.2%)
African: 2,534 (1.4%)
German: 2,431 (1.4%)
Irish: 2,332 (1.3%)
Nigerian: 1,332 (0.7%)
Italian: 1,282 (0.7%)
Ethiopian: 1,109 (0.6%)
French: 772 (0.4%)
Scottish: 696 (0.4%)
European: 629 (0.4%)
Polish: 439 (0.2%)
Scotch-Irish: 412 (0.2%)
Kenyan: 393 (0.2%)
British: 304 (0.2%)
Arab: 298 (0.2%)
Finnish: 266 (0.1%)
Lebanese: 242 (0.1%)
Norwegian: 228 (0.1%)
Iranian: 220 (0.1%)
French Canadian: 201 (0.1%)
Dutch: 180 (0.1%)
Portuguese: 177 (0.10%)
Sudanese: 169 (0.09%)
Jamaican: 168 (0.09%)
Welsh: 165 (0.09%)
Czech: 162 (0.09%)
Brazilian: 147 (0.08%)
Greek: 144 (0.08%)
Egyptian: 126 (0.07%)
Sierra Leonean: 117 (0.07%)
Israeli: 110 (0.06%)
Russian: 100 (0.06%)
South African: 95 (0.05%)
Ugandan: 94 (0.05%)
U.S. Virgin Islander: 88 (0.05%)
Palestinian: 81 (0.05%)
Ukrainian: 79 (0.04%)
Somali: 72 (0.04%)
Swedish: 71 (0.04%)
Turkish: 63 (0.04%)
Hungarian: 61 (0.03%)
Danish: 56 (0.03%)
Haitian: 53 (0.03%)
Scandinavian: 52 (0.03%)
Jordanian: 45 (0.03%)
Northern European: 36 (0.02%)
Czechoslovakian: 36 (0.02%)
Slavic: 36 (0.02%)
Syrian: 36 (0.02%)
Guyanese: 31 (0.02%)
Canadian: 30 (0.02%)
Eastern European: 26 (0.01%)
Celtic: 25 (0.01%)
Lithuanian: 25 (0.01%)
Romanian: 22 (0.01%)
Australian: 22 (0.01%)
Barbadian: 22 (0.01%)
Slovak: 19 (0.01%)
Estonian: 17 (0.01%)
Serbian: 16 (0.01%)
German Russian: 16 (0.01%)
Belgian: 15 (0.01%)
Armenian: 14 (0.01%)
Cypriot: 13 (0.01%)
Austrian: 9 (0.01%)
Most common places of birth for foreign-born residents (%): India Irving:
26.8% (29,112)Texas:
6.1% (306,347)
Mexico Irving:
25.1% (27,187)Texas:
48.4% (2,411,723)
El Salvador Irving:
16.4% (17,837)Texas:
4.5% (224,455)
Nepal Irving:
5.2% (5,675)Texas:
0.6% (27,480)
Honduras Irving:
3.1% (3,331)Texas:
3.0% (147,182)
Pakistan Irving:
2.5% (2,703)Texas:
1.2% (62,159)
Place of birth for U.S.-born residents:
This state: 103,215Other state: 47,723Northeast: 6,239Midwest: 12,261South: 17,149West: 12,074 82.6% of Irving residents lived in the same house 1 years ago.
Out of people who lived in different houses, 33.4% lived in this county.
Out of people who lived in different counties, 48.1% lived in Texas.
Irving:
82.6%State average:
85.7%
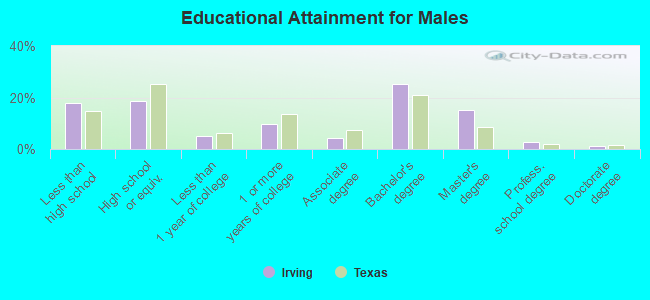
Education attainment for males 25 years and older:
No schooling: 1,627Nursery to 4th grade: 1,2735th and 6th grade: 3,7507th and 8th grade: 1,6079th grade: 2,74710th grade: 1,25411th grade: 91612th grade, no diploma: 1,637High school graduate (or equivalency): 15,434Less than 1 year of college: 4,136Some college more than 1 year, no degree: 8,201Associate degree: 3,687Bachelor's degree: 20,922Master's degree: 12,619Professional school degree: 2,114Doctorate degree: 928
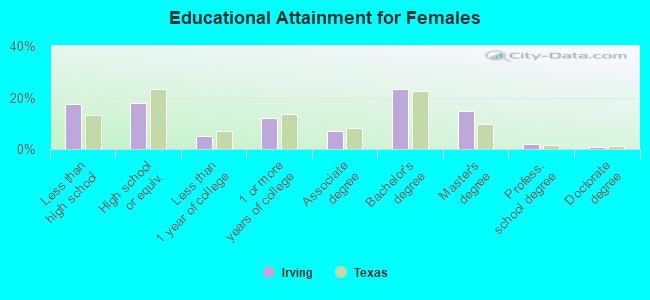
Education attainment for females 25 years and older:
No schooling: 2,113Nursery to 4th grade: 6285th and 6th grade: 2,8687th and 8th grade: 2,2739th grade: 1,89010th grade: 1,75211th grade: 1,17712th grade, no diploma: 1,526High school graduate (or equivalency): 14,845Less than 1 year of college: 4,237Some college more than 1 year, no degree: 9,822Associate degree: 5,767Bachelor's degree: 19,127Master's degree: 12,139Professional school degree: 1,618Doctorate degree: 494
Housing units in structures:
One, detached: 38,678One, attached: 3,799Two: 1,3433 or 4: 6,8735 to 9: 8,78310 to 19: 11,96420 to 49: 10,12050 or more: 15,750Mobile homes: 2,191Median worth of mobile homes: $24,200
Housing units lacking complete plumbing facilities in 2022: 1.1%Housing units lacking complete kitchen facilities in 2022: 1.8%House/condo owner moved in on average 12 years ago
Renter moved in on average 1 years ago
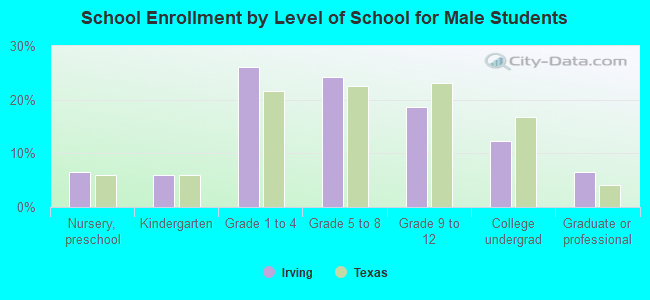
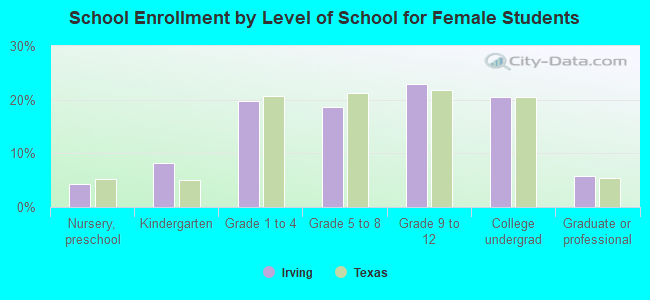
Private vs. public school enrollment:
Students in private schools in grades 1 to 8 (elementary and middle school): 2,403 Students in private schools in grades 9 to 12 (high school): 694 Students in private undergraduate colleges: 2,045