Jefferson City, MO (Missouri) Houses and Residents
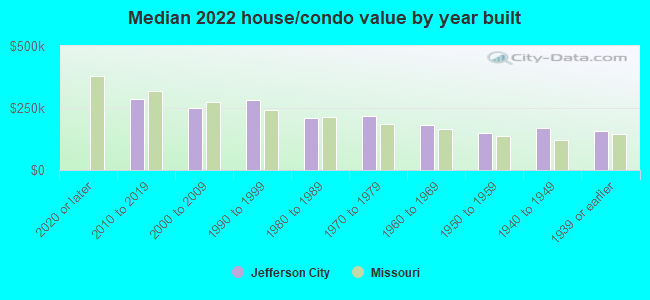
Estimated median house or condo value in 2022: $202,137 (it was $97,700 in 2000 )
Jefferson City:
$202,137Missouri:
$221,200
Lower value quartile - upper value quartile: $145,057 - $273,752Mean price in 2022: Detached houses: $246,037 Here:
$246,037State:
$278,068
Townhouses or other attached units: $279,169 Here:
$279,169State:
$260,773
In 2-unit structures: $319,654 Here:
$319,654State:
$172,667
In 5-or-more-unit structures: $192,514 Here:
$192,514State:
$263,082
Mobile homes: $38,302 Here:
$38,302State:
$95,912
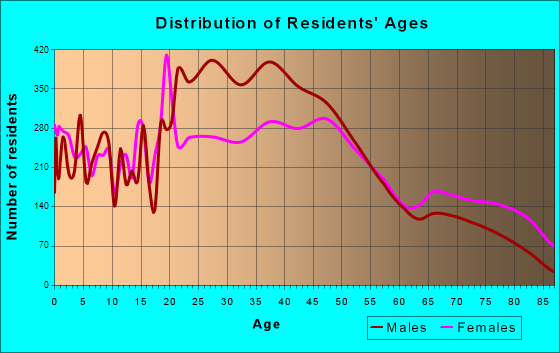
Total population: 43,132 (Urban population: 39,500, Rural population: 21 (all nonfarm) )
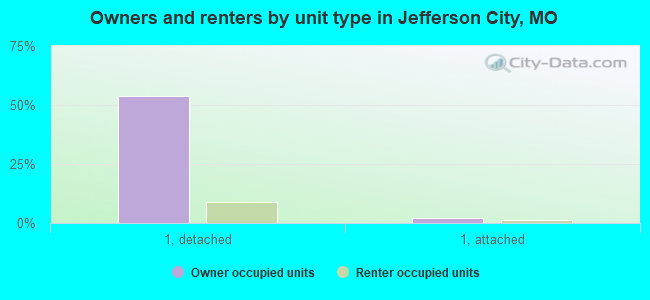
Houses: 19,197 (16,974 occupied: 10,164 owner occupied, 6,995 renter occupied )
% of renters here:
41%State:
32%
Housing density: 704 houses/condos per square mile
Median price asked for vacant for-sale houses and condos in 2022: $347,597.
Median contract rent in 2022: $625 (lower quartile is $504, upper quartile is $783)
Median rent asked for vacant for-rent units in 2022: $943
Median gross rent in Jefferson City, MO in 2022: $787
Housing units in Jefferson City with a mortgage: 5,641 (463 second mortgage, 29 home equity loan, 409 both second mortgage and home equity loan )Houses without a mortgage: 196
Median household income for houses/condos with a mortgage: $98,144
Median household income for apartments without a mortgage: $77,297
Median monthly housing costs: $797
Data:
Median house or condo value ($)
Median house or condo value ($ change since 2000)
Median house or condo value ($) - White
Median house or condo value ($) - Black or African American
Median house or condo value ($) - Asian
Median house or condo value ($) - Hispanic or Latino
Median house or condo value ($) - American Indian and Alaska Native
Median house or condo value ($) - Multirace
Median house or condo value ($) - Other Race
Median price asked for mobile homes ($)
Household density (households per square mile)
Mean house or condo value by units in structure - 1, detached ($)
Mean house or condo value by units in structure - 1, attached ($)
Mean house or condo value by units in structure - 2 ($)
Mean house or condo value by units in structure by units in structure - 3 or 4 ($)
Mean house or condo value by units in structure - 5 or more ($)
Mean house or condo value by units in structure - Boat, RV, van, etc. ($)
Mean house or condo value by units in structure - Mobile home ($)
Median contract rent ($)
Median contract rent - Lower quartile ($)
Median contract rent - Upper quartile ($)
Median gross rent ($)
Urban houses (%)
Rural houses (%)
Houses occupied (%)
Houses occupied (% change since 2000)
Houses owner occupied (%)
Houses owner occupied (% change since 2000)
Houses renter occupied (%)
Houses renter occupied (% change since 2000)
Vacant housing units - For rent (%)
Vacant housing units - For rent (% change since 2000)
Vacant housing units - For sale only (%)
Vacant housing units - For sale only (% change since 2000)
Vacant housing units - Rented or sold, not occupied (%)
Vacant housing units - Rented or sold, not occupied (% change since 2000)
Vacant housing units - For seasonal, recreational, or occasional use (%)
Vacant housing units - For seasonal, recreational, or occasional use (% change since 2000)
Vacant housing units - For migrant workers (%)
Vacant housing units - For migrant workers (% change since 2000)
Vacant housing units - Other vacant (%)
Vacant housing units - Other vacant (% change since 2000)
Median monthly housing costs ($)
Median household income for houses/condos with a mortgage ($)
Median household income for houses/condos without a mortgage ($)
Median household income ($)
Median household income ($) - White
Median household income ($) - Black or African American
Median household income ($) - Asian
Median household income ($) - Hispanic or Latino
Median household income ($) - American Indian and Alaska Native
Median household income ($) - Multirace
Median household income ($) - Other Race
Mortgage status - with mortgage (%)
Mortgage status - with second mortgage (%)
Mortgage status - with home equity loan (%)
Mortgage status - with both second mortgage and home equity loan (%)
Mortgage status - without a mortgage (%)
Median year house/condo built
Median year apartment built
Household type by relationship - Male householder living alone (%)
Household type by relationship - Male householder not living alone (%)
Household type by relationship - Female householder living alone (%)
Household type by relationship - Female householder not living alone (%)
Household type by relationship - Opposite-Sex spouse (%)
Household type by relationship - Same-Sex spouse (%)
Household type by relationship - Opposite-Sex unmarried partner (%)
Household type by relationship - Same-Sex unmarried partner (%)
Household type by relationship - In group quarters (%)
Size of family households - 2-person household (%)
Size of family households - 3-person household (%)
Size of family households - 4-person household (%)
Size of family households - 5-person household (%)
Size of family households - 6-person household (%)
Size of family households - 7-or-more-person household (%)
Size of nonfamily households - 1-person household (%)
Size of nonfamily households - 2-person household (%)
Size of nonfamily households - 3-person household (%)
Size of nonfamily households - 4-person household (%)
Size of nonfamily households - 5-person household (%)
Size of nonfamily households - 6-person household (%)
Size of nonfamily households - 7-or-moreperson household (%)
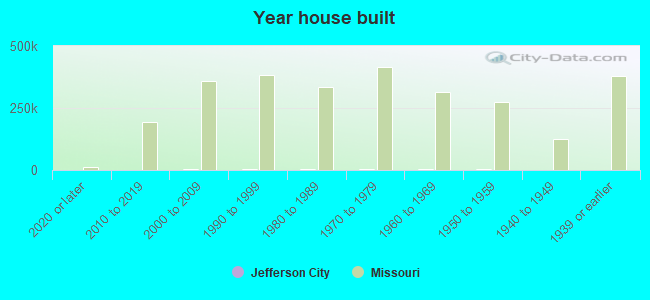
Year house built - Built 2010 or later (%)
Year house built - Built 2000 to 2009 (%)
Year house built - Built 1990 to 1999 (%)
Year house built - Built 1980 to 1989 (%)
Year house built - Built 1970 to 1979 (%)
Year house built - Built 1960 to 1969 (%)
Year house built - Built 1950 to 1959 (%)
Year house built - Built 1940 to 1949 (%)
Year house built - Built 1939 or earlier (%)
Median number of rooms in houses and condos
Median number of rooms in apartments
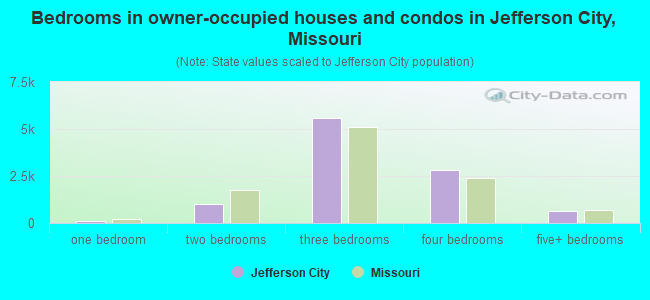
Median number of bedrooms in owner occupied houses
Mean number of bedrooms in owner occupied houses
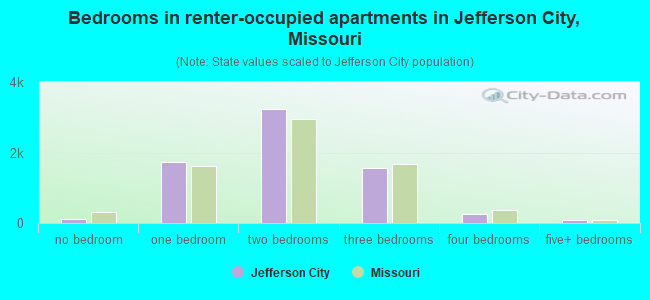
Median number of bedrooms in renter occupied houses
Mean number of bedrooms in renter occupied houses
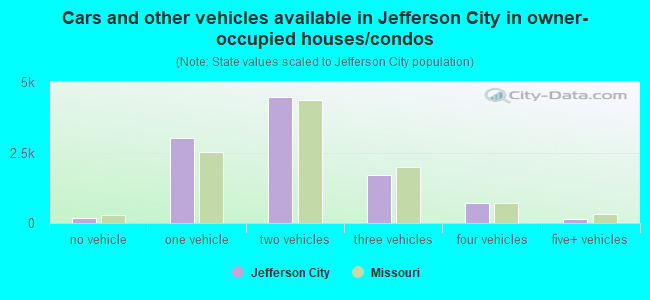
Median number of vehichles in owner occupied houses
Mean number of vehichles in owner occupied houses
Median number of vehichles in renter occupied houses
Mean number of vehichles in renter occupied houses
Rooms in owner-occupied houses - 1 room (%)
Rooms in owner-occupied houses - 2 rooms (%)
Rooms in owner-occupied houses - 3 rooms (%)
Rooms in owner-occupied houses - 4 rooms (%)
Rooms in owner-occupied houses - 5 rooms (%)
Rooms in owner-occupied houses - 6 rooms (%)
Rooms in owner-occupied houses - 7 rooms (%)
Rooms in owner-occupied houses - 8 rooms (%)
Rooms in owner-occupied houses - 9+ rooms (%)
Rooms in renter-occupied houses - 1 room (%)
Rooms in renter-occupied houses - 2 rooms (%)
Rooms in renter-occupied houses - 3 rooms (%)
Rooms in renter-occupied houses - 4 rooms (%)
Rooms in renter-occupied houses - 5 rooms (%)
Rooms in renter-occupied houses - 6 rooms (%)
Rooms in renter-occupied houses - 7 rooms (%)
Rooms in renter-occupied houses - 8 rooms (%)
Rooms in renter-occupied houses - 9+ rooms (%)
Bedrooms in owner-occupied houses - no bedrooms (%)
Bedrooms in owner-occupied houses - 1 bedroom (%)
Bedrooms in owner-occupied houses - 2 bedrooms (%)
Bedrooms in owner-occupied houses - 3 bedrooms (%)
Bedrooms in owner-occupied houses - 4 bedrooms (%)
Bedrooms in owner-occupied houses - 5+ bedrooms (%)
Bedrooms in renter-occupied houses - no bedrooms (%)
Bedrooms in renter-occupied houses - 1 bedroom (%)
Bedrooms in renter-occupied houses - 2 bedrooms (%)
Bedrooms in renter-occupied houses - 3 bedrooms (%)
Bedrooms in renter-occupied houses - 4 bedrooms (%)
Bedrooms in renter-occupied houses - 5+ bedrooms (%)
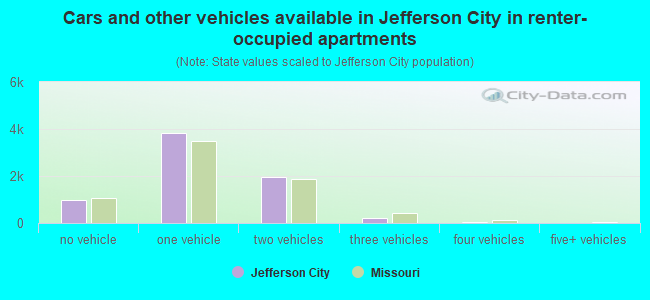
Vehicles available in owner-occupied houses - no vehicle available (%)
Vehicles available in owner-occupied houses - 1 vehicle available(%)
Vehicles available in owner-occupied houses - 2 Vehicles available (%)
Vehicles available in owner-occupied houses - 3 Vehicles available (%)
Vehicles available in owner-occupied houses - 4 Vehicles available (%)
Vehicles available in owner-occupied houses - 5+ Vehicles available (%)
Vehicles available in renter-occupied houses - no vehicle available (%)
Vehicles available in renter-occupied houses - 1 vehicle available (%)
Vehicles available in renter-occupied houses - 2 Vehicles available (%)
Vehicles available in renter-occupied houses - 3 Vehicles available (%)
Vehicles available in renter-occupied houses - 4 Vehicles available (%)
Vehicles available in renter-occupied houses - 5+ Vehicles available (%)
Housing units in structures - 1, detached (%)
Housing units in structures - 1, attached (%)
Housing units in structures - 2 (%)
Housing units in structures - 3 or 4 (%)
Housing units in structures - 5 to 9 (%)
Housing units in structures - 10 to 19 (%)
Housing units in structures - 20 to 49 (%)
Housing units in structures - 50 or more (%)
Housing units in structures - Mobile home (%)
Housing units in structures - Boat, RV, van, etc. (%)
Housing units in structures - Owners - 1, detached (%)
Housing units in structures - Owners - 1, attached (%)
Housing units in structures - Owners - 2 (%)
Housing units in structures - Owners - 3 or 4 (%)
Housing units in structures - Owners - 5 to 9 (%)
Housing units in structures - Owners - 10 to 19 (%)
Housing units in structures - Owners - 20 to 49 (%)
Housing units in structures - Owners - 50 or more (%)
Housing units in structures - Owners - Mobile home (%)
Housing units in structures - Owners - Boat, RV, van, etc. (%)
Housing units in structures - Renters - 1, detached (%)
Housing units in structures - Renters - 1, attached (%)
Housing units in structures - Renters - 2 (%)
Housing units in structures - Renters - 3 or 4 (%)
Housing units in structures - Renters - 5 to 9 (%)
Housing units in structures - Renters - 10 to 19 (%)
Housing units in structures - Renters - 20 to 49 (%)
Housing units in structures - Renters - 50 or more (%)
Housing units in structures - Renters - Mobile home (%)
Housing units in structures - Renters - Boat, RV, van, etc. (%)
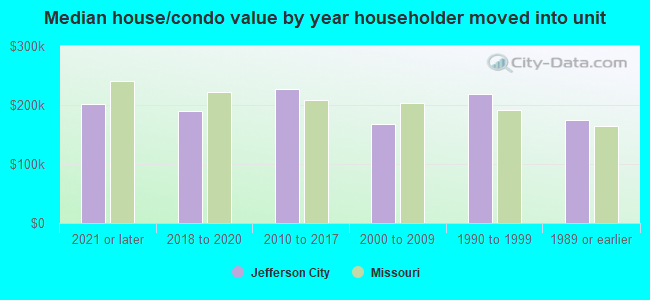
House/condo owner moved in on average (years ago)
Renter moved in on average (years ago)
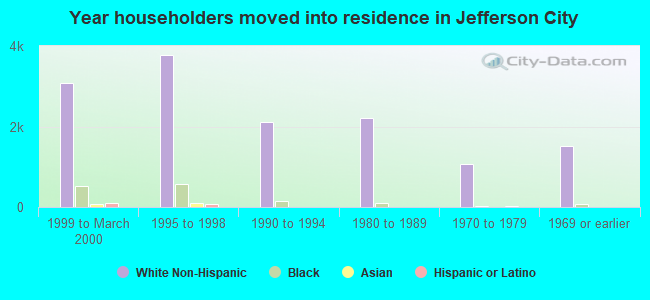
Year householder moved into unit - Moved in 1999 to March 2000 (%)
Year householder moved into unit - Moved in 1999 to March 2000 (%) - White
Year householder moved into unit - Moved in 1999 to March 2000 (%) - Black or African American
Year householder moved into unit - Moved in 1999 to March 2000 (%) - Asian
Year householder moved into unit - Moved in 1999 to March 2000 (%) - Hispanic or Latino
Year householder moved into unit - Moved in 1999 to March 2000 (%) - American Indian and Alaska Native
Year householder moved into unit - Moved in 1999 to March 2000 (%) - Multirace
Year householder moved into unit - Moved in 1999 to March 2000 (%) - Other Race
Year householder moved into unit - Moved in 1995 to 1998 (%)
Year householder moved into unit - Moved in 1995 to 1998 (%) - White
Year householder moved into unit - Moved in 1995 to 1998 (%) - Black or African American
Year householder moved into unit - Moved in 1995 to 1998 (%) - Asian
Year householder moved into unit - Moved in 1995 to 1998 (%) - Hispanic or Latino
Year householder moved into unit - Moved in 1995 to 1998 (%) - American Indian and Alaska Native
Year householder moved into unit - Moved in 1995 to 1998 (%) - Multirace
Year householder moved into unit - Moved in 1995 to 1998 (%) - Other Race
Year householder moved into unit - Moved in 1990 to 1994 (%)
Year householder moved into unit - Moved in 1990 to 1994 (%) - White
Year householder moved into unit - Moved in 1990 to 1994 (%) - Black or African American
Year householder moved into unit - Moved in 1990 to 1994 (%) - Asian
Year householder moved into unit - Moved in 1990 to 1994 (%) - Hispanic or Latino
Year householder moved into unit - Moved in 1990 to 1994 (%) - American Indian and Alaska Native
Year householder moved into unit - Moved in 1990 to 1994 (%) - Multirace
Year householder moved into unit - Moved in 1990 to 1994 (%) - Other Race
Year householder moved into unit - Moved in 1980 to 1989 (%)
Year householder moved into unit - Moved in 1980 to 1989 (%) - White
Year householder moved into unit - Moved in 1980 to 1989 (%) - Black or African American
Year householder moved into unit - Moved in 1980 to 1989 (%) - Asian
Year householder moved into unit - Moved in 1980 to 1989 (%) - Hispanic or Latino
Year householder moved into unit - Moved in 1980 to 1989 (%) - American Indian and Alaska Native
Year householder moved into unit - Moved in 1980 to 1989 (%) - Multirace
Year householder moved into unit - Moved in 1980 to 1989 (%) - Other Race
Year householder moved into unit - Moved in 1970 to 1979 (%)
Year householder moved into unit - Moved in 1970 to 1979 (%) - White
Year householder moved into unit - Moved in 1970 to 1979 (%) - Black or African American
Year householder moved into unit - Moved in 1970 to 1979 (%) - Asian
Year householder moved into unit - Moved in 1970 to 1979 (%) - Hispanic or Latino
Year householder moved into unit - Moved in 1970 to 1979 (%) - American Indian and Alaska Native
Year householder moved into unit - Moved in 1970 to 1979 (%) - Multirace
Year householder moved into unit - Moved in 1970 to 1979 (%) - Other Race
Year householder moved into unit - Moved in 1969 or earlier (%)
Year householder moved into unit - Moved in 1969 or earlier (%) - White
Year householder moved into unit - Moved in 1969 or earlier (%) - Black or African American
Year householder moved into unit - Moved in 1969 or earlier (%) - Asian
Year householder moved into unit - Moved in 1969 or earlier (%) - Hispanic or Latino
Year householder moved into unit - Moved in 1969 or earlier (%) - American Indian and Alaska Native
Year householder moved into unit - Moved in 1969 or earlier (%) - Multirace
Year householder moved into unit - Moved in 1969 or earlier (%) - Other Race
Housing units lacking complete plumbing facilities (%)
Housing units lacking complete kitchen facilities (%)
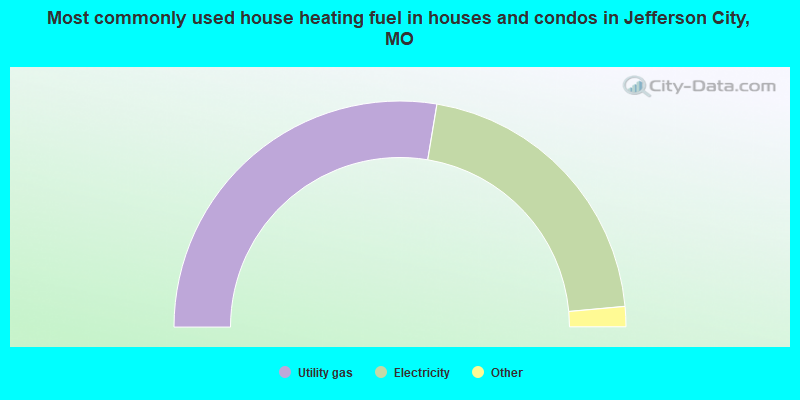
House heating fuel used in houses and condos - Utility gas (%)
House heating fuel used in houses and condos - Bottled, tank, or LP gas (%)
House heating fuel used in houses and condos - Electricity (%)
House heating fuel used in houses and condos - Fuel oil, kerosene, etc. (%)
House heating fuel used in houses and condos - Coal or coke (%)
House heating fuel used in houses and condos - Wood (%)
House heating fuel used in houses and condos - Solar energy (%)
House heating fuel used in houses and condos - Other fuel (%)
House heating fuel used in houses and condos - No fuel used (%)
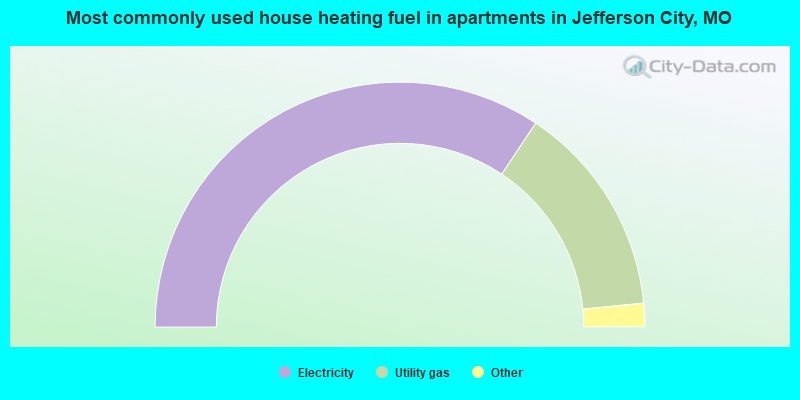
House heating fuel used in apartments - Utility gas (%)
House heating fuel used in apartments - Bottled, tank, or LP gas (%)
House heating fuel used in apartments - Electricity (%)
House heating fuel used in apartments - Fuel oil, kerosene, etc. (%)
House heating fuel used in apartments - Coal or coke (%)
House heating fuel used in apartments - Wood (%)
House heating fuel used in apartments - Solar energy (%)
House heating fuel used in apartments - Other fuel (%)
House heating fuel used in apartments - No fuel used (%)
Median year house/condo built: 1977Median year apartment built: 1977Household type by relationship:
Households: 42,687
Male householders: 7,946 (2,787 living alone ), Female householders: 8,923 (3,751 living alone )7,010 spouses (6,983 opposite-sex spouses ), 1,022 unmarried partners , (954 opposite-sex unmarried partners ), 10,578 children (9,950 natural , 304 adopted , 324 stepchildren ), 379 grandchildren , 251 brothers or sisters , 427 parents , 122 foster children , 532 other relatives , 920 non-relatives In group quarters: 4,573
Size of family households: 5,283 2-persons , 2,554 3-persons , 1,354 4-persons , 614 5-persons , 230 6-persons , 8 7-or-more-persons .
Size of nonfamily households: 6,122 1-person , 870 2-persons , 34 3-persons , 102 4-persons .
4,918 married couples with children. single-parent households (355 men , 2,932 women ).
93.9% of residents of Jefferson City speak English at home. of residents speak Spanish at home (69% speak English very well , 12% speak English well , 16% speak English not well , 3% don't speak English at all ).of residents speak other Indo-European language at home (49% speak English very well , 17% speak English well , 22% speak English not well , 12% don't speak English at all ).of residents speak Asian or Pacific Island language at home (58% speak English very well , 41% speak English well , 1% speak English not well ).of residents speak other language at home (83% speak English very well , 16% speak English well , 1% speak English not well ).
Foreign born population: 1,951 (4.6%)of them are naturalized citizens )
Median number of rooms in houses and condos:
Median number of rooms in apartments
Owner-occupied Renter-occupied
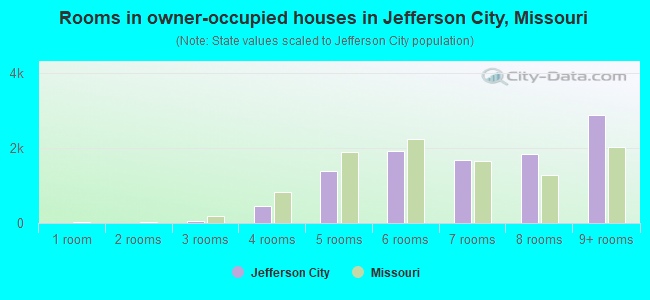
Rooms in owner-occupied houses in Jefferson City, Missouri
0 1 room 0 2 rooms 56 3 rooms 445 4 rooms 1,375 5 rooms 1,910 6 rooms 1,666 7 rooms 1,834 8 rooms 2,879 9+ rooms
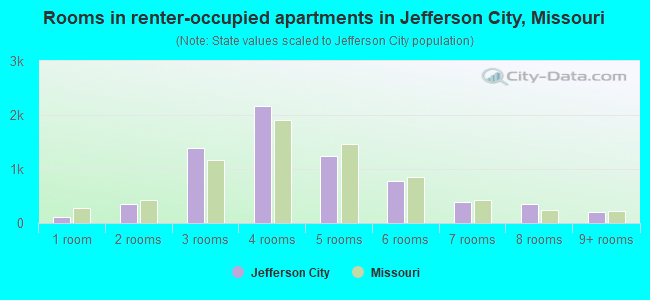
Rooms in renter-occupied apartments in Jefferson City, Missouri
119 1 room 359 2 rooms 1,396 3 rooms 2,175 4 rooms 1,232 5 rooms 773 6 rooms 388 7 rooms 348 8 rooms 205 9+ rooms
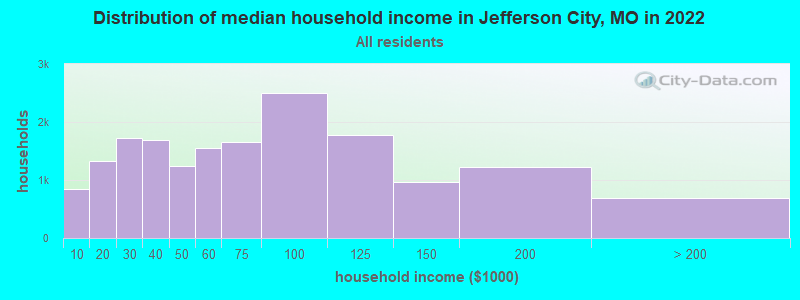
Jefferson City, MO household income distribution 839 Less than $10,0001,327 $10,000 to $19,9991,721 $20,000 to $29,9991,693 $30,000 to $39,9991,236 $40,000 to $49,9991,553 $50,000 to $59,9991,653 $60,000 to $74,9992,497 $75,000 to $99,9991,773 $100,000 to $124,999966 $125,000 to $149,9991,217 $150,000 to $199,999682 $200,000 or more
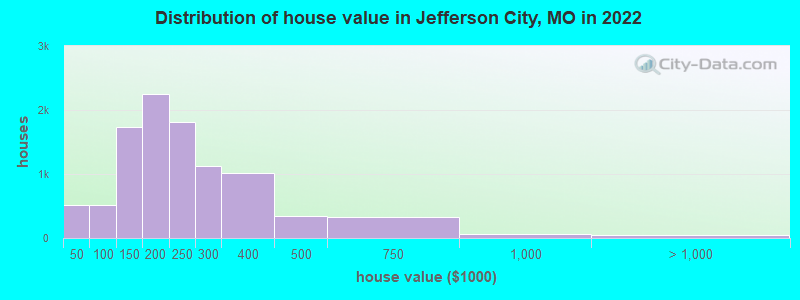
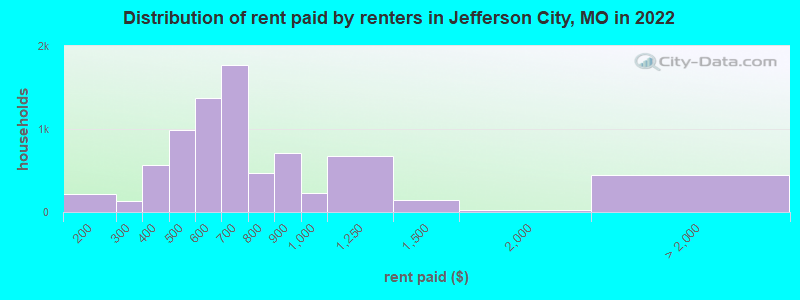
Home value of owner - occupied houses in 2022 in Jefferson City, MO 95 Less than $10,00014 $10,000 to $14,999132 $15,000 to $19,99945 $20,000 to $24,99955 $25,000 to $29,99928 $30,000 to $34,99958 $35,000 to $39,99982 $40,000 to $49,99922 $50,000 to $59,99914 $60,000 to $69,99934 $70,000 to $79,999187 $80,000 to $89,999174 $90,000 to $99,999599 $100,000 to $124,9991,137 $125,000 to $149,9991,032 $150,000 to $174,9991,220 $175,000 to $199,9991,814 $200,000 to $249,9991,129 $250,000 to $299,9991,012 $300,000 to $399,999337 $400,000 to $499,999323 $500,000 to $749,99961 $750,000 to $999,99949 $1,000,000 to $1,499,999Rent paid by renters in 2022 in Jefferson City, MO 5 $100 to $149207 $150 to $19921 $200 to $249115 $250 to $299365 $300 to $349199 $350 to $399670 $400 to $449322 $450 to $499950 $500 to $549424 $550 to $599779 $600 to $649988 $650 to $699333 $700 to $749141 $750 to $799714 $800 to $899229 $900 to $999672 $1,000 to $1,249146 $1,250 to $1,49922 $1,500 to $1,99926 $2,500 to $2,99952 $3,500 or more361 No cash rent
Percentage of workers working in this county: 85.4%Number of people working at home: 1,789 (8.6% of all workers )
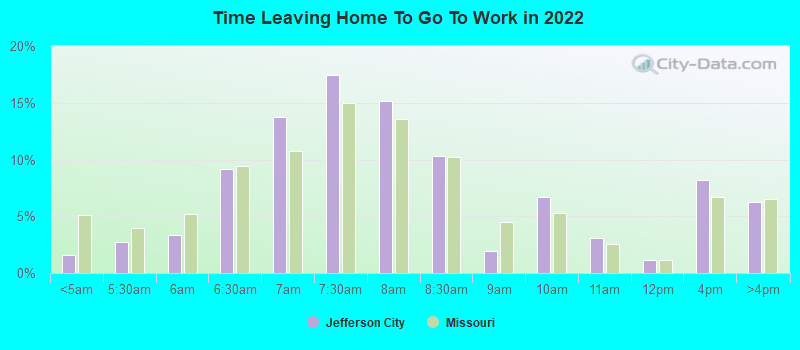
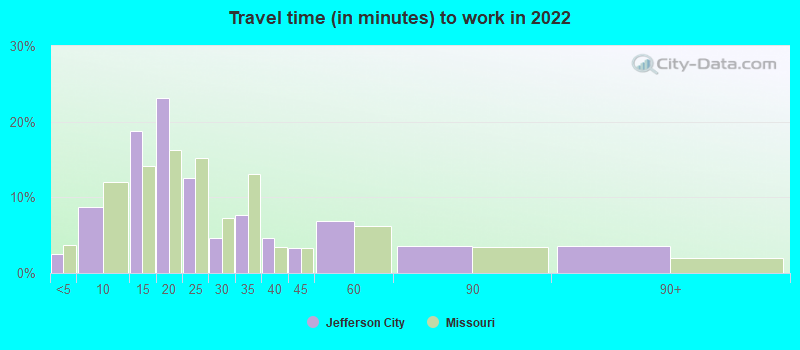
Travel time to work (commute)
Less than 5 minutes: 8025 to 9 minutes: 3,10710 to 14 minutes: 5,41615 to 19 minutes: 3,97120 to 24 minutes: 1,70925 to 29 minutes: 51730 to 34 minutes: 1,04935 to 39 minutes: 70740 to 44 minutes: 55845 to 59 minutes: 34360 to 89 minutes: 11590 or more minutes: 146
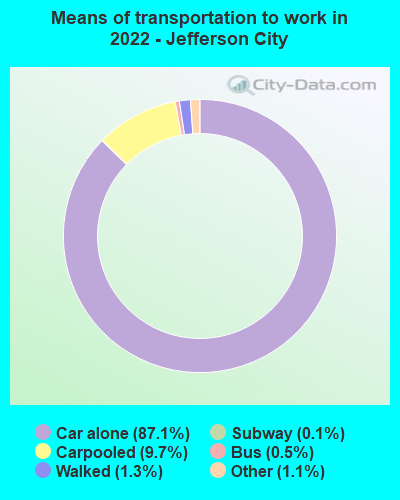
Means of transportation to work:
Drove a car alone: 39,031 (81.9%)Carpooled: 4,416 (9.3%)Bus : 180 (0.4%)Long-distance train or commuter rail : 52 (0.1%)Light rail, streetcar or trolley : 7 (0.0%)Ferryboat: 9 (0.0%)Taxi: 524 (1.1%)Bicycle: 24 (0.1%)Walked: 554 (1.2%)Worked at home: 1,789 (3.8%)
Unemployment by race in 2022
Unemployment rate for White non-Hispanic residents 2.4% Males1.3% FemalesUnemployment rate for Black residents 6.0% Males5.8% FemalesUnemployment rate for other race residents 2.4% FemalesUnemployment rate for two or more race residents 2.7% FemalesUnemployment rate for Hispanic or Latino residents 11.5% Females
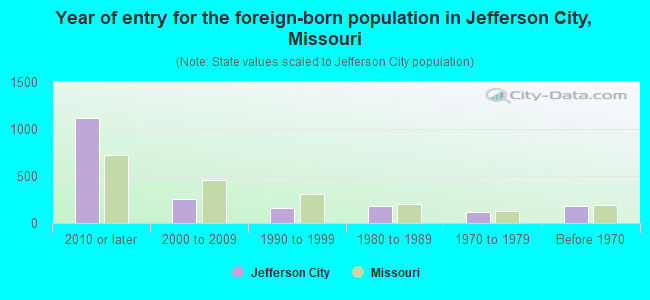
Year of entry for the foreign-born population in Jefferson City, Missouri
1,119 2010 or later 251 2000 to 2009 155 1990 to 1999 182 1980 to 1989 116 1970 to 1979 182 Before 1970
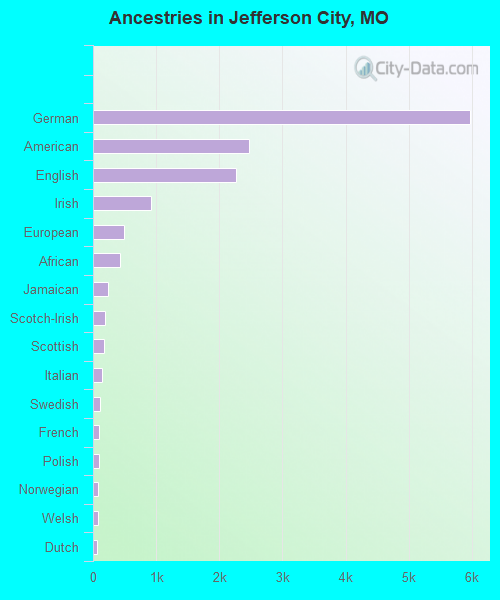
First ancestries reported:
German: 5,973 (26.8%)
American: 2,477 (11.1%)
English: 2,263 (10.2%)
Irish: 919 (4.1%)
European: 492 (2.2%)
African: 434 (1.9%)
Jamaican: 233 (1.0%)
Scotch-Irish: 187 (0.8%)
Scottish: 181 (0.8%)
Italian: 138 (0.6%)
Swedish: 116 (0.5%)
French: 102 (0.5%)
Polish: 101 (0.5%)
Norwegian: 83 (0.4%)
Welsh: 75 (0.3%)
Dutch: 62 (0.3%)
Ukrainian: 53 (0.2%)
Nigerian: 43 (0.2%)
Hungarian: 39 (0.2%)
Croatian: 35 (0.2%)
Iranian: 31 (0.1%)
Swiss: 29 (0.1%)
British West Indian: 23 (0.1%)
Slovak: 21 (0.09%)
Haitian: 21 (0.09%)
Austrian: 20 (0.09%)
Canadian: 16 (0.07%)
Russian: 16 (0.07%)
Palestinian: 14 (0.06%)
British: 14 (0.06%)
Czech: 12 (0.05%)
Scandinavian: 10 (0.04%)
Northern European: 9 (0.04%)
Eastern European: 6 (0.03%)
Moroccan: 6 (0.03%)
French Canadian: 4 (0.02%)
Danish: 2 (0.01%) Most common places of birth for foreign-born residents (%): India Jefferson City:
19.2% (336)Missouri:
8.9% (22,932)
Mexico Jefferson City:
14.5% (254)Missouri:
14.9% (38,568)
Jamaica Jefferson City:
11.5% (201)Missouri:
0.9% (2,341)
Kenya Jefferson City:
9.1% (159)Missouri:
1.7% (4,518)
Ghana Jefferson City:
7.0% (123)Missouri:
0.5% (1,245)
Taiwan Jefferson City:
5.8% (102)Missouri:
0.7% (1,927)
Germany Jefferson City:
4.9% (86)Missouri:
3.0% (7,803)
Malaysia Jefferson City:
3.7% (64)Missouri:
0.2% (582)
Other Middle Africa Jefferson City:
3.3% (58)Missouri:
0.0% (74)
Nicaragua Jefferson City:
3.3% (58)Missouri:
0.2% (637)
Japan Jefferson City:
3.3% (57)Missouri:
0.7% (1,818)
Nepal Jefferson City:
2.9% (50)Missouri:
0.5% (1,214)
Korea Jefferson City:
2.6% (46)Missouri:
2.9% (7,525)
Vietnam Jefferson City:
2.5% (43)Missouri:
4.1% (10,700)
Nigeria Jefferson City:
2.1% (36)Missouri:
1.4% (3,640)
Bahamas Jefferson City:
1.5% (27)Missouri:
0.1% (260)
Place of birth for U.S.-born residents:
This state: 29,304Other state: 11,323Northeast: 747Midwest: 5,495South: 3,203West: 1,846 84.7% of Jefferson City residents lived in the same house 1 years ago.
Out of people who lived in different houses, 28.1% lived in this county.
Out of people who lived in different counties, 65.4% lived in Missouri.
Jefferson City:
84.7%State average:
87.1%
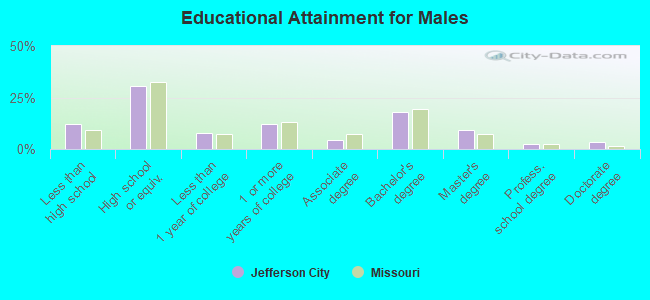
Education attainment for males 25 years and older:
No schooling: 104Nursery to 4th grade: 405th and 6th grade: 547th and 8th grade: 1679th grade: 17710th grade: 74711th grade: 43412th grade, no diploma: 243High school graduate (or equivalency): 4,890Less than 1 year of college: 1,248Some college more than 1 year, no degree: 1,925Associate degree: 713Bachelor's degree: 2,904Master's degree: 1,486Professional school degree: 411Doctorate degree: 508
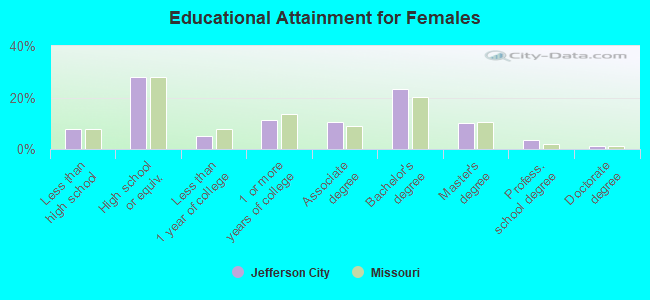
Education attainment for females 25 years and older:
No schooling: 306Nursery to 4th grade: 05th and 6th grade: 747th and 8th grade: 1399th grade: 5210th grade: 25611th grade: 12612th grade, no diploma: 191High school graduate (or equivalency): 4,170Less than 1 year of college: 760Some college more than 1 year, no degree: 1,668Associate degree: 1,583Bachelor's degree: 3,470Master's degree: 1,544Professional school degree: 508Doctorate degree: 155
Housing units in structures:
One, detached: 11,811One, attached: 520Two: 1,4203 or 4: 1,8755 to 9: 1,06010 to 19: 1,01720 to 49: 44650 or more: 801Mobile homes: 242Median worth of mobile homes: $23,868
Housing units lacking complete plumbing facilities in 2022: 1.2%Housing units lacking complete kitchen facilities in 2022: 1.7%House/condo owner moved in on average 12 years ago
Renter moved in on average 3 years ago
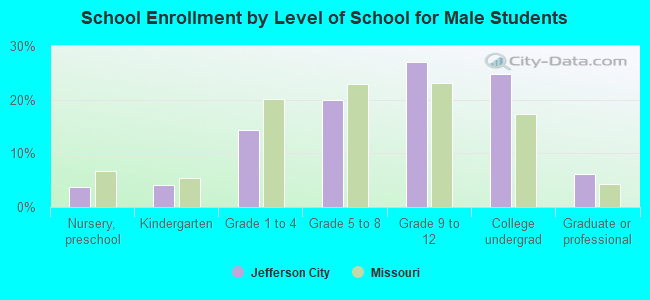
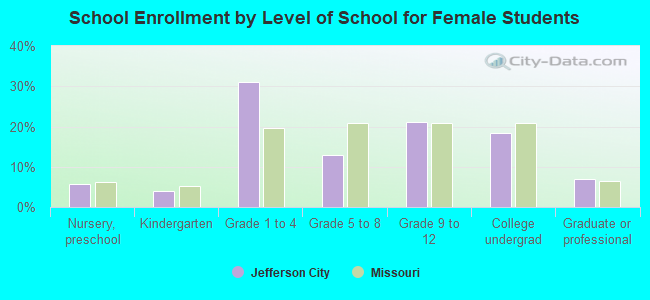
Private vs. public school enrollment:
Students in private schools in grades 1 to 8 (elementary and middle school): 1,049 Students in private schools in grades 9 to 12 (high school): 577 Students in private undergraduate colleges: 700