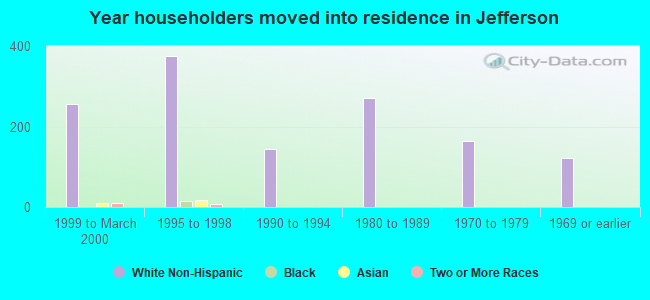
Jefferson, OH (Ohio) Houses and Residents
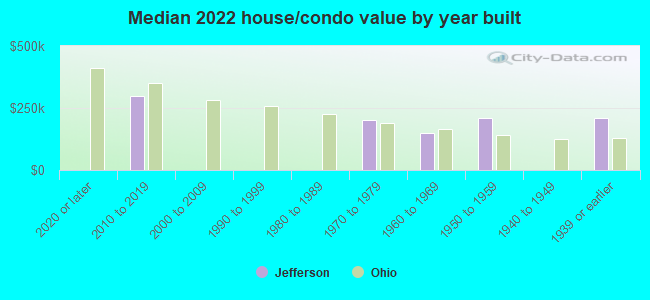
| Jefferson: | $185,621 |
| Ohio: | $204,100 |
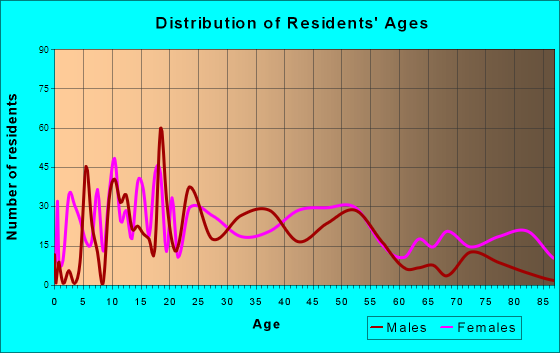
Total population: 3,053 (All urban)
Houses: 1,774 (1,565 occupied: 1,097 owner occupied, 475 renter occupied)
| % of renters here: | 30% |
| State: | 33% |
Housing density: 778 houses/condos per square mile
Median price asked for vacant for-sale houses and condos in 2022 in this county: $73,356.
Median contract rent in 2022: $662 (lower quartile is $557, upper quartile is $764)
Median rent asked for vacant for-rent units in 2022: $1,418
Median gross rent in Jefferson, OH in 2022: $848
Housing units in Jefferson with a mortgage: 569 (151 second mortgage, 0 home equity loan, 162 both second mortgage and home equity loan)
Houses without a mortgage: 31
Median household income for houses/condos with a mortgage: $77,338
Median household income for apartments without a mortgage: $28,736
Median monthly housing costs: $829
Compare current foreclosures near Jefferson, OH:
| Photo | Address | Area | Beds / Baths | Price | Details |
|---|---|---|---|---|---|

|
#1
W Erie St
Jefferson, OH 44047
|
1,056 sq. feet
|
1 baths 2 beds |
$119,900
|
show details |

|
#2
Maple Rd
Jefferson, OH 44047
|
1,528 sq. feet
|
2 baths 4 beds |
$329,900
|
show details |

|
#3
Franley Dr
Jefferson, OH 44047
|
2,072 sq. feet
|
1 baths 3 beds |
show details | |

|
#4
Doyle Rd
Jefferson, OH 44047
|
1,170 sq. feet
|
1 baths 3 beds |
show details | |

|
#5
Stanhope Kelloggsville Rd
Jefferson, OH 44047
|
960 sq. feet
|
1 baths 3 beds |
show details | |

|
#6
Us Highway 6
Jefferson, OH 44047
|
1,176 sq. feet
|
1 baths 3 beds |
show details | |

|
#7
W Walnut St
Jefferson, OH 44047
|
1,957 sq. feet
|
1 baths 4 beds |
show details | |

|
#8
W Satin St # 8
Jefferson, OH 44047
|
- sq. feet
|
- baths - beds |
show details | |

|
#9
N Chestnut St
Jefferson, OH 44047
|
- sq. feet
|
- baths - beds |
show details | |

|
#10
N Market St
Jefferson, OH 44047
|
- sq. feet
|
- baths - beds |
show details |
| Photo | Address | Area | Beds / Baths | Price | Details |
|---|---|---|---|---|---|

|
#11
N Market St
Jefferson, OH 44047
|
- sq. feet
|
- baths - beds |
show details | |

|
#12
State Route 46 S
Jefferson, OH 44047
|
- sq. feet
|
- baths - beds |
show details | |

|
#13
State Route 307 E # 1
Jefferson, OH 44047
|
- sq. feet
|
- baths - beds |
show details | |

|
#14
E Union Rd
Jefferson, OH 44047
|
- sq. feet
|
- baths - beds |
show details | |

|
#15
Samuel Ave
Ashtabula, OH 44004
|
1,511 sq. feet
|
1 baths 3 beds |
show details | |

|
#16
N Ridge Rd W
Geneva, OH 44041
|
582 sq. feet
|
1 baths 2 beds |
show details | |

|
#17
Murphy Rd
Thompson, OH 44086
|
1,944 sq. feet
|
2 baths 3 beds |
show details | |

|
#18
Hyde Rd
Rome, OH 44085
|
1,562 sq. feet
|
1 baths 2 beds |
show details | |

|
#19
N Ridge Rd
Madison, OH 44057
|
1,266 sq. feet
|
1 baths 3 beds |
show details | |

|
#20
W 6th St
Ashtabula, OH 44004
|
1,660 sq. feet
|
1 baths 2 beds |
show details |
| Photo | Address | Area | Beds / Baths | Price | Details |
|---|---|---|---|---|---|

|
#21
N Ridge Rd W
Geneva, OH 44041
|
1,426 sq. feet
|
1 baths 3 beds |
show details | |

|
#22
Fillingham Rd
Rome, OH 44085
|
2,096 sq. feet
|
2 baths 4 beds |
show details | |

|
#23
S Wright St
Kingsville, OH 44048
|
1,065 sq. feet
|
1 baths 4 beds |
show details | |

|
#24
Donna Dr
Ashtabula, OH 44004
|
1,832 sq. feet
|
1 baths 3 beds |
show details | |

|
#25
Lyndon Ave
Ashtabula, OH 44004
|
1,018 sq. feet
|
1 baths 2 beds |
show details | |

|
#26
Atlantic Ave
Ashtabula, OH 44004
|
1,818 sq. feet
|
2 baths 2 beds |
show details | |

|
#27
W 9th St
Ashtabula, OH 44004
|
1,056 sq. feet
|
1 baths 2 beds |
show details | |

|
#28
State Route 193
Andover, OH 44003
|
960 sq. feet
|
1 baths 3 beds |
show details | |

|
#29
Westshore Dr
Ashtabula, OH 44004
|
960 sq. feet
|
1 baths 3 beds |
show details | |

|
#30
Columbus Ave
Ashtabula, OH 44004
|
1,780 sq. feet
|
2 baths 6 beds |
show details |
| Photo | Address | Area | Beds / Baths | Price | Details |
|---|---|---|---|---|---|

|
#31
Safford St
Madison, OH 44057
|
975 sq. feet
|
1 baths 3 beds |
show details | |

|
#32
Elm St
Geneva, OH 44041
|
1,212 sq. feet
|
1 baths 3 beds |
show details | |

|
#33
Leon Rd
Andover, OH 44003
|
1,140 sq. feet
|
1 baths 3 beds |
show details | |

|
#34
Pine St
Geneva, OH 44041
|
1,654 sq. feet
|
1 baths 4 beds |
show details | |

|
#35
S Madison Rd
Madison, OH 44057
|
1,429 sq. feet
|
1 baths 3 beds |
show details | |

|
#36
Leffingwell Dr
Orwell, OH 44076
|
1,024 sq. feet
|
1 baths 3 beds |
show details | |

|
#37
Tamkrist Trl
Conneaut, OH 44030
|
2,473 sq. feet
|
2 baths 4 beds |
show details | |

|
#38
Avalon Dr
Madison, OH 44057
|
1,224 sq. feet
|
1 baths 3 beds |
show details | |

|
#39
Perth Rd
Madison, OH 44057
|
720 sq. feet
|
1 baths 2 beds |
show details | |

|
#40
Cambrian Way
Madison, OH 44057
|
1,998 sq. feet
|
2 baths 4 beds |
show details |
| Photo | Address | Area | Beds / Baths | Price | Details |
|---|---|---|---|---|---|

|
#41
State Route 86
Windsor, OH 44099
|
2,012 sq. feet
|
2 baths 3 beds |
show details | |

|
#42
Dundee St
Madison, OH 44057
|
1,070 sq. feet
|
1 baths 3 beds |
show details | |

|
#43
Red Bird Rd
Madison, OH 44057
|
900 sq. feet
|
1 baths 3 beds |
show details | |

|
#44
Paisley Rd
Madison, OH 44057
|
1,354 sq. feet
|
1 baths 3 beds |
show details | |

|
#45
Falkirk Rd
Madison, OH 44057
|
1,605 sq. feet
|
1 baths 3 beds |
show details | |

|
#46
Chimney Ridge Dr
Madison, OH 44057
|
2,184 sq. feet
|
2 baths 3 beds |
show details | |

|
#47
Middle Ridge Rd
Madison, OH 44057
|
2,224 sq. feet
|
1 baths 4 beds |
show details | |

|
#48
W Main St
Madison, OH 44057
|
1,966 sq. feet
|
2 baths 3 beds |
show details | |

|
#49
Oldsmar Ave
Madison, OH 44057
|
1,768 sq. feet
|
2 baths 4 beds |
show details | |

|
Check over 1 million property listings on Foreclosure.com!
|
browse all offers | |||

Latest news about housing in Jefferson, OH collected exclusively by city-data.com from local newspapers, TV, and radio stations


Median year apartment built: 1981
Household type by relationship:
Households: 3,296- Male householders: 660 (228 living alone), Female householders: 888 (702 living alone)
422 spouses (422 opposite-sex spouses), 50 unmarried partners, (25 opposite-sex unmarried partners), 581 children (489 natural, 0 adopted, 91 stepchildren), 202 grandchildren, 0 brothers or sisters, 71 parents, 29 foster children, 35 other relatives, 178 non-relatives
- In group quarters: 175
Size of family households: 298 2-persons, 23 3-persons, 129 4-persons, 42 6-persons, 34 7-or-more-persons.
Size of nonfamily households: 938 1-person, 59 2-persons.
378 married couples with children.
75 single-parent households (27 men, 48 women).
95.3% of residents of Jefferson speak English at home.
0.4% of residents speak Spanish at home (100% speak English very well).
1.5% of residents speak other Indo-European language at home (100% speak English very well).
0.9% of residents speak Asian or Pacific Island language at home (100% speak English very well).
2.0% of residents speak other language at home (97% speak English very well, 3% speak English not well).
Foreign born population: 29 (0.9%)
(79.3% of them are naturalized citizens)
| Here: | 6.6 |
| State: | 6.7 |
| Here: | 4.2 |
| State: | 4.4 |
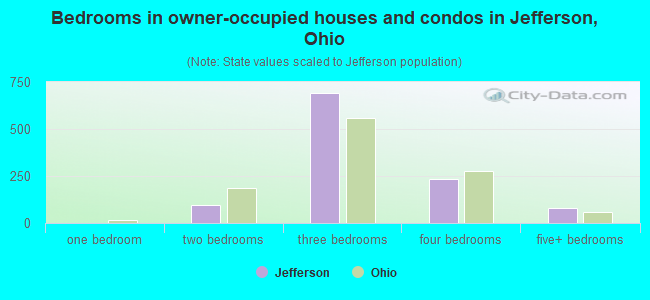
- Bedrooms in owner-occupied houses and condos in Jefferson, Ohio
- 0no bedroom
- 01 bedroom
- 952 bedrooms
- 6913 bedrooms
- 2344 bedrooms
- 785+ bedrooms
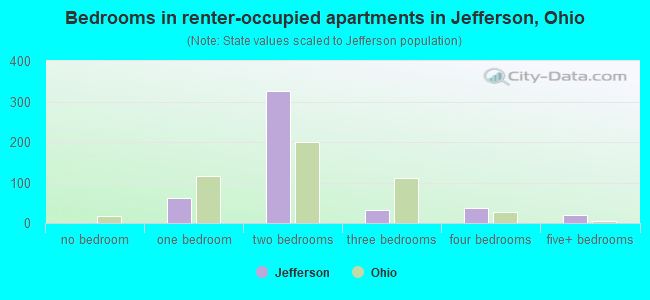
- Bedrooms in renter-occupied apartments in Jefferson, Ohio
- 0no bedroom
- 611 bedroom
- 3262 bedrooms
- 323 bedrooms
- 364 bedrooms
- 205+ bedrooms
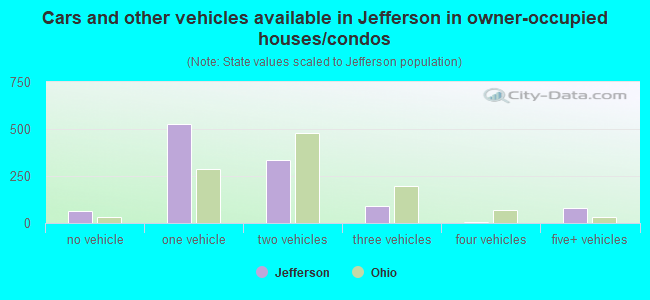
- Cars and other vehicles available in Jefferson in owner-occupied houses/condos
- 64no vehicle
- 5291 vehicle
- 3342 vehicles
- 893 vehicles
- 34 vehicles
- 805+ vehicles
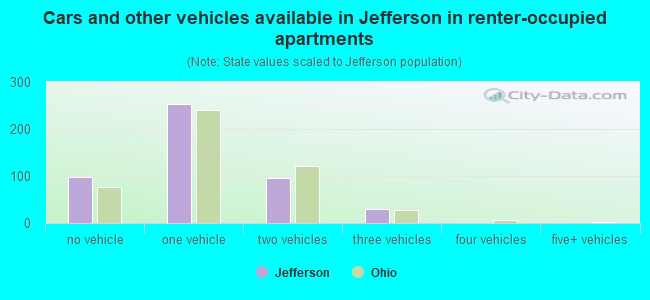
- Cars and other vehicles available in Jefferson in renter-occupied apartments
- 98no vehicle
- 2531 vehicle
- 952 vehicles
- 293 vehicles
- 04 vehicles
- 05+ vehicles
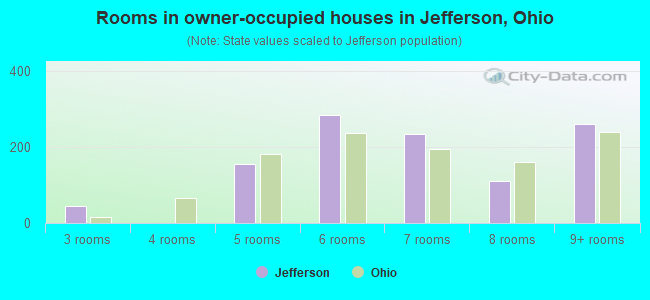
- Rooms in owner-occupied houses in Jefferson, Ohio
- 01 room
- 02 rooms
- 463 rooms
- 04 rooms
- 1575 rooms
- 2866 rooms
- 2367 rooms
- 1128 rooms
- 2609+ rooms
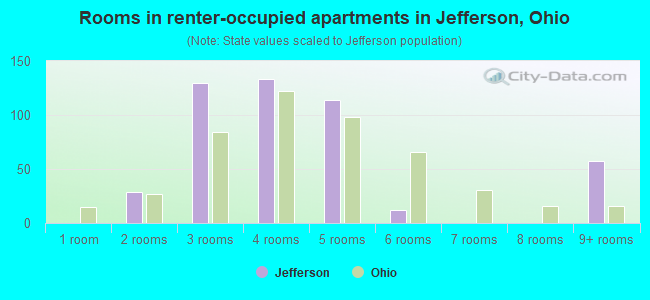
- Rooms in renter-occupied apartments in Jefferson, Ohio
- 01 room
- 292 rooms
- 1303 rooms
- 1334 rooms
- 1145 rooms
- 126 rooms
- 07 rooms
- 08 rooms
- 579+ rooms
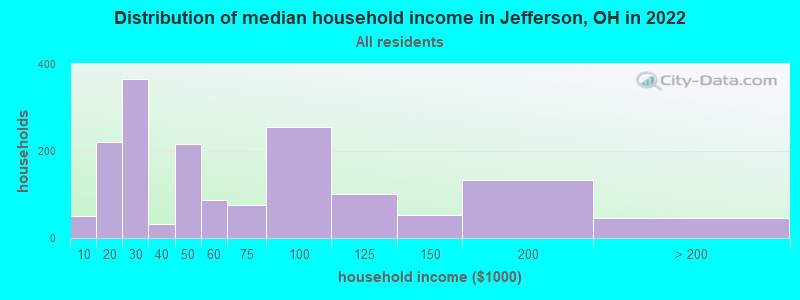
Jefferson, OH household income distribution

- 50Less than $10,000
- 220$10,000 to $19,999
- 366$20,000 to $29,999
- 33$30,000 to $39,999
- 216$40,000 to $49,999
- 87$50,000 to $59,999
- 77$60,000 to $74,999
- 256$75,000 to $99,999
- 101$100,000 to $124,999
- 52$125,000 to $149,999
- 133$150,000 to $199,999
- 47$200,000 or more
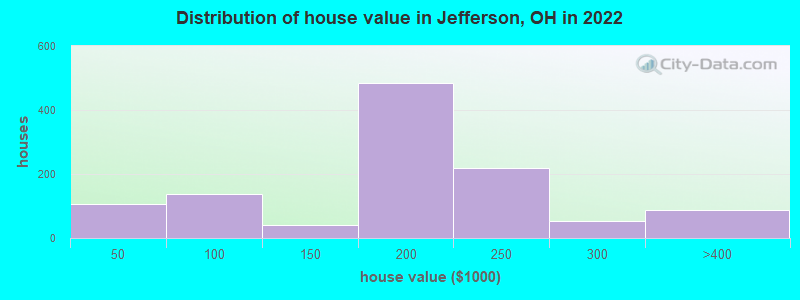
Home value of owner - occupied houses in 2022 in Jefferson, OH
-
- 48$10,000 to $14,999
- 56$15,000 to $19,999
- 28$60,000 to $69,999
- 21$70,000 to $79,999
- 20$80,000 to $89,999
- 66$90,000 to $99,999
- 37$100,000 to $124,999
- 4$125,000 to $149,999
- 284$150,000 to $174,999
- 200$175,000 to $199,999
- 218$200,000 to $249,999
- 54$250,000 to $299,999
- 87$300,000 to $399,999
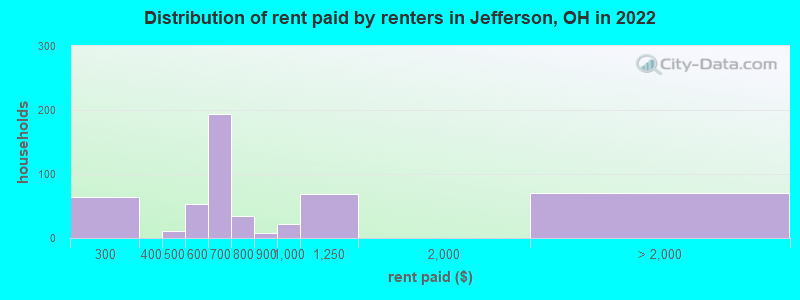
Rent paid by renters in 2022 in Jefferson, OH
-
- 63$200 to $249
- 10$400 to $449
- 33$500 to $549
- 19$550 to $599
- 64$600 to $649
- 129$650 to $699
- 34$750 to $799
- 8$800 to $899
- 21$900 to $999
- 68$1,000 to $1,249
- 71No cash rent
Percentage of workers working in this county: 80.6%
Number of people working at home: 56 (3.2% of all workers)
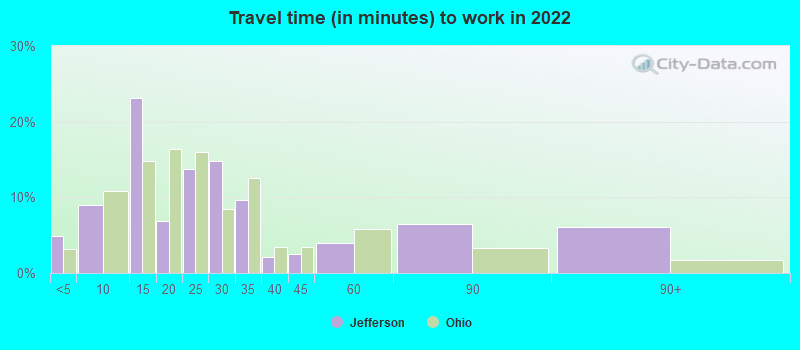
Travel time to work (commute)
- Less than 5 minutes: 87
- 5 to 9 minutes: 77
- 10 to 14 minutes: 296
- 15 to 19 minutes: 131
- 20 to 24 minutes: 459
- 25 to 29 minutes: 57
- 30 to 34 minutes: 140
- 35 to 39 minutes: 32
- 40 to 44 minutes: 54
- 45 to 59 minutes: 66
- 60 to 89 minutes: 215
- 90 or more minutes: 0
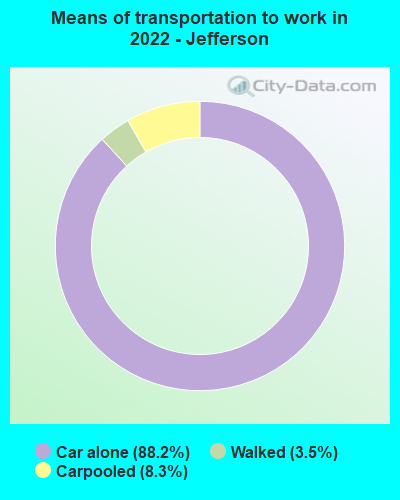
Means of transportation to work:
- Drove a car alone: 1,700 (82.5%)
- Carpooled: 172 (8.3%)
- Walked: 67 (3.3%)
- Worked at home: 63 (3.1%)
- Unemployment by race in 2022
- Unemployment rate for White non-Hispanic residents
- 4.3%Males
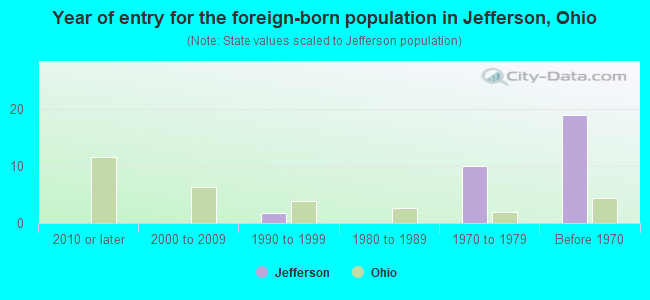
- Year of entry for the foreign-born population in Jefferson, Ohio
- 02010 or later
- 02000 to 2009
- 21990 to 1999
- 01980 to 1989
- 101970 to 1979
- 19Before 1970
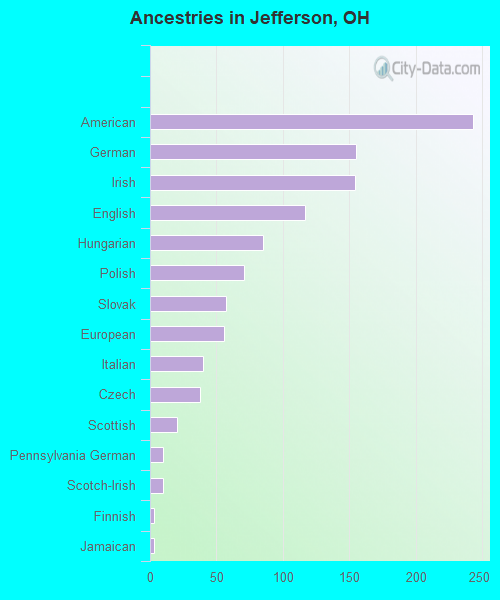
First ancestries reported:
- American: 243 (19.9%)
- German: 155 (12.7%)
- Irish: 154 (12.6%)
- English: 117 (9.6%)
- Hungarian: 85 (7.0%)
- Polish: 71 (5.8%)
- Slovak: 57 (4.7%)
- European: 56 (4.6%)
- Italian: 40 (3.3%)
- Czech: 38 (3.1%)
- Scottish: 20 (1.6%)
- Pennsylvania German: 10 (0.8%)
- Scotch-Irish: 10 (0.8%)
- Finnish: 3 (0.2%)
- Jamaican: 3 (0.2%)
Most common places of birth for foreign-born residents (%):
| Jefferson: | 52.1% (25) |
| Ohio: | 0.3% (1,754) |
| Jefferson: | 6.2% (3) |
| Ohio: | 0.7% (4,187) |
| Jefferson: | 4.2% (2) |
| Ohio: | 2.6% (14,988) |
Place of birth for U.S.-born residents:
- This state: 2,904
- Other state: 312
- Northeast: 100
- Midwest: 78
- South: 108
- West: 18
83.3% of Jefferson residents lived in the same house 1 years ago.
Out of people who lived in different houses, 38.8% lived in this county.
Out of people who lived in different counties, 80.0% lived in Ohio.
| Jefferson: | 83.3% |
| State average: | 87.8% |
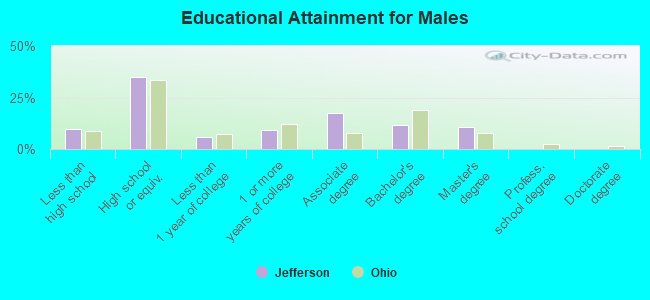
Education attainment for males 25 years and older:
- No schooling: 0
- Nursery to 4th grade: 0
- 5th and 6th grade: 0
- 7th and 8th grade: 12
- 9th grade: 0
- 10th grade: 13
- 11th grade: 53
- 12th grade, no diploma: 15
- High school graduate (or equivalency): 341
- Less than 1 year of college: 59
- Some college more than 1 year, no degree: 91
- Associate degree: 172
- Bachelor's degree: 115
- Master's degree: 106
- Professional school degree: 0
- Doctorate degree: 0
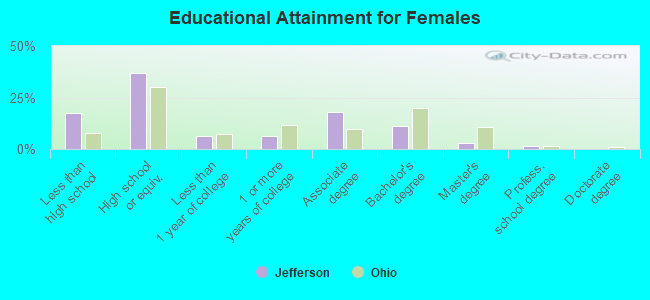
Education attainment for females 25 years and older:
- No schooling: 62
- Nursery to 4th grade: 0
- 5th and 6th grade: 0
- 7th and 8th grade: 7
- 9th grade: 45
- 10th grade: 72
- 11th grade: 6
- 12th grade, no diploma: 36
- High school graduate (or equivalency): 481
- Less than 1 year of college: 81
- Some college more than 1 year, no degree: 85
- Associate degree: 238
- Bachelor's degree: 145
- Master's degree: 36
- Professional school degree: 18
- Doctorate degree: 0
Housing units in structures:
- One, detached: 1,285
- One, attached: 11
- Two: 2
- 3 or 4: 128
- 5 to 9: 188
- 10 to 19: 46
- 20 to 49: 29
- Mobile homes: 83
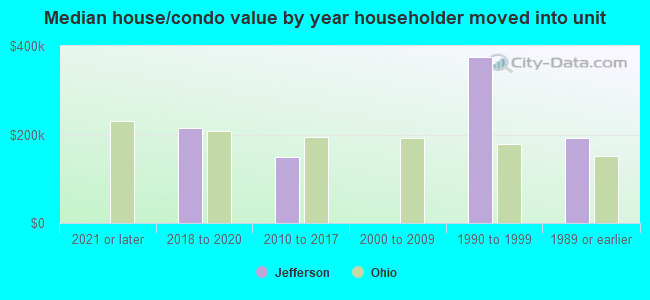
House/condo owner moved in on average 7 years ago
Renter moved in on average 1 years ago
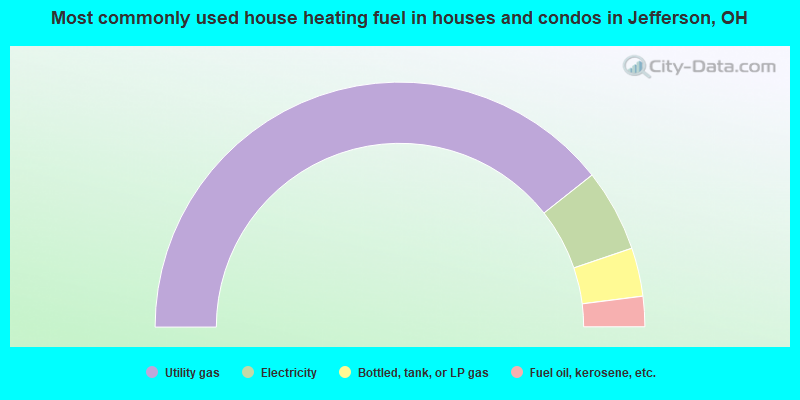
- 78.7%Utility gas
- 10.9%Electricity
- 6.4%Bottled, tank, or LP gas
- 4.0%Fuel oil, kerosene, etc.
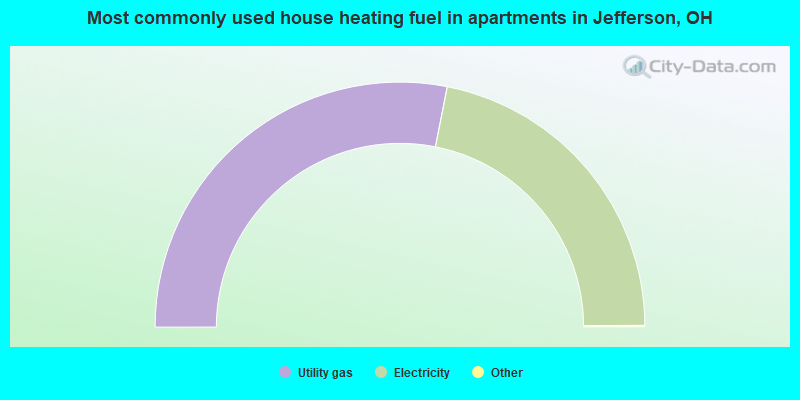
- 56.3%Utility gas
- 43.7%Electricity
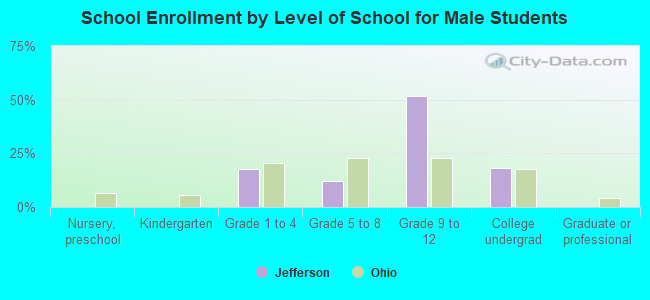
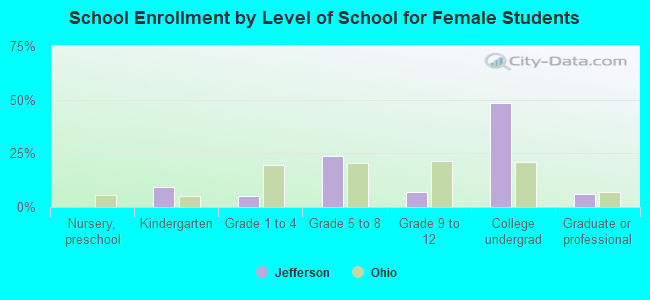
Private vs. public school enrollment:
| Here: | 36.1% |
| Ohio: | 16.0% |
| Here: | 13.1% |
| Ohio: | 13.1% |
| Here: | 49.8% |
| Ohio: | 22.3% |