Keeneland, KY (Kentucky) Houses and Residents
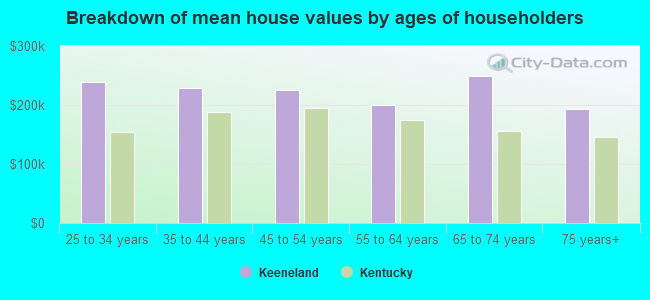
| Keeneland: | $233,020 |
| Kentucky: | $196,300 |
Total population: 392 (Urban population: 365, Rural population: 0)
Houses: 157 (154 occupied: 129 owner occupied, 25 renter occupied)
| % of renters here: | 16% |
| State: | 31% |
Housing density: 2,048 houses/condos per square mile
Median price asked for vacant for-sale houses and condos in 2022 in this county: $108,908.
Median contract rent in 2022: $1,300 (lower quartile is $1,095, upper quartile is $1,541)
Median gross rent in Keeneland, KY in 2022: $1,726
Housing units in Keeneland with a mortgage: 88 (13 second mortgage, 14 home equity loan, 0 both second mortgage and home equity loan)
Houses without a mortgage: 37
Compare current foreclosures near Keeneland, KY:
| Photo | Address | Area | Beds / Baths | Price | Details |
|---|---|---|---|---|---|

|
#1
Gullane Ct
Louisville, KY 40222
|
1,945 sq. feet
|
3 baths 3 beds |
$291,650
|
show details |

|
#2
Hazel St
Louisville, KY 40211
|
1,100 sq. feet
|
1 baths 3 beds |
$140,000
|
show details |

|
#3
Doe Run Way
New Albany, IN 47150
|
1,380 sq. feet
|
2 baths 3 beds |
$295,000
|
show details |

|
#4
Melody Way
Louisville, KY 40299
|
1,242 sq. feet
|
1 baths 3 beds |
$300,000
|
show details |

|
#5
Beechwood Ave
New Albany, IN 47150
|
1,887 sq. feet
|
2 baths 4 beds |
show details | |

|
#6
Shrader Ave
New Albany, IN 47150
|
792 sq. feet
|
1 baths 1 beds |
show details | |

|
#7
Saint Rene Rd
Louisville, KY 40299
|
1,174 sq. feet
|
2 baths 3 beds |
show details | |

|
#8
E Park Pl
Jeffersonville, IN 47130
|
1,236 sq. feet
|
1 baths 3 beds |
show details | |

|
#9
Briarwood Dr
Clarksville, IN 47129
|
1,161 sq. feet
|
1 baths 2 beds |
show details | |

|
#10
Vine St
New Albany, IN 47150
|
1,040 sq. feet
|
1 baths 2 beds |
show details |
| Photo | Address | Area | Beds / Baths | Price | Details |
|---|---|---|---|---|---|

|
#11
Sundance Dr
New Albany, IN 47150
|
1,428 sq. feet
|
3 baths 4 beds |
show details | |

|
#12
Linnet Rd
Louisville, KY 40213
|
3,774 sq. feet
|
2 baths 2 beds |
show details | |

|
#13
Marshall Dr
Charlestown, IN 47111
|
1,650 sq. feet
|
1 baths 4 beds |
show details | |

|
#14
E Southside Ct
Louisville, KY 40214
|
1,406 sq. feet
|
1 baths 3 beds |
show details | |

|
#15
Poplar Hill Ct
Louisville, KY 40207
|
5,287 sq. feet
|
4 baths 5 beds |
show details | |

|
#16
Carr Cir
Jeffersonville, IN 47130
|
- sq. feet
|
2 baths 4 beds |
show details | |

|
#17
Morris Ave
Jeffersonville, IN 47130
|
1,320 sq. feet
|
1 baths 3 beds |
show details | |

|
#18
Bernheim Ln
Louisville, KY 40210
|
816 sq. feet
|
1 baths 2 beds |
show details | |

|
#19
Dorset Rd
Louisville, KY 40214
|
1,103 sq. feet
|
2 baths 3 beds |
show details | |

|
#20
Sunset Ln
Crestwood, KY 40014
|
2,574 sq. feet
|
3 baths 4 beds |
show details |
| Photo | Address | Area | Beds / Baths | Price | Details |
|---|---|---|---|---|---|

|
#21
Imperial Ter
Louisville, KY 40216
|
1,028 sq. feet
|
1 baths 3 beds |
show details | |

|
#22
E Woodlake Cir
Mount Washington, KY 40047
|
1,728 sq. feet
|
2 baths 3 beds |
show details | |

|
#23
Corydon Pike
New Albany, IN 47150
|
1,024 sq. feet
|
1 baths 2 beds |
show details | |

|
#24
Culbertson Ave
New Albany, IN 47150
|
1,052 sq. feet
|
2 baths 3 beds |
show details | |

|
#25
Carlisle Ave
Louisville, KY 40215
|
1,663 sq. feet
|
1 baths 1 beds |
show details | |

|
#26
Prestwood Dr
Louisville, KY 40219
|
1,900 sq. feet
|
1 baths 3 beds |
show details | |

|
#27
Meadowlark Ct
Prospect, KY 40059
|
2,432 sq. feet
|
2 baths 3 beds |
show details | |

|
#28
Bolling Ave
Louisville, KY 40210
|
1,676 sq. feet
|
1 baths 2 beds |
show details | |

|
#29
S 5th St
Louisville, KY 40214
|
1,008 sq. feet
|
1 baths 3 beds |
show details | |

|
#30
Leo Ln
Louisville, KY 40299
|
1,785 sq. feet
|
2 baths 1 beds |
show details |
| Photo | Address | Area | Beds / Baths | Price | Details |
|---|---|---|---|---|---|

|
#31
Woodpointe Blvd
Louisville, KY 40219
|
1,406 sq. feet
|
2 baths 3 beds |
show details | |

|
#32
Garland Ave
Louisville, KY 40211
|
1,414 sq. feet
|
1 baths 3 beds |
show details | |

|
#33
Scenic Trl
Shepherdsville, KY 40165
|
1,548 sq. feet
|
2 baths 3 beds |
show details | |

|
#34
Spicewood Plz
Clarksville, IN 47129
|
1,245 sq. feet
|
1 baths 3 beds |
show details | |

|
#35
Emily Ave
Clarksville, IN 47129
|
925 sq. feet
|
1 baths 3 beds |
show details | |

|
#36
Higgins Dr
Jeffersonville, IN 47130
|
850 sq. feet
|
1 baths 3 beds |
show details | |

|
#37
Longfellow Dr
Clarksville, IN 47129
|
1,102 sq. feet
|
2 baths 4 beds |
show details | |

|
#38
Overlook Rd
Louisville, KY 40229
|
900 sq. feet
|
1 baths 3 beds |
show details | |

|
#39
Webster Blvd
Jeffersonville, IN 47130
|
1,983 sq. feet
|
1 baths 3 beds |
show details | |

|
#40
Catalpa Dr
Jeffersonville, IN 47130
|
1,215 sq. feet
|
1 baths 3 beds |
show details |
| Photo | Address | Area | Beds / Baths | Price | Details |
|---|---|---|---|---|---|

|
#41
Tammy Ct
New Albany, IN 47150
|
1,488 sq. feet
|
1 baths 3 beds |
show details | |

|
#42
Cliftwood Dr
Clarksville, IN 47129
|
1,161 sq. feet
|
1 baths 3 beds |
show details | |

|
#43
N Clark Blvd
Clarksville, IN 47129
|
700 sq. feet
|
1 baths 2 beds |
show details | |

|
#44
Dellinger Dr
Jeffersonville, IN 47130
|
1,858 sq. feet
|
2 baths 4 beds |
show details | |

|
#45
Cliftwood Dr
Clarksville, IN 47129
|
1,080 sq. feet
|
1 baths 3 beds |
show details | |

|
#46
Overlook Rd
Louisville, KY 40229
|
900 sq. feet
|
1 baths 3 beds |
show details | |

|
#47
Plainfield Dr
New Albany, IN 47150
|
2,000 sq. feet
|
1 baths 4 beds |
show details | |

|
#48
Blackiston View Dr
Clarksville, IN 47129
|
1,553 sq. feet
|
2 baths 3 beds |
show details | |

|
#49
Bohart Ln
Charlestown, IN 47111
|
750 sq. feet
|
2 baths 2 beds |
show details | |

|
Check over 1 million property listings on Foreclosure.com!
|
browse all offers | |||
Latest news about housing in Keeneland, KY collected exclusively by city-data.com from local newspapers, TV, and radio stations

 | Should I visit Louisville or Lexington? (11 replies) |
| Moving from CO Possibly Next Summer (20 replies) |
| Moving to Lexington-which area and best for athletic son? (5 replies) |
| Lexington must sees? (10 replies) |
| Landmarks (4 replies) |
| Single 24f considering a move to KY (13 replies) |

Household type by relationship:
Households: 726,943- In family households: 580,435 (118,887 male householders, 70,095 female householders)
126,329 spouses, 205,111 children (190,669 natural, 5,126 adopted, 9,316 stepchildren), 18,004 grandchildren, 7,360 brothers or sisters, 5,615 parents, foster children, 8,500 other relatives, 17,409 non-relatives
- In nonfamily households: 146,508 (55,241 male householders (43,300 living alone)), 64,952 female householders (55,543 living alone)), 26,315 nonrelatives
- In group quarters: 14,153 (8,529 institutionalized population)
98,371 married couples with children.
51,135 single-parent households (8,275 men, 42,860 women).
93.4% of residents of Keeneland speak English at home.
0.9% of residents speak Spanish at home (100% speak English very well).
5.7% of residents speak other Indo-European language at home (55% speak English very well, 35% speak English well, 10% speak English not well).
Foreign born population: 29 (7.1%)
(24.1% of them are naturalized citizens)
| Here: | 6.5 |
| State: | 6.4 |
| Here: | 5.2 |
| State: | 4.4 |
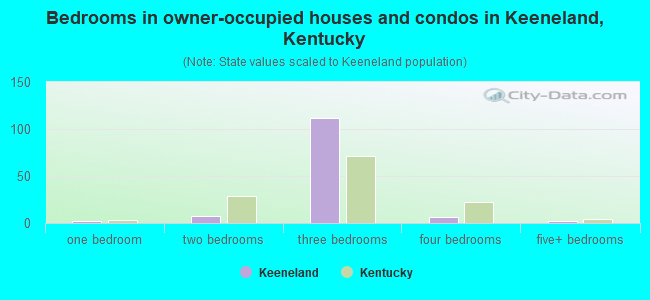
- Bedrooms in owner-occupied houses and condos in Keeneland, Kentucky
- 0no bedroom
- 21 bedroom
- 72 bedrooms
- 1123 bedrooms
- 64 bedrooms
- 25+ bedrooms
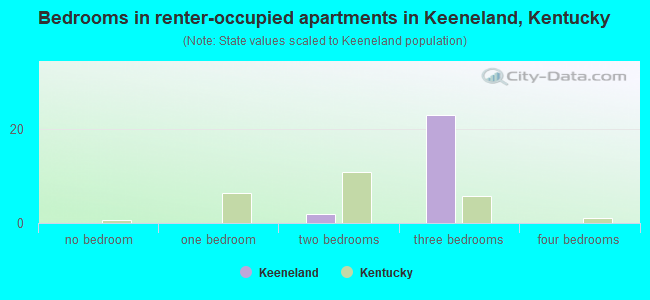
- Bedrooms in renter-occupied apartments in Keeneland, Kentucky
- 0no bedroom
- 01 bedroom
- 22 bedrooms
- 233 bedrooms
- 04 bedrooms
- 05+ bedrooms
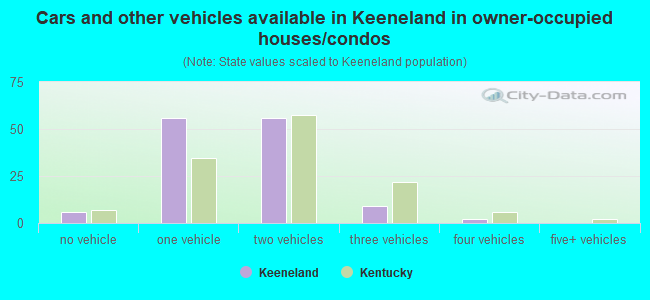
- Cars and other vehicles available in Keeneland in owner-occupied houses/condos
- 6no vehicle
- 561 vehicle
- 562 vehicles
- 93 vehicles
- 24 vehicles
- 05+ vehicles
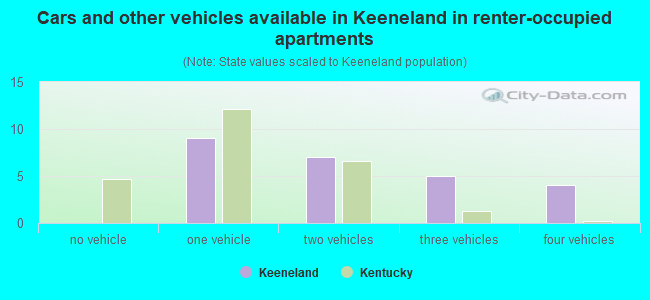
- Cars and other vehicles available in Keeneland in renter-occupied apartments
- 0no vehicle
- 91 vehicle
- 72 vehicles
- 53 vehicles
- 44 vehicles
- 05+ vehicles
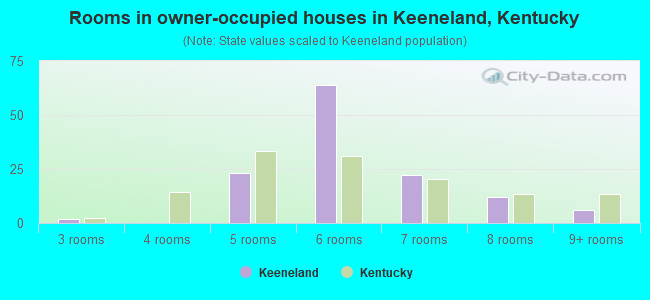
- Rooms in owner-occupied houses in Keeneland, Kentucky
- 01 room
- 02 rooms
- 23 rooms
- 04 rooms
- 235 rooms
- 646 rooms
- 227 rooms
- 128 rooms
- 69+ rooms
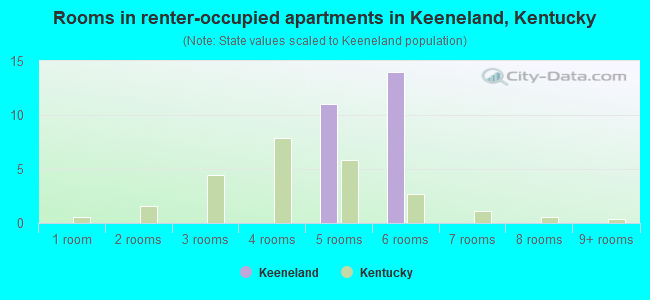
- Rooms in renter-occupied apartments in Keeneland, Kentucky
- 01 room
- 02 rooms
- 03 rooms
- 04 rooms
- 115 rooms
- 146 rooms
- 07 rooms
- 08 rooms
- 09+ rooms
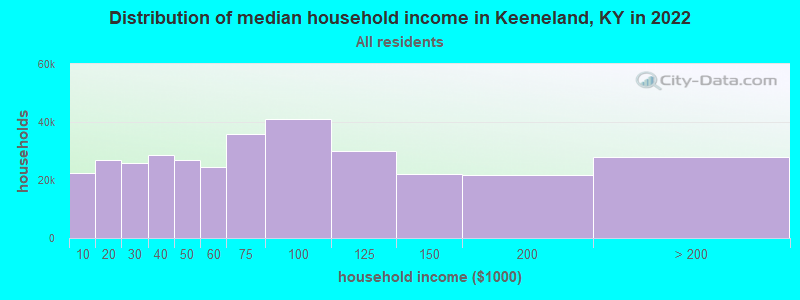
Keeneland, KY household income distribution

- 22,505Less than $10,000
- 26,829$10,000 to $19,999
- 25,809$20,000 to $29,999
- 28,465$30,000 to $39,999
- 26,963$40,000 to $49,999
- 24,487$50,000 to $59,999
- 35,751$60,000 to $74,999
- 41,109$75,000 to $99,999
- 29,841$100,000 to $124,999
- 22,118$125,000 to $149,999
- 21,721$150,000 to $199,999
- 27,953$200,000 or more
Percentage of workers working in this county: 90.7%
Number of people working at home: 32 (14.1% of all workers)
Travel time to work (commute)
- Less than 5 minutes: 12
- 5 to 9 minutes: 29
- 10 to 14 minutes: 35
- 15 to 19 minutes: 28
- 20 to 24 minutes: 40
- 25 to 29 minutes: 2
- 30 to 34 minutes: 22
- 35 to 39 minutes: 0
- 40 to 44 minutes: 4
- 45 to 59 minutes: 7
- 60 to 89 minutes: 7
- 90 or more minutes: 4
Means of transportation to work:
- Drove a car alone: 152 (78.8%)
- Carpooled: 32 (16.6%)
- Bus or trolley bus: 4 (2.1%)
- Walked: 2 (1.0%)
- Worked at home: 3 (1.6%)
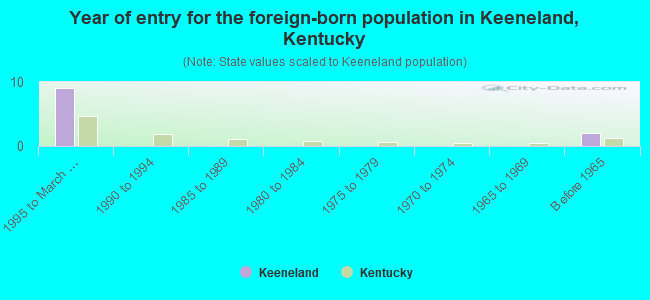
- Year of entry for the foreign-born population in Keeneland, Kentucky
- 91995 to March 2000
- 01990 to 1994
- 01985 to 1989
- 01980 to 1984
- 01975 to 1979
- 01970 to 1974
- 01965 to 1969
- 2Before 1965
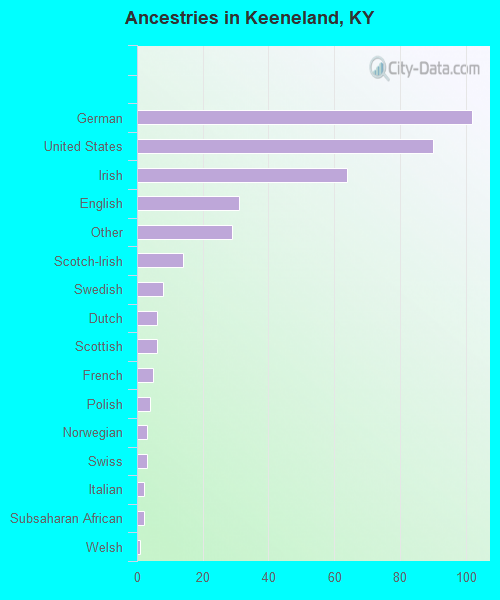
First ancestries reported:
- German: 102 (27.6%)
- United States: 90 (24.3%)
- Irish: 64 (17.3%)
- English: 31 (8.4%)
- Other: 29 (7.8%)
- Scotch-Irish: 14 (3.8%)
- Swedish: 8 (2.2%)
- Dutch: 6 (1.6%)
- Scottish: 6 (1.6%)
- French: 5 (1.4%)
- Polish: 4 (1.1%)
- Norwegian: 3 (0.8%)
- Swiss: 3 (0.8%)
- Italian: 2 (0.5%)
- Subsaharan African: 2 (0.5%)
- Welsh: 1 (0.3%)
Most common places of birth for foreign-born residents (%):
| Keeneland: | 81.8% (9) |
| Kentucky: | 0.3% (223) |
| Keeneland: | 18.2% (2) |
| Kentucky: | 8.3% (6,658) |
Place of birth for U.S.-born residents:
- This state: 251
- Other state: 101
- Northeast: 18
- Midwest: 41
- South: 29
- West: 13
59% of Keeneland residents lived in the same house 5 years ago.
Out of people who lived in different houses, 68% lived in this county.
Out of people who lived in different counties, 38% lived in Kentucky.
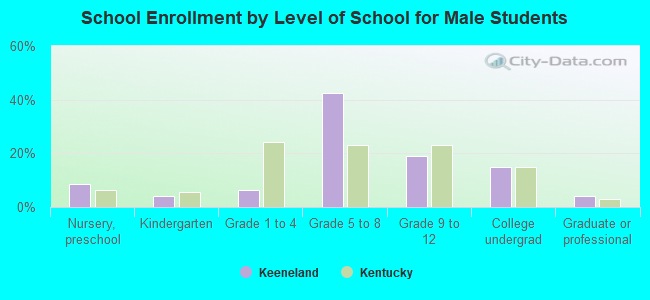
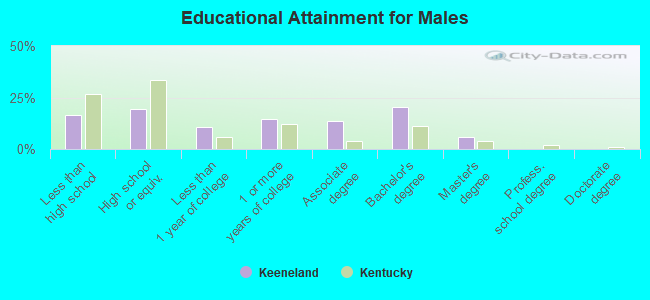
Education attainment for males 25 years and older:
- No schooling: 0
- Nursery to 4th grade: 0
- 5th and 6th grade: 2
- 7th and 8th grade: 0
- 9th grade: 5
- 10th grade: 3
- 11th grade: 4
- 12th grade, no diploma: 3
- High school graduate (or equivalency): 20
- Less than 1 year of college: 11
- Some college more than 1 year, no degree: 15
- Associate degree: 14
- Bachelor's degree: 21
- Master's degree: 6
- Professional school degree: 0
- Doctorate degree: 0
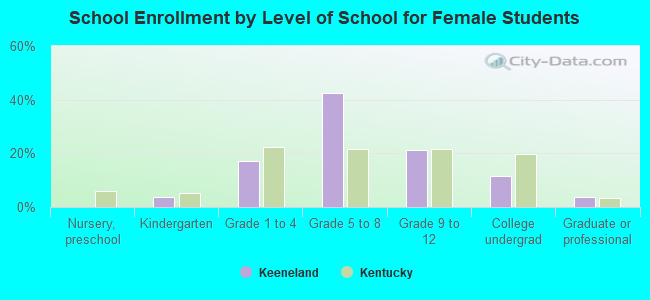
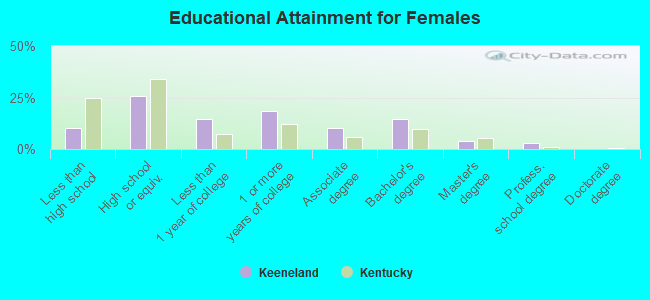
Education attainment for females 25 years and older:
- No schooling: 0
- Nursery to 4th grade: 0
- 5th and 6th grade: 3
- 7th and 8th grade: 2
- 9th grade: 1
- 10th grade: 2
- 11th grade: 2
- 12th grade, no diploma: 4
- High school graduate (or equivalency): 35
- Less than 1 year of college: 20
- Some college more than 1 year, no degree: 25
- Associate degree: 14
- Bachelor's degree: 20
- Master's degree: 5
- Professional school degree: 4
- Doctorate degree: 0


Housing units in structures:
- One, detached: 154
- One, attached: 3
Housing units lacking complete kitchen facilities: 1.9%
Private vs. public school enrollment:
| Here: | 18.5% |
| Kentucky: | 11.9% |
| Here: | 20.0% |
| Kentucky: | 10.6% |
| Here: | 15.4% |
| Kentucky: | 18.1% |