Kerens, TX (Texas) Houses and Residents
| Kerens: | $144,643 |
| Texas: | $275,400 |
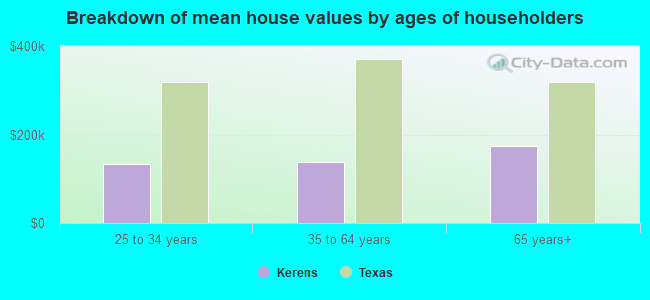
Mean price in 2022:
Detached houses: $125,476
Here: $125,476 State: $369,058
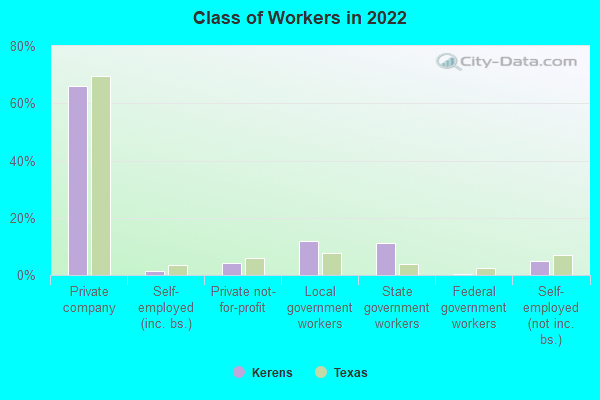
Total population: 1,556 (Urban population: 0, Rural population: 1,716 (all nonfarm))
Houses: 763 (624 occupied: 350 owner occupied, 283 renter occupied)
| % of renters here: | 45% |
| State: | 38% |
Housing density: 327 houses/condos per square mile
Median price asked for vacant for-sale houses and condos in 2022: $394,988.
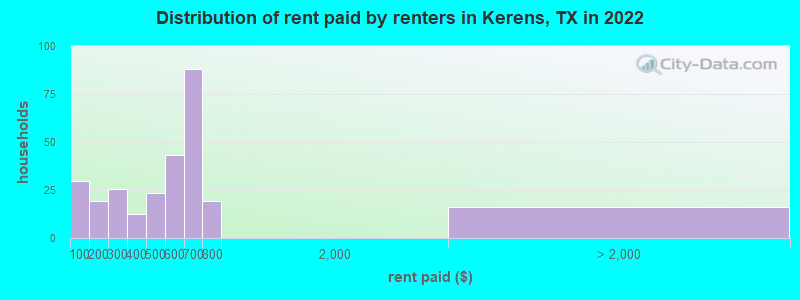
Median contract rent in 2022: $565 (lower quartile is $234, upper quartile is $678)
Median rent asked for vacant for-rent units in 2022: $620
Median gross rent in Kerens, TX in 2022: $669
Housing units in Kerens with a mortgage: 136 (0 second mortgage, 0 home equity loan, 0 both second mortgage and home equity loan)
Houses without a mortgage: 0
Median household income for houses/condos with a mortgage: $93,281
Median household income for apartments without a mortgage: $58,004
Median monthly housing costs: $696
Compare current foreclosures near Kerens, TX:
| Photo | Address | Area | Beds / Baths | Price | Details |
|---|---|---|---|---|---|

|
#1
Ivy St
Kerens, TX 75144
|
1,320 sq. feet
|
1 baths - beds |
show details | |

|
#2
SE 2nd St
Kerens, TX 75144
|
1,363 sq. feet
|
1 baths - beds |
show details | |

|
#3
NE County Road 3170b
Kerens, TX 75144
|
- sq. feet
|
- baths - beds |
show details | |

|
#4
Chambers Point Dr
Kerens, TX 75144
|
- sq. feet
|
- baths - beds |
show details | |

|
#5
L S P Cir
Kerens, TX 75144
|
1,518 sq. feet
|
- baths - beds |
show details | |

|
#6
SW 3rd St
Kerens, TX 75144
|
1,190 sq. feet
|
- baths - beds |
show details | |

|
#7
N Wright Ave
Kerens, TX 75144
|
1,385 sq. feet
|
- baths - beds |
show details | |

|
#8
Natchez Trl
Mabank, TX 75156
|
2,432 sq. feet
|
2 baths 5 beds |
show details | |

|
#9
NW County Road 0006
Corsicana, TX 75110
|
7,024 sq. feet
|
3 baths - beds |
show details | |

|
#10
Mimosa Dr
Corsicana, TX 75110
|
2,035 sq. feet
|
2 baths - beds |
show details |
| Photo | Address | Area | Beds / Baths | Price | Details |
|---|---|---|---|---|---|

|
#11
W 4th Ave
Corsicana, TX 75110
|
2,046 sq. feet
|
1 baths - beds |
show details | |

|
#12
Birdwell Rd
Corsicana, TX 75110
|
1,486 sq. feet
|
1 baths - beds |
show details | |

|
#13
Renee St
Corsicana, TX 75110
|
1,772 sq. feet
|
2 baths - beds |
show details | |

|
#14
E Beverly Dr
Corsicana, TX 75110
|
1,429 sq. feet
|
2 baths - beds |
show details | |

|
#15
Fm 3041
Corsicana, TX 75109
|
1,169 sq. feet
|
1 baths - beds |
show details | |

|
#16
N 26th St
Corsicana, TX 75110
|
1,326 sq. feet
|
2 baths - beds |
show details | |

|
#17
W 2nd Ave
Corsicana, TX 75110
|
- sq. feet
|
- baths - beds |
show details | |

|
#18
Northwood Blvd
Corsicana, TX 75110
|
2,053 sq. feet
|
- baths - beds |
show details | |

|
#19
N Commerce St
Corsicana, TX 75110
|
1,096 sq. feet
|
- baths - beds |
show details | |

|
#20
Springleaf Ln
Mabank, TX 75147
|
- sq. feet
|
- baths - beds |
show details |
| Photo | Address | Area | Beds / Baths | Price | Details |
|---|---|---|---|---|---|

|
#21
Willowood Dr
Mabank, TX 75156
|
728 sq. feet
|
- baths - beds |
show details | |

|
#22
County Road 2852
Eustace, TX 75124
|
1,316 sq. feet
|
- baths - beds |
show details | |

|
#23
E Travis Ln
Malakoff, TX 75148
|
- sq. feet
|
- baths - beds |
show details | |

|
#24
N 13th St Apt 51a
Corsicana, TX 75110
|
- sq. feet
|
- baths - beds |
show details | |

|
#25
Glenbrook St
Corsicana, TX 75110
|
- sq. feet
|
- baths - beds |
show details | |

|
#26
W 7th Ave Apt 607
Corsicana, TX 75110
|
- sq. feet
|
- baths - beds |
show details | |

|
#27
County Road 2101
Kemp, TX 75143
|
1,770 sq. feet
|
- baths - beds |
show details | |

|
#28
Cambridge St Apt 319
Corsicana, TX 75110
|
- sq. feet
|
- baths - beds |
show details | |

|
#29
Fm 316
Eustace, TX 75124
|
1,216 sq. feet
|
- baths - beds |
show details | |

|
#30
Flying Bridge Dr
Mabank, TX 75156
|
- sq. feet
|
- baths - beds |
show details |
| Photo | Address | Area | Beds / Baths | Price | Details |
|---|---|---|---|---|---|

|
#31
Pugh Ln
Corsicana, TX 75109
|
- sq. feet
|
- baths - beds |
show details | |

|
#32
Pine Bloom Blvd
Mabank, TX 75156
|
1,624 sq. feet
|
- baths - beds |
show details | |

|
#33
Wildwind St
Mabank, TX 75156
|
1,216 sq. feet
|
- baths - beds |
show details | |

|
#34
Callie Ln
Mabank, TX 75156
|
- sq. feet
|
- baths - beds |
show details | |

|
#35
Skylark Dr
Mabank, TX 75156
|
- sq. feet
|
- baths - beds |
show details | |

|
#36
Ben Lacy Dr
Mabank, TX 75156
|
- sq. feet
|
- baths - beds |
show details | |

|
#37
E 14th Ave
Corsicana, TX 75110
|
- sq. feet
|
- baths - beds |
show details | |

|
#38
Tall Trees Dr
Trinidad, TX 75163
|
- sq. feet
|
- baths - beds |
show details | |

|
#39
NE County Road 160
Powell, TX 75153
|
1,850 sq. feet
|
- baths - beds |
show details | |

|
#40
SE County Road 3080
Corsicana, TX 75109
|
- sq. feet
|
- baths - beds |
show details |
| Photo | Address | Area | Beds / Baths | Price | Details |
|---|---|---|---|---|---|

|
#41
The Shores Dr
Corsicana, TX 75109
|
- sq. feet
|
- baths - beds |
show details | |

|
#42
Deer Island Rd
Mabank, TX 75156
|
1,874 sq. feet
|
- baths - beds |
show details | |

|
#43
Oakridge Cir
Malakoff, TX 75148
|
- sq. feet
|
- baths - beds |
show details | |

|
#44
Hickory St
Mabank, TX 75156
|
- sq. feet
|
- baths - beds |
show details | |

|
#45
Crown Dr
Kemp, TX 75143
|
1,064 sq. feet
|
- baths - beds |
show details | |

|
#46
County Road 2404
Kemp, TX 75143
|
3,838 sq. feet
|
- baths - beds |
show details | |

|
#47
Cedarwood Dr
Mabank, TX 75156
|
1,600 sq. feet
|
- baths - beds |
show details | |

|
#48
Natchez Trl
Mabank, TX 75156
|
1,008 sq. feet
|
- baths - beds |
show details | |

|
#49
Inca Dr
Mabank, TX 75156
|
1,404 sq. feet
|
- baths - beds |
show details | |

|
Check over 1 million property listings on Foreclosure.com!
|
browse all offers | |||

Latest news about housing in Kerens, TX collected exclusively by city-data.com from local newspapers, TV, and radio stations


Median year apartment built: 1971
Household type by relationship:
Households: 1,982- Male householders: 186 (29 living alone), Female householders: 429 (124 living alone)
278 spouses (278 opposite-sex spouses), 43 unmarried partners, (43 opposite-sex unmarried partners), 717 children (717 natural, 0 adopted, 0 stepchildren), 111 grandchildren, 14 brothers or sisters, 28 parents, 0 foster children, 69 other relatives, 37 non-relatives
- In group quarters: 64
Size of family households: 171 2-persons, 69 3-persons, 100 4-persons, 38 5-persons, 32 6-persons, 14 7-or-more-persons.
Size of nonfamily households: 162 1-person, 44 2-persons.
340 married couples with children.
150 single-parent households (0 men, 150 women).
96.5% of residents of Kerens speak English at home.
3.6% of residents speak Spanish at home (39% speak English very well, 14% speak English well, 47% don't speak English at all).
Foreign born population: 65 (3.3%)
(23.1% of them are naturalized citizens)
| Here: | 6.3 |
| State: | 6.3 |
| Here: | 4.6 |
| State: | 4.0 |
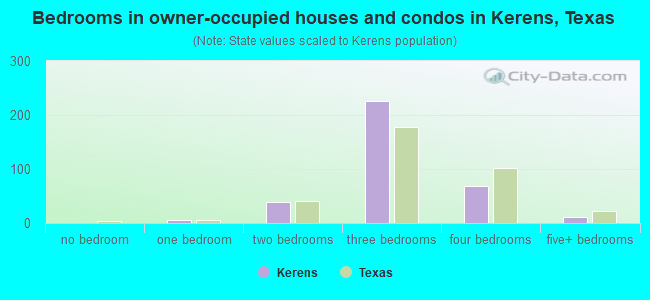
- Bedrooms in owner-occupied houses and condos in Kerens, Texas
- 0no bedroom
- 61 bedroom
- 392 bedrooms
- 2263 bedrooms
- 694 bedrooms
- 115+ bedrooms
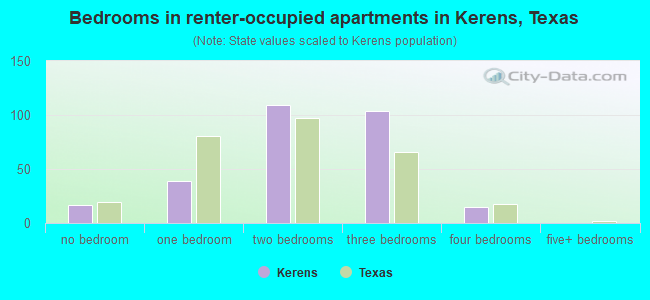
- Bedrooms in renter-occupied apartments in Kerens, Texas
- 17no bedroom
- 391 bedroom
- 1092 bedrooms
- 1043 bedrooms
- 154 bedrooms
- 05+ bedrooms
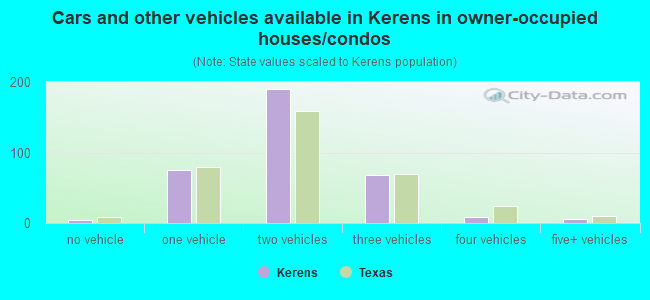
- Cars and other vehicles available in Kerens in owner-occupied houses/condos
- 4no vehicle
- 751 vehicle
- 1902 vehicles
- 683 vehicles
- 84 vehicles
- 55+ vehicles
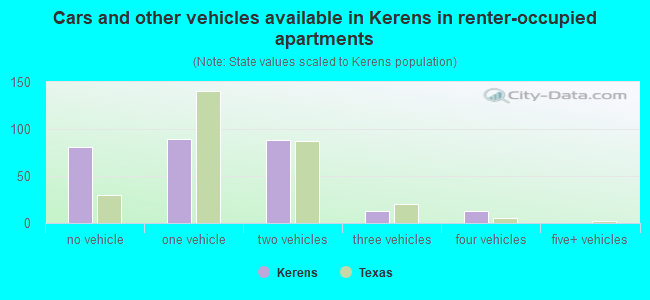
- Cars and other vehicles available in Kerens in renter-occupied apartments
- 81no vehicle
- 891 vehicle
- 882 vehicles
- 133 vehicles
- 134 vehicles
- 05+ vehicles
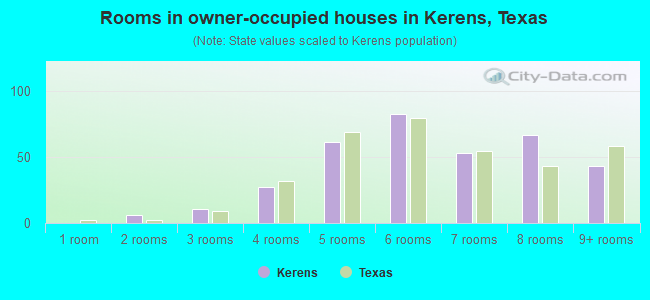
- Rooms in owner-occupied houses in Kerens, Texas
- 01 room
- 62 rooms
- 113 rooms
- 274 rooms
- 615 rooms
- 826 rooms
- 537 rooms
- 678 rooms
- 439+ rooms
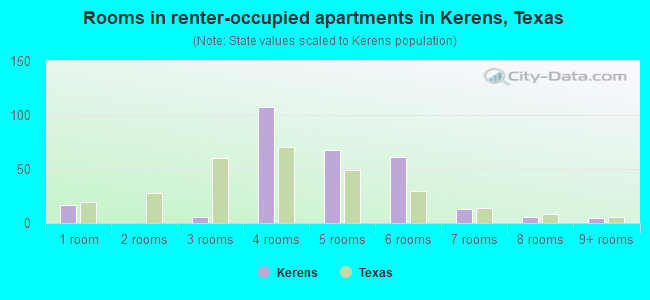
- Rooms in renter-occupied apartments in Kerens, Texas
- 171 room
- 02 rooms
- 63 rooms
- 1074 rooms
- 685 rooms
- 616 rooms
- 137 rooms
- 68 rooms
- 59+ rooms
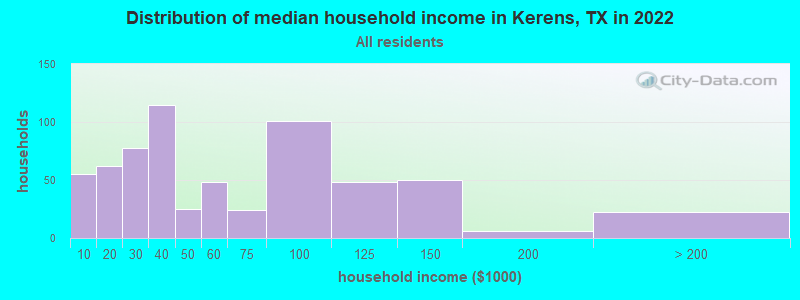
Kerens, TX household income distribution

- 55Less than $10,000
- 62$10,000 to $19,999
- 78$20,000 to $29,999
- 115$30,000 to $39,999
- 25$40,000 to $49,999
- 48$50,000 to $59,999
- 24$60,000 to $74,999
- 101$75,000 to $99,999
- 48$100,000 to $124,999
- 50$125,000 to $149,999
- 6$150,000 to $199,999
- 22$200,000 or more
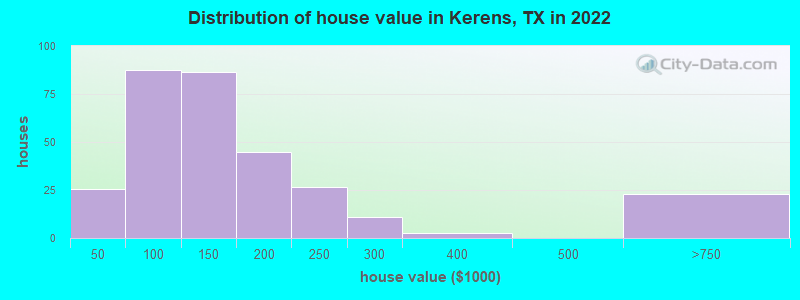
Home value of owner - occupied houses in 2022 in Kerens, TX
-
- 7Less than $10,000
- 11$35,000 to $39,999
- 6$40,000 to $49,999
- 11$50,000 to $59,999
- 47$60,000 to $69,999
- 4$70,000 to $79,999
- 11$80,000 to $89,999
- 5$90,000 to $99,999
- 44$100,000 to $124,999
- 41$125,000 to $149,999
- 39$150,000 to $174,999
- 5$175,000 to $199,999
- 26$200,000 to $249,999
- 10$250,000 to $299,999
- 2$300,000 to $399,999
- 22$500,000 to $749,999
Rent paid by renters in 2022 in Kerens, TX
-
- 29Less than $100
- 15$100 to $149
- 3$150 to $199
- 22$200 to $249
- 2$250 to $299
- 12$300 to $349
- 19$400 to $449
- 3$450 to $499
- 22$500 to $549
- 20$550 to $599
- 38$600 to $649
- 49$650 to $699
- 2$700 to $749
- 16$750 to $799
- 16No cash rent
Percentage of workers working in this county: 64.3%
Number of people working at home: 24 (3.0% of all workers)
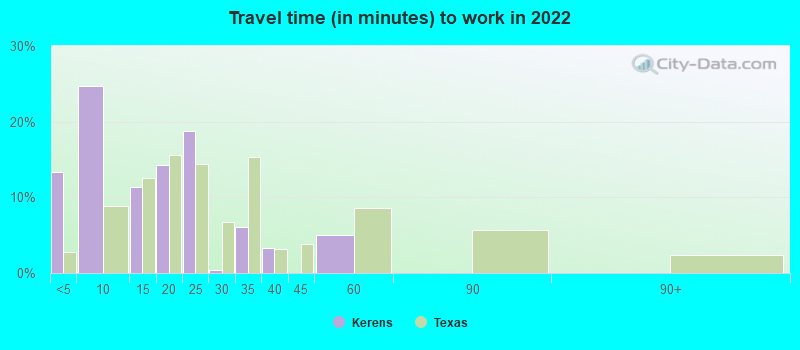
Travel time to work (commute)
- Less than 5 minutes: 92
- 5 to 9 minutes: 29
- 10 to 14 minutes: 15
- 15 to 19 minutes: 119
- 20 to 24 minutes: 110
- 25 to 29 minutes: 46
- 30 to 34 minutes: 85
- 35 to 39 minutes: 27
- 40 to 44 minutes: 24
- 45 to 59 minutes: 81
- 60 to 89 minutes: 94
- 90 or more minutes: 33
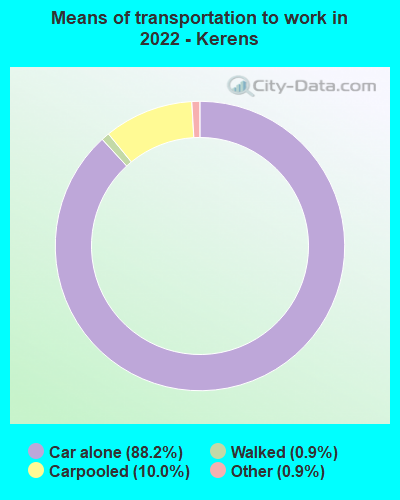
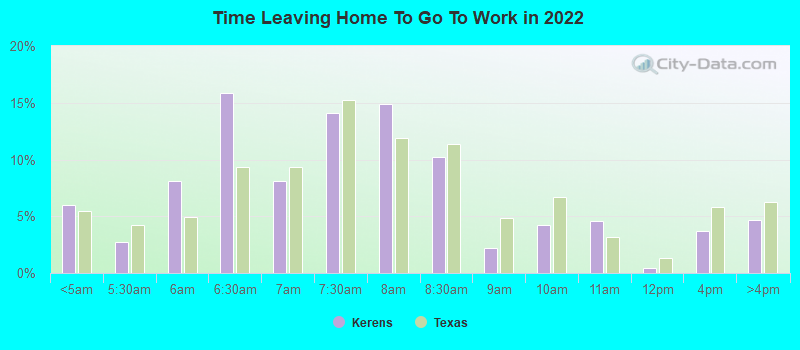
Means of transportation to work:
- Drove a car alone: 303 (76.9%)
- Carpooled: 33 (8.4%)
- Taxi: 3 (0.8%)
- Walked: 3 (0.8%)
- Worked at home: 68 (17.3%)
- Unemployment by race in 2022
- Unemployment rate for White non-Hispanic residents
- 5.1%Males
- 1.3%Females
- Unemployment rate for Black residents
- 4.5%Males
- 34.9%Females
- Unemployment rate for American Indian and Alaska Native residents
- 100.0%Males
- Unemployment rate for other race residents
- 41.7%Males
- Unemployment rate for Hispanic or Latino residents
- 20.9%Males
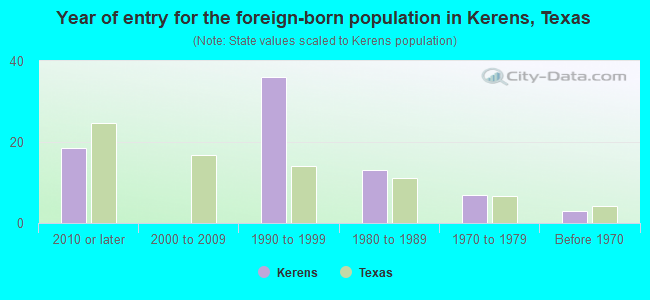
- Year of entry for the foreign-born population in Kerens, Texas
- 182010 or later
- 02000 to 2009
- 361990 to 1999
- 131980 to 1989
- 71970 to 1979
- 3Before 1970
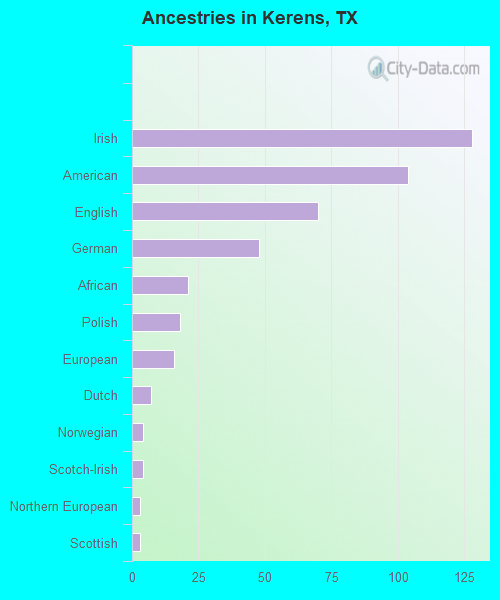
First ancestries reported:
- Irish: 128 (12.8%)
- American: 104 (10.4%)
- English: 70 (7.0%)
- German: 48 (4.8%)
- African: 21 (2.1%)
- Polish: 18 (1.8%)
- European: 16 (1.6%)
- Dutch: 7 (0.7%)
- Norwegian: 4 (0.4%)
- Scotch-Irish: 4 (0.4%)
- Northern European: 3 (0.3%)
- Scottish: 3 (0.3%)
Most common places of birth for foreign-born residents (%):
| Kerens: | 81.5% (53) |
| Texas: | 48.4% (2,411,723) |
| Kerens: | 12.3% (8) |
| Texas: | 1.5% (72,413) |
| Kerens: | 4.6% (3) |
| Texas: | 1.1% (55,371) |
Place of birth for U.S.-born residents:
- This state: 1,600
- Other state: 299
- Northeast: 27
- Midwest: 157
- South: 81
- West: 30
81.9% of Kerens residents lived in the same house 1 years ago.
Out of people who lived in different houses, 30.2% lived in this county.
Out of people who lived in different counties, 95.3% lived in Texas.
| Kerens: | 81.9% |
| State average: | 85.7% |
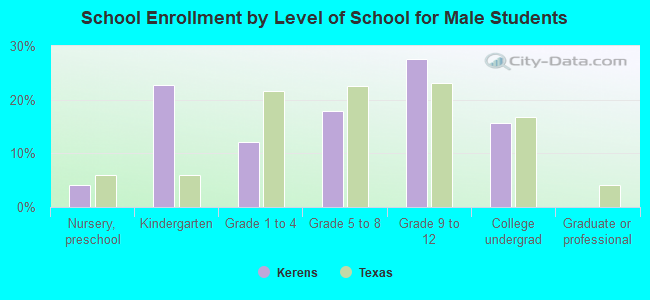
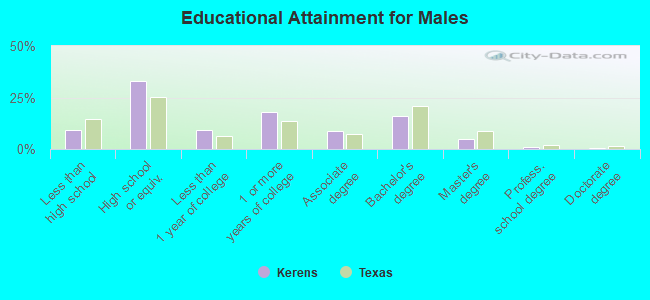
Education attainment for males 25 years and older:
- No schooling: 9
- Nursery to 4th grade: 1
- 5th and 6th grade: 16
- 7th and 8th grade: 0
- 9th grade: 8
- 10th grade: 7
- 11th grade: 0
- 12th grade, no diploma: 2
- High school graduate (or equivalency): 153
- Less than 1 year of college: 43
- Some college more than 1 year, no degree: 83
- Associate degree: 41
- Bachelor's degree: 74
- Master's degree: 22
- Professional school degree: 4
- Doctorate degree: 3
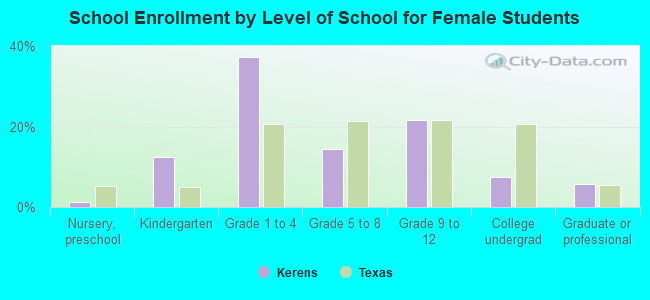
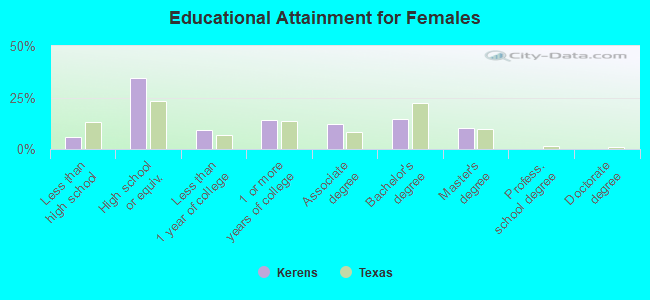
Education attainment for females 25 years and older:
- No schooling: 3
- Nursery to 4th grade: 0
- 5th and 6th grade: 7
- 7th and 8th grade: 6
- 9th grade: 0
- 10th grade: 5
- 11th grade: 18
- 12th grade, no diploma: 0
- High school graduate (or equivalency): 238
- Less than 1 year of college: 65
- Some college more than 1 year, no degree: 96
- Associate degree: 84
- Bachelor's degree: 102
- Master's degree: 69
- Professional school degree: 0
- Doctorate degree: 0


Housing units in structures:
- One, detached: 567
- One, attached: 34
- Two: 63
- 3 or 4: 10
- 5 to 9: 29
- 20 to 49: 5
- Mobile homes: 46
- Boats, RVs, vans, etc.: 6
Housing units lacking complete kitchen facilities in 2022: 8.9%
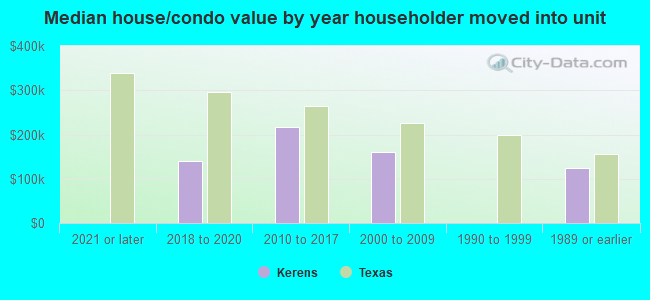
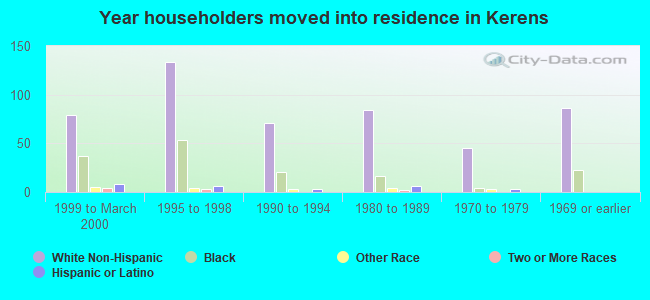
House/condo owner moved in on average 15 years ago
Renter moved in on average 3 years ago
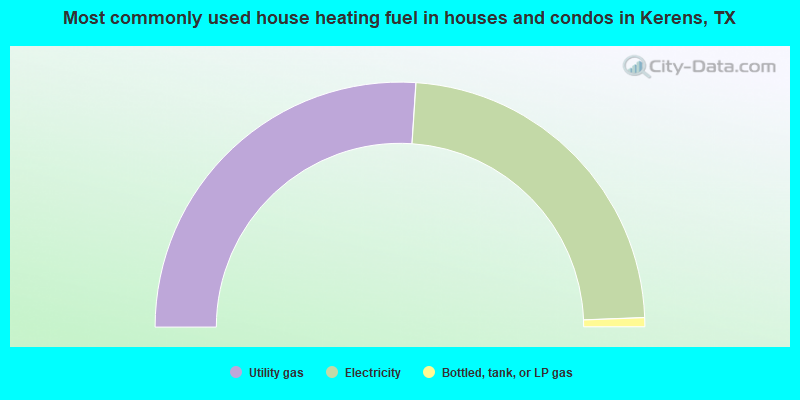
- 52.1%Utility gas
- 46.7%Electricity
- 1.2%Bottled, tank, or LP gas
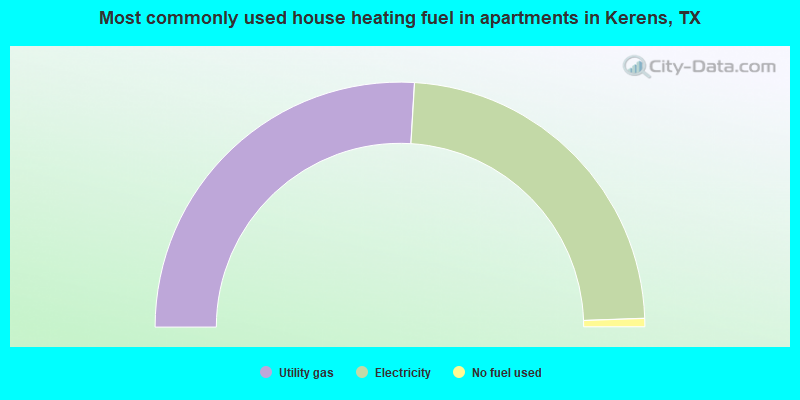
- 51.9%Utility gas
- 47.0%Electricity
- 1.1%No fuel used
Private vs. public school enrollment:
| Here: | 0.0% |
| Texas: | 8.8% |
| Here: | 0.0% |
| Texas: | 8.0% |
| Here: | 19.7% |
| Texas: | 16.2% |