Kingsley, MI (Michigan) Houses and Residents
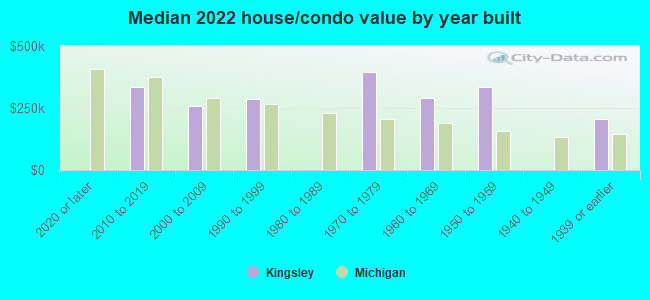
| Kingsley: | $278,995 |
| Michigan: | $224,400 |
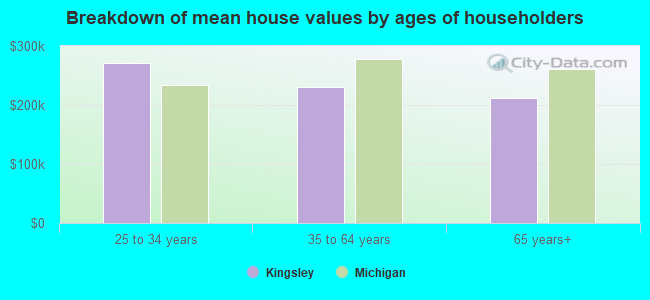
Mean price in 2022:
Detached houses: $263,961
Here: $263,961 State: $280,038 Mobile homes: $39,049
Here: $39,049 State: $72,868
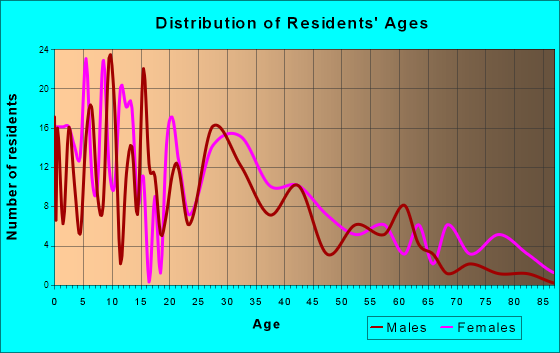
Total population: 1,545 (Urban population: 0, Rural population: 1,448 (all nonfarm))
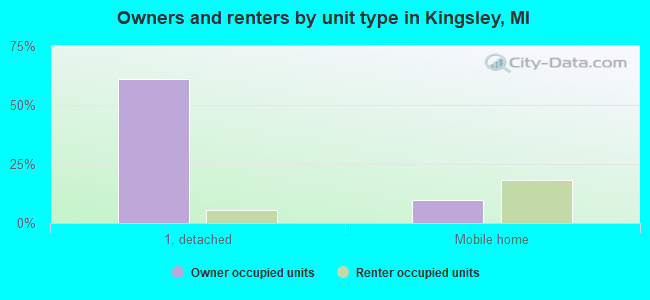
Houses: 574 (526 occupied: 373 owner occupied, 153 renter occupied)
| % of renters here: | 29% |
| State: | 27% |
Housing density: 518 houses/condos per square mile
Median price asked for vacant for-sale houses and condos in 2022 in this county: $77,766.
Median contract rent in 2022: $913 (lower quartile is $753, upper quartile is $1,156)
Median rent asked for vacant for-rent units in 2022: $1,208
Median gross rent in Kingsley, MI in 2022: $1,077
Housing units in Kingsley with a mortgage: 261 (24 second mortgage, 0 home equity loan, 14 both second mortgage and home equity loan)
Houses without a mortgage: 0
Median household income for houses/condos with a mortgage: $78,453
Median household income for apartments without a mortgage: $53,409
Median monthly housing costs: $1,196
Compare current foreclosures near Kingsley, MI:
| Photo | Address | Area | Beds / Baths | Price | Details |
|---|---|---|---|---|---|

|
#1
Gleaner Hall Rd
Kingsley, MI 49649
|
1,573 sq. feet
|
2 baths 3 beds |
show details | |

|
#2
Keffer Rd
Kingsley, MI 49649
|
- sq. feet
|
- baths - beds |
show details | |

|
#3
Cathleen Ln
Kingsley, MI 49649
|
- sq. feet
|
- baths - beds |
show details | |

|
#4
Laredo Dr
Kingsley, MI 49649
|
- sq. feet
|
- baths - beds |
show details | |

|
#5
Walton Rd
Kingsley, MI 49649
|
- sq. feet
|
- baths - beds |
show details | |

|
#6
Johnson Rd
Kingsley, MI 49649
|
- sq. feet
|
- baths - beds |
show details | |

|
#7
Walton Rd
Kingsley, MI 49649
|
- sq. feet
|
- baths - beds |
show details | |

|
#8
Kingsley Rd
Kingsley, MI 49649
|
- sq. feet
|
- baths - beds |
show details | |

|
#9
E Main St
Kingsley, MI 49649
|
- sq. feet
|
- baths - beds |
show details | |

|
#10
Paradise Rd
Kingsley, MI 49649
|
- sq. feet
|
- baths - beds |
show details |
| Photo | Address | Area | Beds / Baths | Price | Details |
|---|---|---|---|---|---|

|
#11
N 41 1/2 Rd
Manton, MI 49663
|
1,680 sq. feet
|
2 baths 3 beds |
show details | |

|
#12
E County Line Rd
Fife Lake, MI 49633
|
- sq. feet
|
2 baths 4 beds |
show details | |

|
#13
Ringneck Ln
Buckley, MI 49620
|
- sq. feet
|
2 baths 3 beds |
show details | |

|
#14
Primrose Ln
Traverse City, MI 49685
|
- sq. feet
|
- baths - beds |
show details | |

|
#15
N 11 Rd
Mesick, MI 49668
|
- sq. feet
|
- baths - beds |
show details | |

|
#16
5th St # 4
Traverse City, MI 49684
|
- sq. feet
|
- baths - beds |
show details | |

|
#17
Shady Ln
Traverse City, MI 49686
|
- sq. feet
|
- baths - beds |
show details | |

|
#18
Wysong Rd
Traverse City, MI 49684
|
- sq. feet
|
- baths - beds |
show details | |

|
#19
Schneider Road
Traverse City, MI 49684
|
- sq. feet
|
- baths - beds |
show details | |

|
#20
Logan Valley Rd
Traverse City, MI 49684
|
- sq. feet
|
- baths - beds |
show details |
| Photo | Address | Area | Beds / Baths | Price | Details |
|---|---|---|---|---|---|

|
#21
Cinder Rd
Interlochen, MI 49643
|
- sq. feet
|
- baths - beds |
show details | |

|
#22
Shade Tree Ln
Traverse City, MI 49685
|
- sq. feet
|
- baths - beds |
show details | |

|
#23
Bates Rd
Williamsburg, MI 49690
|
- sq. feet
|
- baths - beds |
show details | |

|
#24
Rolling Meadows Dr
Traverse City, MI 49684
|
- sq. feet
|
- baths - beds |
show details | |

|
#25
Brookside Dr Apt 4
Traverse City, MI 49686
|
- sq. feet
|
- baths - beds |
show details | |

|
#26
Brookside Dr # 6
Traverse City, MI 49686
|
- sq. feet
|
- baths - beds |
show details | |

|
#27
Hawthorne Ln
Traverse City, MI 49686
|
- sq. feet
|
- baths - beds |
show details | |

|
#28
N 29 Rd
Cadillac, MI 49601
|
- sq. feet
|
- baths - beds |
show details | |

|
#29
Ponemah Trl
Buckley, MI 49620
|
- sq. feet
|
- baths - beds |
show details | |

|
#30
Birdie Ln
Traverse City, MI 49685
|
- sq. feet
|
- baths - beds |
show details |
| Photo | Address | Area | Beds / Baths | Price | Details |
|---|---|---|---|---|---|

|
#31
Wemple Rd
Traverse City, MI 49686
|
- sq. feet
|
- baths - beds |
show details | |

|
#32
Mobile Trl E
Traverse City, MI 49685
|
- sq. feet
|
- baths - beds |
show details | |

|
#33
Manitou Dr Apt 603
Traverse City, MI 49686
|
- sq. feet
|
- baths - beds |
show details | |

|
#34
S Curry Dr
Traverse City, MI 49685
|
- sq. feet
|
- baths - beds |
show details | |

|
#35
Scofield Trl
Williamsburg, MI 49690
|
- sq. feet
|
- baths - beds |
show details | |

|
#36
M 72 E
Williamsburg, MI 49690
|
- sq. feet
|
- baths - beds |
show details | |

|
#37
Melody Ln
Interlochen, MI 49643
|
- sq. feet
|
- baths - beds |
show details | |

|
#38
3rd St Apt 1
Traverse City, MI 49684
|
- sq. feet
|
- baths - beds |
show details | |

|
#39
Maple St
Manton, MI 49663
|
- sq. feet
|
- baths - beds |
show details | |

|
#40
Deepwater Point Rd
Williamsburg, MI 49690
|
- sq. feet
|
- baths - beds |
show details |
| Photo | Address | Area | Beds / Baths | Price | Details |
|---|---|---|---|---|---|

|
#41
N Long Lake Rd
Traverse City, MI 49685
|
- sq. feet
|
- baths - beds |
show details | |

|
#42
Wildwood Rd
Interlochen, MI 49643
|
- sq. feet
|
- baths - beds |
show details | |

|
#43
E Lincoln Rd
Cedar, MI 49621
|
- sq. feet
|
- baths - beds |
show details | |

|
#44
N Long Lake Rd
Traverse City, MI 49685
|
- sq. feet
|
- baths - beds |
show details | |

|
#45
Bridlewood Dr
Traverse City, MI 49685
|
- sq. feet
|
- baths - beds |
show details | |

|
#46
E 8th St # B
Traverse City, MI 49686
|
- sq. feet
|
- baths - beds |
show details | |

|
#47
E 9th St
Traverse City, MI 49684
|
- sq. feet
|
- baths - beds |
show details | |

|
#48
Hobbs Hwy N
Traverse City, MI 49696
|
- sq. feet
|
- baths - beds |
show details | |

|
#49
Tyler Hills Dr
Traverse City, MI 49685
|
- sq. feet
|
- baths - beds |
show details | |

|
Check over 1 million property listings on Foreclosure.com!
|
browse all offers | |||

Latest news about housing in Kingsley, MI collected exclusively by city-data.com from local newspapers, TV, and radio stations

 | Survey about relocation to Ann Arbor (43 replies) |
| Living in Traverse City with kids—sports, schools, etc. (6 replies) |
| Moving to Traverse City in June (20 replies) |
| Grand Rapids Development thread (39 replies) |
| Four dogs and two gay men (46 replies) |
| Kingsley, MI (7 replies) |
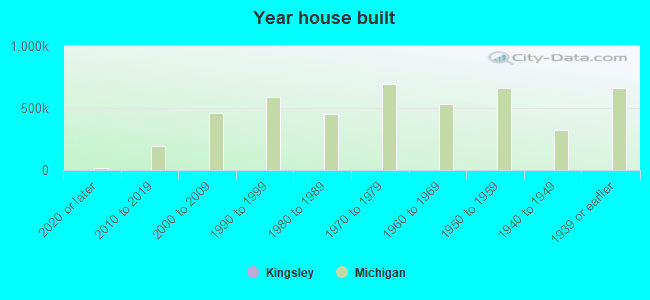
Median year apartment built: 1989
Household type by relationship:
Households: 1,813- Male householders: 263 (20 living alone), Female householders: 257 (73 living alone)
333 spouses (333 opposite-sex spouses), 51 unmarried partners, (51 opposite-sex unmarried partners), 817 children (796 natural, 7 adopted, 14 stepchildren), 11 grandchildren, 4 brothers or sisters, 13 parents, 0 foster children, 18 other relatives, 43 non-relatives
Size of family households: 148 2-persons, 84 3-persons, 66 4-persons, 21 5-persons, 10 6-persons, 21 7-or-more-persons.
Size of nonfamily households: 88 1-person, 48 2-persons, 7 4-persons.
608 married couples with children.
119 single-parent households (24 men, 95 women).
96.5% of residents of Kingsley speak English at home.
0.8% of residents speak Spanish at home (100% speak English very well).
1.3% of residents speak other Indo-European language at home (81% speak English very well, 19% speak English well).
0.3% of residents speak Asian or Pacific Island language at home (100% speak English very well).
Foreign born population: 4 (0.2%)
(125.0% of them are naturalized citizens)
| Here: | 7.1 |
| State: | 6.5 |
| Here: | 4.5 |
| State: | 4.3 |
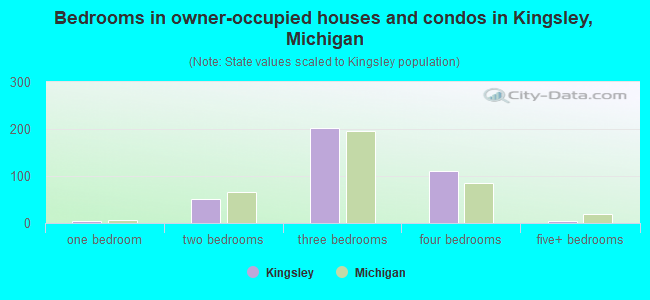
- Bedrooms in owner-occupied houses and condos in Kingsley, Michigan
- 0no bedroom
- 41 bedroom
- 512 bedrooms
- 2033 bedrooms
- 1114 bedrooms
- 45+ bedrooms
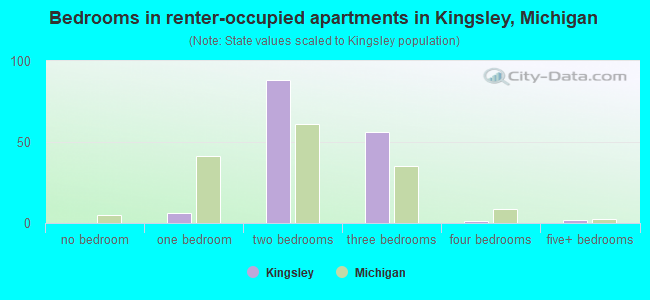
- Bedrooms in renter-occupied apartments in Kingsley, Michigan
- 0no bedroom
- 61 bedroom
- 882 bedrooms
- 563 bedrooms
- 14 bedrooms
- 25+ bedrooms
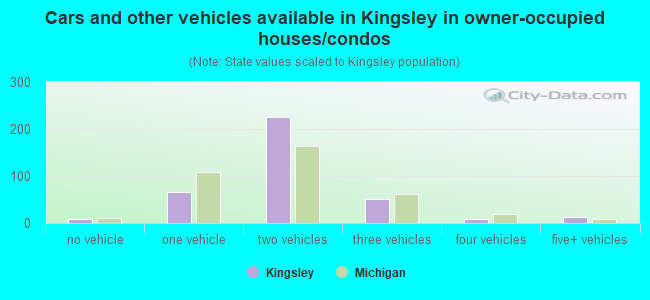
- Cars and other vehicles available in Kingsley in owner-occupied houses/condos
- 9no vehicle
- 671 vehicle
- 2262 vehicles
- 513 vehicles
- 84 vehicles
- 125+ vehicles
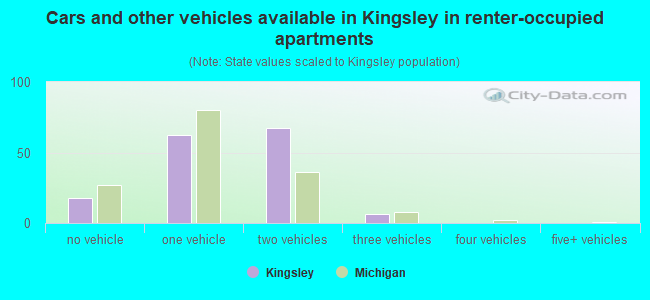
- Cars and other vehicles available in Kingsley in renter-occupied apartments
- 17no vehicle
- 631 vehicle
- 682 vehicles
- 63 vehicles
- 04 vehicles
- 05+ vehicles
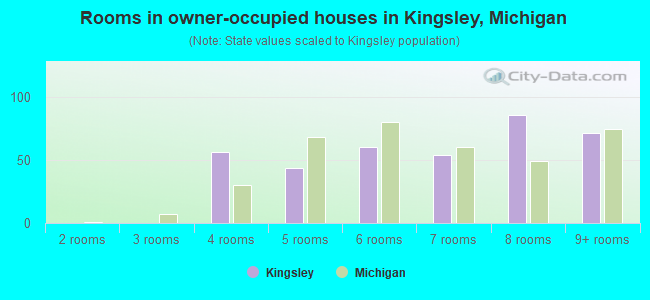
- Rooms in owner-occupied houses in Kingsley, Michigan
- 01 room
- 02 rooms
- 03 rooms
- 564 rooms
- 445 rooms
- 616 rooms
- 547 rooms
- 868 rooms
- 729+ rooms
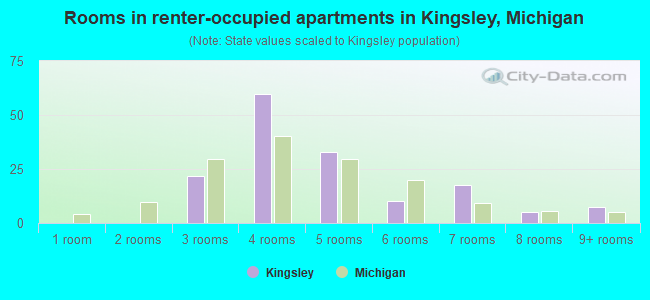
- Rooms in renter-occupied apartments in Kingsley, Michigan
- 01 room
- 02 rooms
- 223 rooms
- 604 rooms
- 335 rooms
- 106 rooms
- 177 rooms
- 58 rooms
- 79+ rooms
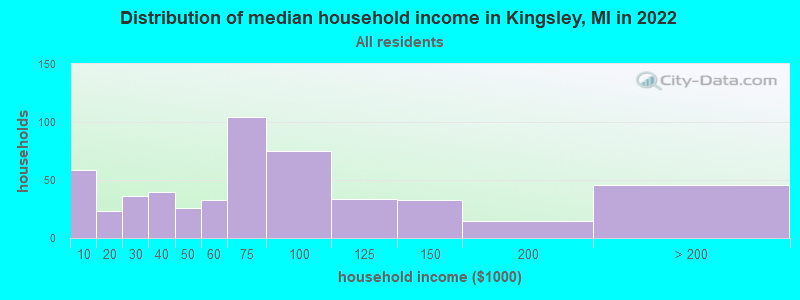
Kingsley, MI household income distribution

- 59Less than $10,000
- 23$10,000 to $19,999
- 36$20,000 to $29,999
- 40$30,000 to $39,999
- 26$40,000 to $49,999
- 33$50,000 to $59,999
- 104$60,000 to $74,999
- 75$75,000 to $99,999
- 34$100,000 to $124,999
- 33$125,000 to $149,999
- 15$150,000 to $199,999
- 46$200,000 or more
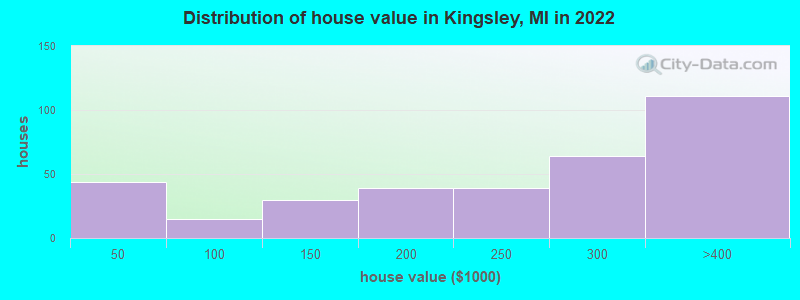
Home value of owner - occupied houses in 2022 in Kingsley, MI
-
- 13$10,000 to $14,999
- 3$15,000 to $19,999
- 17$20,000 to $24,999
- 4$30,000 to $34,999
- 4$35,000 to $39,999
- 1$40,000 to $49,999
- 2$70,000 to $79,999
- 6$80,000 to $89,999
- 4$90,000 to $99,999
- 14$100,000 to $124,999
- 15$125,000 to $149,999
- 8$150,000 to $174,999
- 30$175,000 to $199,999
- 38$200,000 to $249,999
- 63$250,000 to $299,999
- 111$300,000 to $399,999
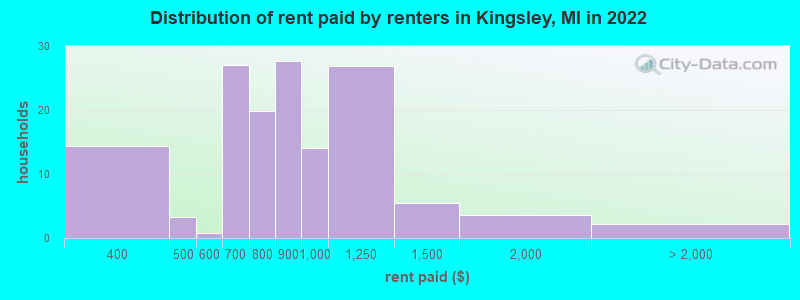
Rent paid by renters in 2022 in Kingsley, MI
-
- 5$300 to $349
- 8$350 to $399
- 3$450 to $499
- 0$550 to $599
- 26$600 to $649
- 19$700 to $749
- 27$800 to $899
- 14$900 to $999
- 26$1,000 to $1,249
- 5$1,250 to $1,499
- 3$1,500 to $1,999
- 2No cash rent
Percentage of workers working in this county: 93.4%
Number of people working at home: 73 (11.7% of all workers)
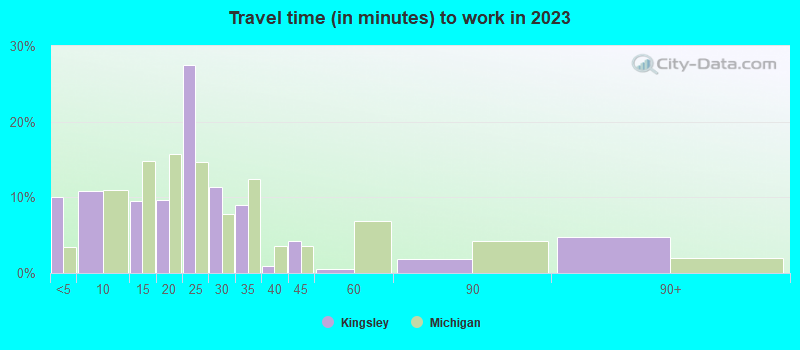
Travel time to work (commute)
- Less than 5 minutes: 6
- 5 to 9 minutes: 17
- 10 to 14 minutes: 5
- 15 to 19 minutes: 118
- 20 to 24 minutes: 84
- 25 to 29 minutes: 82
- 30 to 34 minutes: 126
- 35 to 39 minutes: 22
- 40 to 44 minutes: 22
- 45 to 59 minutes: 7
- 60 to 89 minutes: 10
- 90 or more minutes: 2
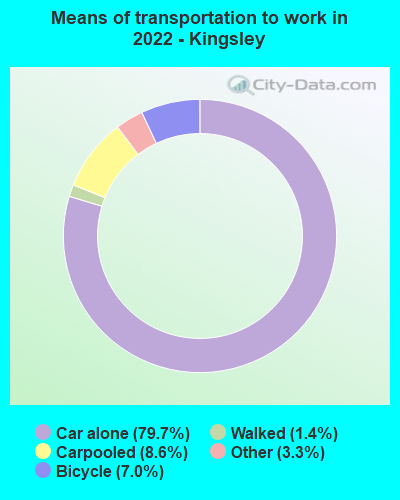
Means of transportation to work:
- Drove a car alone: 373 (69.2%)
- Carpooled: 32 (5.9%)
- Taxi: 33 (6.1%)
- Bicycle: 39 (7.2%)
- Walked: 7 (1.3%)
- Worked at home: 73 (13.5%)
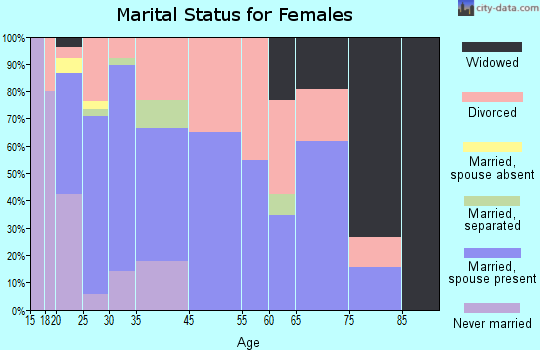
- Unemployment by race in 2022
- Unemployment rate for White non-Hispanic residents
- 5.0%Females
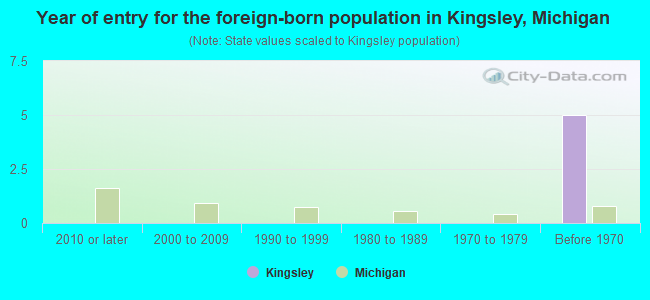
- Year of entry for the foreign-born population in Kingsley, Michigan
- 02010 or later
- 02000 to 2009
- 01990 to 1999
- 01980 to 1989
- 01970 to 1979
- 5Before 1970
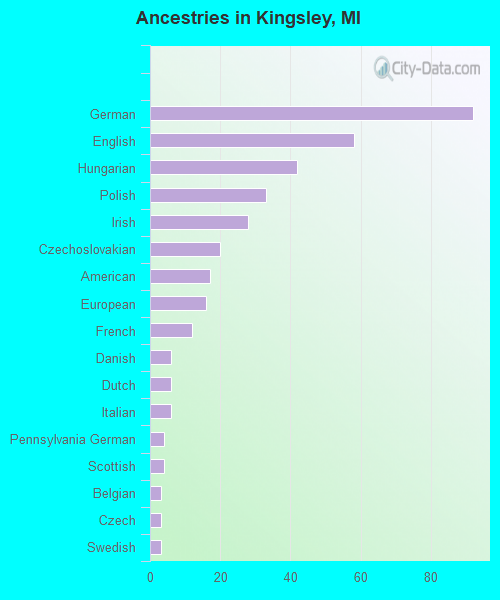
First ancestries reported:
- German: 92 (17.2%)
- English: 58 (10.9%)
- Hungarian: 42 (7.9%)
- Polish: 33 (6.2%)
- Irish: 28 (5.2%)
- Czechoslovakian: 20 (3.7%)
- American: 17 (3.2%)
- European: 16 (3.0%)
- French: 12 (2.2%)
- Danish: 6 (1.1%)
- Dutch: 6 (1.1%)
- Italian: 6 (1.1%)
- Pennsylvania German: 4 (0.7%)
- Scottish: 4 (0.7%)
- Belgian: 3 (0.6%)
- Czech: 3 (0.6%)
- Swedish: 3 (0.6%)
Most common places of birth for foreign-born residents (%):
| Kingsley: | 80.0% (4) |
| Michigan: | 5.0% (35,052) |
Place of birth for U.S.-born residents:
- This state: 1,345
- Other state: 476
- Northeast: 23
- Midwest: 52
- South: 160
- West: 253
73.4% of Kingsley residents lived in the same house 1 years ago.
Out of people who lived in different houses, 46.7% lived in this county.
Out of people who lived in different counties, 93.3% lived in Michigan.
| Kingsley: | 73.4% |
| State average: | 88.4% |
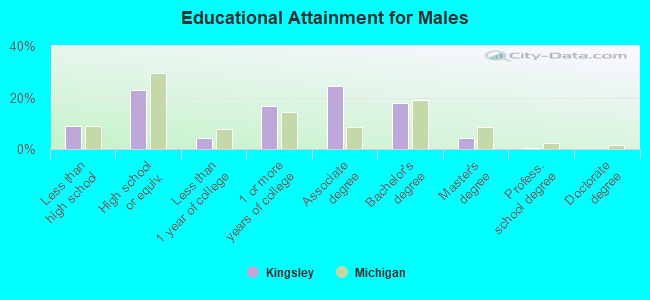
Education attainment for males 25 years and older:
- No schooling: 0
- Nursery to 4th grade: 0
- 5th and 6th grade: 0
- 7th and 8th grade: 0
- 9th grade: 0
- 10th grade: 2
- 11th grade: 23
- 12th grade, no diploma: 14
- High school graduate (or equivalency): 101
- Less than 1 year of college: 19
- Some college more than 1 year, no degree: 73
- Associate degree: 108
- Bachelor's degree: 79
- Master's degree: 18
- Professional school degree: 2
- Doctorate degree: 0
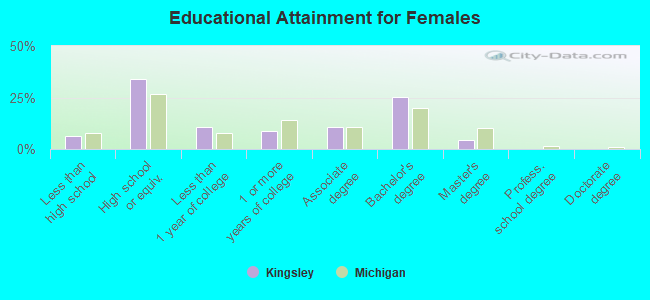
Education attainment for females 25 years and older:
- No schooling: 0
- Nursery to 4th grade: 0
- 5th and 6th grade: 0
- 7th and 8th grade: 0
- 9th grade: 0
- 10th grade: 11
- 11th grade: 6
- 12th grade, no diploma: 14
- High school graduate (or equivalency): 169
- Less than 1 year of college: 52
- Some college more than 1 year, no degree: 44
- Associate degree: 53
- Bachelor's degree: 126
- Master's degree: 22
- Professional school degree: 0
- Doctorate degree: 0
Housing units in structures:
- One, detached: 397
- One, attached: 5
- 5 to 9: 2
- 10 to 19: 20
- Mobile homes: 149
Median worth of mobile homes: $28,687
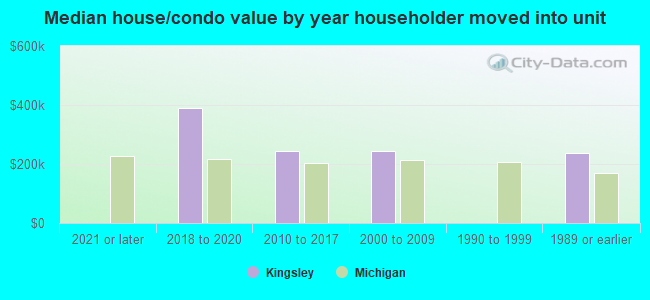
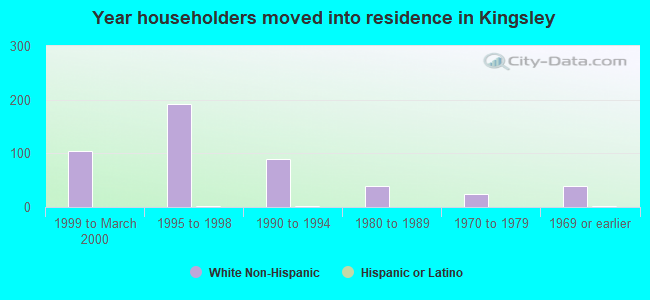
House/condo owner moved in on average 8 years ago
Renter moved in on average 3 years ago
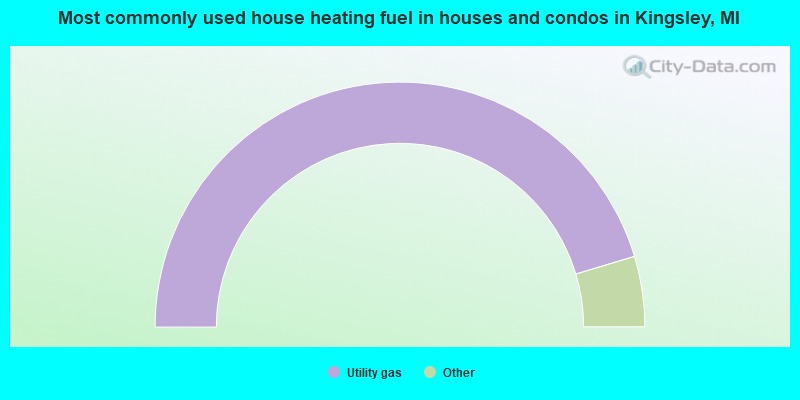
- 90.9%Utility gas
- 3.3%Wood
- 2.7%Fuel oil, kerosene, etc.
- 1.6%Bottled, tank, or LP gas
- 1.4%Electricity
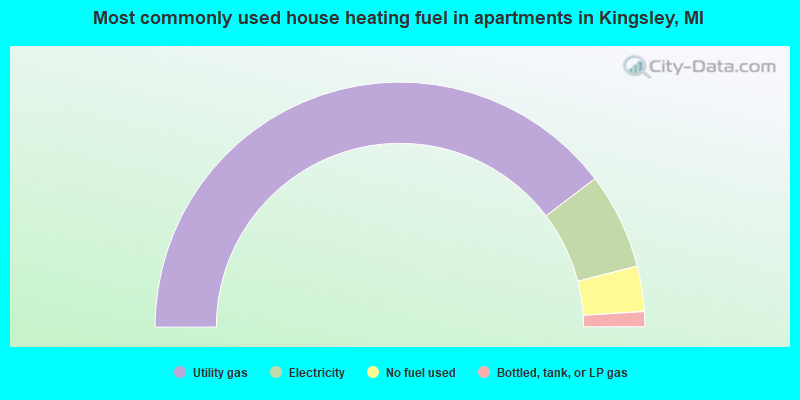
- 79.3%Utility gas
- 12.7%Electricity
- 6.0%No fuel used
- 2.0%Bottled, tank, or LP gas
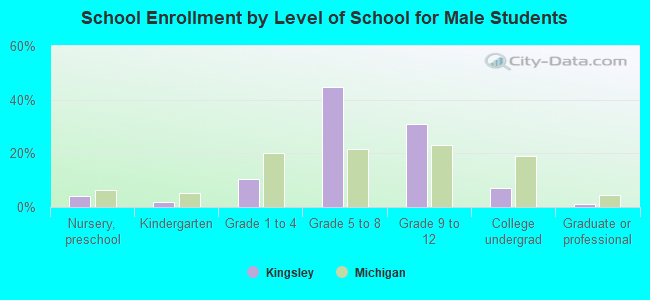
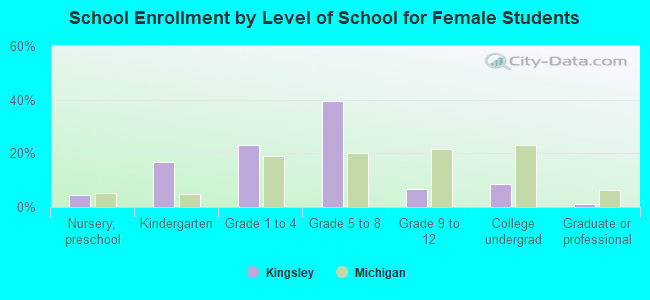
Private vs. public school enrollment:
| Here: | 2.6% |
| Michigan: | 12.4% |
| Here: | 0.0% |
| Michigan: | 9.8% |
| Here: | 5.6% |
| Michigan: | 14.9% |