Kirtland Hills, OH (Ohio) Houses and Residents
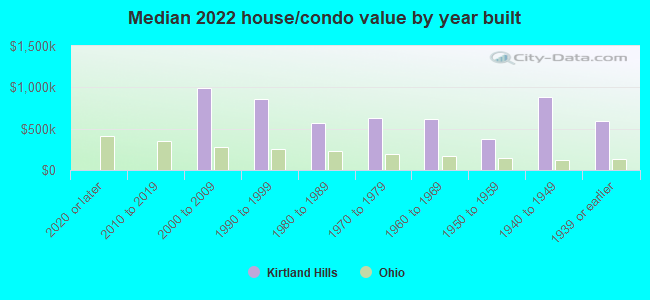
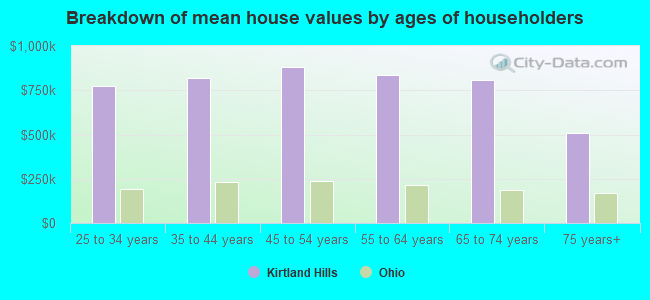
| Kirtland Hills: | $801,778 |
| Ohio: | $204,100 |
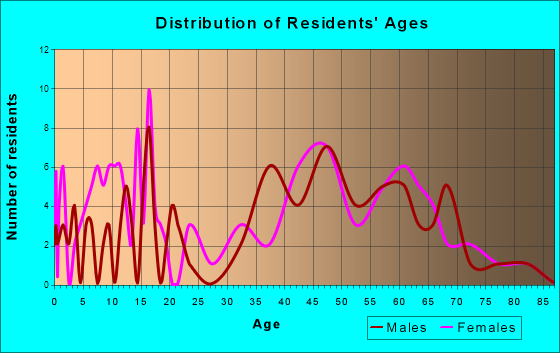
Total population: 643 (Urban population: 0, Rural population: 599 (6 farm, 593 nonfarm))
Houses: 232 (232 occupied: 225 owner occupied, 8 renter occupied)
| % of renters here: | 3% |
| State: | 33% |
Housing density: 42 houses/condos per square mile
Median price asked for vacant for-sale houses and condos in 2022 in this county: $108,108.
Median gross rent in Kirtland Hills, OH in 2022: $-641,350,210
Housing units in Kirtland Hills with a mortgage: 106 (15 second mortgage, 0 home equity loan, 13 both second mortgage and home equity loan)
Houses without a mortgage: 19
Median household income for houses/condos with a mortgage: $177,971
Median household income for apartments without a mortgage: $136,507
Median monthly housing costs: $1,969
Compare current foreclosures near Kirtland Hills, OH:
| Photo | Address | Area | Beds / Baths | Price | Details |
|---|---|---|---|---|---|

|
#1
Wellner Rd
Eastlake, OH 44095
|
1,030 sq. feet
|
2 baths 3 beds |
$194,900
|
show details |

|
#2
Creekwood Ln
Cleveland, OH 44143
|
4,154 sq. feet
|
3 baths 5 beds |
$425,900
|
show details |

|
#3
Mohegan Trl
Willoughby, OH 44094
|
1,044 sq. feet
|
1 baths 3 beds |
$199,500
|
show details |

|
#4
E 194th St
Cleveland, OH 44119
|
2,342 sq. feet
|
2 baths 4 beds |
$99,900
|
show details |

|
#5
Alton Rd
Wickliffe, OH 44092
|
936 sq. feet
|
1 baths 3 beds |
$164,900
|
show details |

|
#6
E 262nd St
Euclid, OH 44132
|
1,245 sq. feet
|
3 baths 4 beds |
$209,900
|
show details |

|
#7
65 Noble Rd
Cleveland, OH 44112
|
- sq. feet
|
2 baths 4 beds |
$29,900
|
show details |

|
#8
Cleveland Rd
Cleveland, OH 44108
|
2,088 sq. feet
|
2 baths 4 beds |
show details | |

|
#9
Rockefeller Rd
Wickliffe, OH 44092
|
1,622 sq. feet
|
2 baths 3 beds |
show details | |

|
#10
Washington Blvd
Cleveland, OH 44118
|
2,005 sq. feet
|
4 baths 4 beds |
show details |
| Photo | Address | Area | Beds / Baths | Price | Details |
|---|---|---|---|---|---|

|
#11
Kennedy Dr
Wickliffe, OH 44092
|
1,392 sq. feet
|
1 baths 3 beds |
show details | |

|
#12
Locherie Ave
Cleveland, OH 44119
|
1,324 sq. feet
|
1 baths 3 beds |
show details | |

|
#13
Walden Rd
Cleveland, OH 44112
|
2,133 sq. feet
|
3 baths 4 beds |
show details | |

|
#14
Faversham Rd
Cleveland, OH 44118
|
2,118 sq. feet
|
1 baths 3 beds |
show details | |

|
#15
Primrose Dr
Mentor, OH 44060
|
1,232 sq. feet
|
1 baths 3 beds |
show details | |

|
#16
Monticello Blvd
Cleveland, OH 44121
|
1,784 sq. feet
|
1 baths 4 beds |
show details | |

|
#17
Plymouth Rd
Eastlake, OH 44095
|
1,377 sq. feet
|
1 baths 3 beds |
show details | |

|
#18
Knowles St
Cleveland, OH 44112
|
1,937 sq. feet
|
1 baths 4 beds |
show details | |

|
#19
Berkshire Rd
Cleveland, OH 44118
|
1,690 sq. feet
|
2 baths 4 beds |
show details | |

|
#20
Berkshire Rd
Cleveland, OH 44118
|
1,690 sq. feet
|
1 baths 4 beds |
show details |
| Photo | Address | Area | Beds / Baths | Price | Details |
|---|---|---|---|---|---|

|
#21
Chestnut St
Painesville, OH 44077
|
814 sq. feet
|
1 baths 2 beds |
show details | |

|
#22
Shoreview Ave
Euclid, OH 44123
|
1,392 sq. feet
|
2 baths 4 beds |
show details | |

|
#23
Somerton Rd
Cleveland, OH 44118
|
1,260 sq. feet
|
2 baths 6 beds |
show details | |

|
#24
Taylor Rd
Cleveland, OH 44112
|
1,344 sq. feet
|
2 baths 4 beds |
show details | |

|
#25
Henderson Rd
Cleveland, OH 44112
|
1,327 sq. feet
|
1 baths 3 beds |
show details | |

|
#26
Genesee Rd
Euclid, OH 44117
|
1,248 sq. feet
|
1 baths 3 beds |
show details | |

|
#27
Ellison Rd
Cleveland, OH 44121
|
1,498 sq. feet
|
1 baths 3 beds |
show details | |

|
#28
Genesee Rd
Euclid, OH 44117
|
- sq. feet
|
2 baths 4 beds |
show details | |

|
#29
E 165th St
Cleveland, OH 44110
|
1,728 sq. feet
|
2 baths 4 beds |
show details | |

|
#30
S Green Rd
Cleveland, OH 44121
|
1,096 sq. feet
|
1 baths 3 beds |
show details |
| Photo | Address | Area | Beds / Baths | Price | Details |
|---|---|---|---|---|---|

|
#31
Homewood Dr
Wickliffe, OH 44092
|
1,328 sq. feet
|
1 baths 3 beds |
show details | |

|
#32
Lucknow Ave
Cleveland, OH 44110
|
1,970 sq. feet
|
2 baths 4 beds |
show details | |

|
#33
S Noble Rd
Cleveland, OH 44121
|
1,020 sq. feet
|
1 baths 3 beds |
show details | |

|
#34
Glenfield Rd
Cleveland, OH 44119
|
- sq. feet
|
- baths - beds |
$34,900
|
show details |

|
#35
Helmsdale Rd
Cleveland, OH 44112
|
1,316 sq. feet
|
1 baths 3 beds |
show details | |

|
#36
Drakefield Ave
Euclid, OH 44132
|
1,241 sq. feet
|
2 baths 4 beds |
show details | |

|
#37
Brooksdale Rd
Mentor, OH 44060
|
696 sq. feet
|
1 baths 2 beds |
show details | |

|
#38
Landseer Rd
Cleveland, OH 44119
|
1,622 sq. feet
|
1 baths 4 beds |
show details | |

|
#39
King St
Painesville, OH 44077
|
722 sq. feet
|
1 baths 2 beds |
show details | |

|
#40
Greyton Rd
Cleveland, OH 44112
|
1,670 sq. feet
|
1 baths 3 beds |
show details |
| Photo | Address | Area | Beds / Baths | Price | Details |
|---|---|---|---|---|---|

|
#41
Akron St
Chagrin Falls, OH 44023
|
1,228 sq. feet
|
1 baths 3 beds |
show details | |

|
#42
Ashley Cir
Cleveland, OH 44143
|
4,187 sq. feet
|
4 baths 5 beds |
show details | |

|
#43
E 146th St
Cleveland, OH 44110
|
1,091 sq. feet
|
1 baths 3 beds |
show details | |

|
#44
Wilmore Ave
Euclid, OH 44123
|
1,356 sq. feet
|
1 baths 3 beds |
show details | |

|
#45
E 236th St
Euclid, OH 44123
|
4,608 sq. feet
|
4 baths 6 beds |
show details | |

|
#46
Osceola Ave
Cleveland, OH 44108
|
2,395 sq. feet
|
2 baths 4 beds |
show details | |

|
#47
Thornwood Ave
Cleveland, OH 44108
|
1,228 sq. feet
|
1 baths 3 beds |
show details | |

|
#48
Station St
Mentor, OH 44060
|
1,062 sq. feet
|
1 baths 2 beds |
show details | |

|
#49
Chatworth Dr
Euclid, OH 44117
|
1,434 sq. feet
|
2 baths 3 beds |
show details | |

|
Check over 1 million property listings on Foreclosure.com!
|
browse all offers | |||


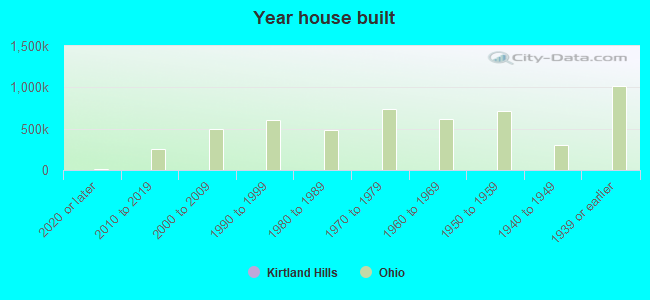
Median year apartment built: 1939
Household type by relationship:
Households: 676- Male householders: 129 (8 living alone), Female householders: 99 (25 living alone)
166 spouses (166 opposite-sex spouses), 0 unmarried partners, (0 opposite-sex unmarried partners), 267 children (265 natural, 0 adopted, 1 stepchildren), 0 grandchildren, 0 brothers or sisters, 6 parents, 0 foster children, 1 other relatives, 3 non-relatives
Size of family households: 73 2-persons, 56 3-persons, 34 4-persons, 15 5-persons, 1 7-or-more-persons.
Size of nonfamily households: 37 1-person, 1 2-persons.
125 married couples with children.
38 single-parent households (21 men, 17 women).
83.8% of residents of Kirtland Hills speak English at home.
5.7% of residents speak Spanish at home (86% speak English very well, 14% speak English well).
9.6% of residents speak other Indo-European language at home (95% speak English very well, 5% speak English well).
0.5% of residents speak Asian or Pacific Island language at home (100% speak English well).
0.5% of residents speak other language at home (100% speak English very well).
Foreign born population: 45 (6.7%)
(102.2% of them are naturalized citizens)
| Here: | 9.7 |
| State: | 6.7 |
| Here: | 5.1 |
| State: | 4.4 |
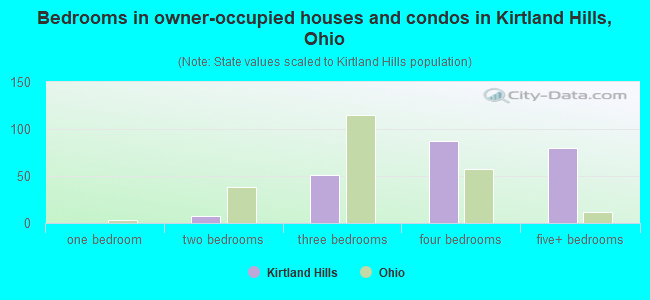
- Bedrooms in owner-occupied houses and condos in Kirtland Hills, Ohio
- 0no bedroom
- 01 bedroom
- 72 bedrooms
- 513 bedrooms
- 874 bedrooms
- 805+ bedrooms
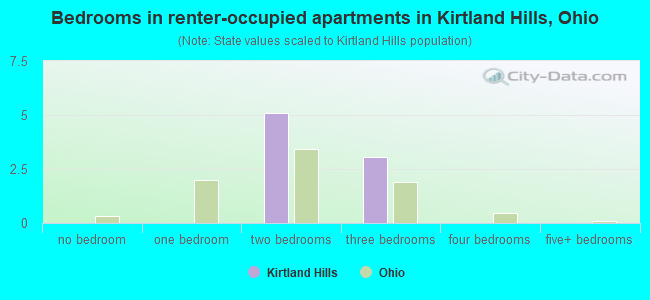
- Bedrooms in renter-occupied apartments in Kirtland Hills, Ohio
- 0no bedroom
- 01 bedroom
- 52 bedrooms
- 33 bedrooms
- 04 bedrooms
- 05+ bedrooms
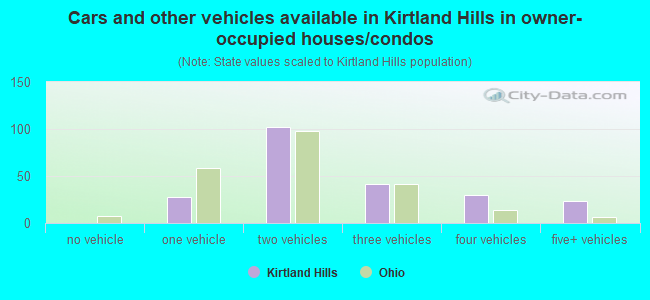
- Cars and other vehicles available in Kirtland Hills in owner-occupied houses/condos
- 0no vehicle
- 281 vehicle
- 1022 vehicles
- 423 vehicles
- 304 vehicles
- 235+ vehicles
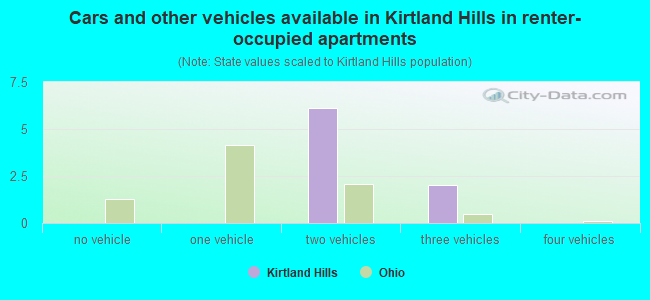
- Cars and other vehicles available in Kirtland Hills in renter-occupied apartments
- 0no vehicle
- 01 vehicle
- 62 vehicles
- 23 vehicles
- 04 vehicles
- 05+ vehicles
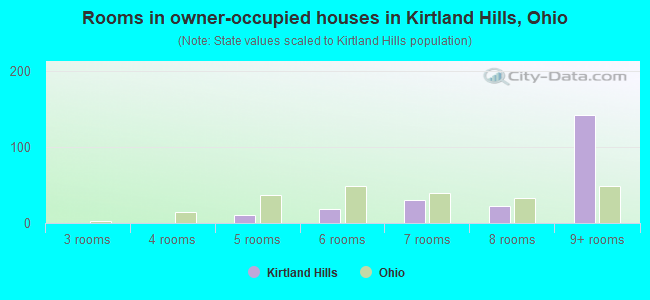
- Rooms in owner-occupied houses in Kirtland Hills, Ohio
- 01 room
- 02 rooms
- 03 rooms
- 04 rooms
- 105 rooms
- 196 rooms
- 307 rooms
- 238 rooms
- 1429+ rooms
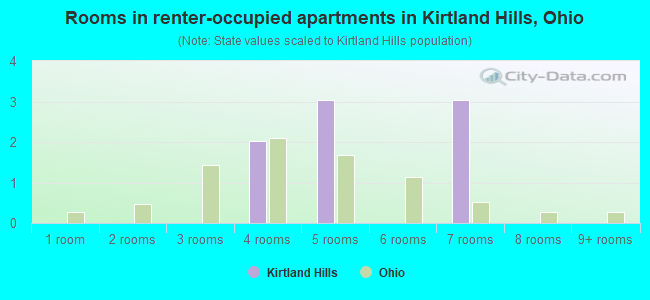
- Rooms in renter-occupied apartments in Kirtland Hills, Ohio
- 01 room
- 02 rooms
- 03 rooms
- 24 rooms
- 35 rooms
- 06 rooms
- 37 rooms
- 08 rooms
- 09+ rooms
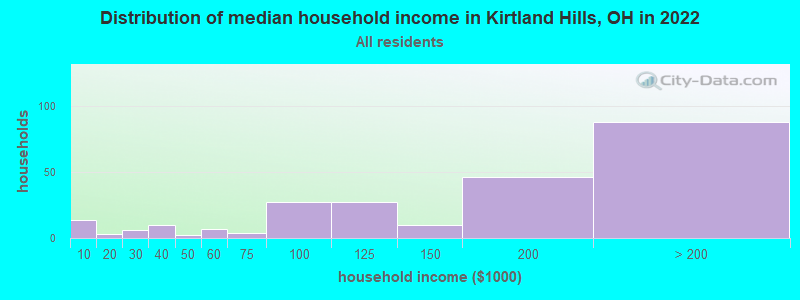
Kirtland Hills, OH household income distribution

- 14Less than $10,000
- 3$10,000 to $19,999
- 6$20,000 to $29,999
- 10$30,000 to $39,999
- 2$40,000 to $49,999
- 7$50,000 to $59,999
- 4$60,000 to $74,999
- 27$75,000 to $99,999
- 27$100,000 to $124,999
- 10$125,000 to $149,999
- 46$150,000 to $199,999
- 88$200,000 or more
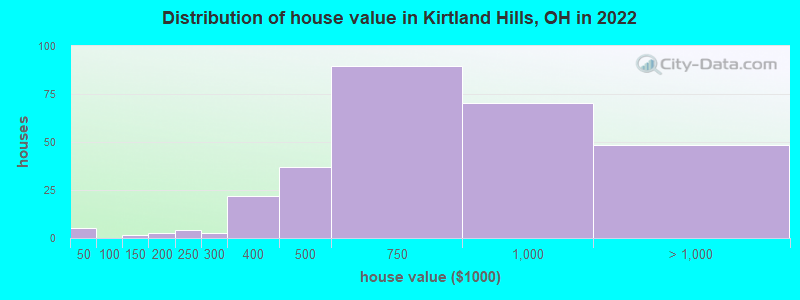
Home value of owner - occupied houses in 2022 in Kirtland Hills, OH
-
- 5Less than $10,000
- 1$125,000 to $149,999
- 2$175,000 to $199,999
- 4$200,000 to $249,999
- 2$250,000 to $299,999
- 21$300,000 to $399,999
- 36$400,000 to $499,999
- 89$500,000 to $749,999
- 70$750,000 to $999,999
- 34$1,000,000 to $1,499,999
- 6$1,500,000 to $1,999,999
- 7$2,000,000 or more
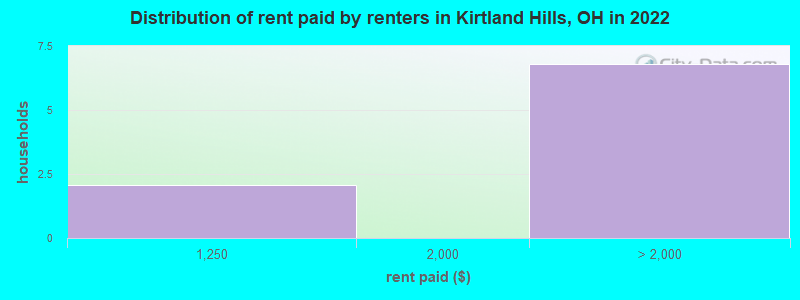
Rent paid by renters in 2022 in Kirtland Hills, OH
-
- 2$1,000 to $1,249
- 4$2,000 to $2,499
- 2No cash rent
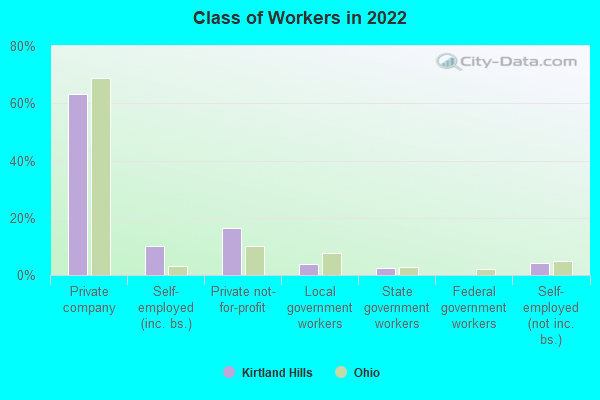
Percentage of workers working in this county: 66.2%
Number of people working at home: 52 (16.4% of all workers)
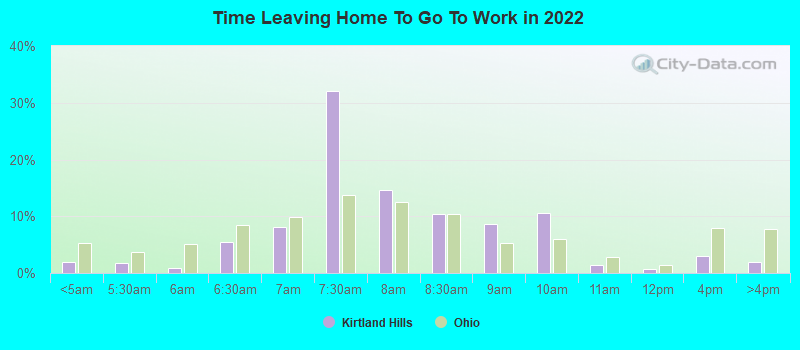
Travel time to work (commute)
- Less than 5 minutes: 5
- 5 to 9 minutes: 34
- 10 to 14 minutes: 35
- 15 to 19 minutes: 74
- 20 to 24 minutes: 38
- 25 to 29 minutes: 7
- 30 to 34 minutes: 28
- 35 to 39 minutes: 1
- 40 to 44 minutes: 2
- 45 to 59 minutes: 31
- 60 to 89 minutes: 0
- 90 or more minutes: 1
Means of transportation to work:
- Drove a car alone: 247 (81.0%)
- Carpooled: 29 (9.5%)
- Bus or trolley bus: 2 (0.7%)
- Walked: 2 (0.7%)
- Worked at home: 25 (8.2%)
- Unemployment by race in 2022
- Unemployment rate for White non-Hispanic residents
- 1.4%Males
- 3.0%Females
- Unemployment rate for two or more race residents
- 17.8%Males
- 25.1%Females
- Unemployment rate for Hispanic or Latino residents
- 28.4%Males
- 21.2%Females
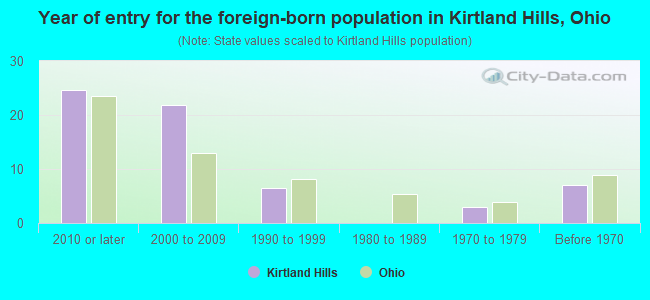
- Year of entry for the foreign-born population in Kirtland Hills, Ohio
- 252010 or later
- 222000 to 2009
- 61990 to 1999
- 01980 to 1989
- 31970 to 1979
- 7Before 1970
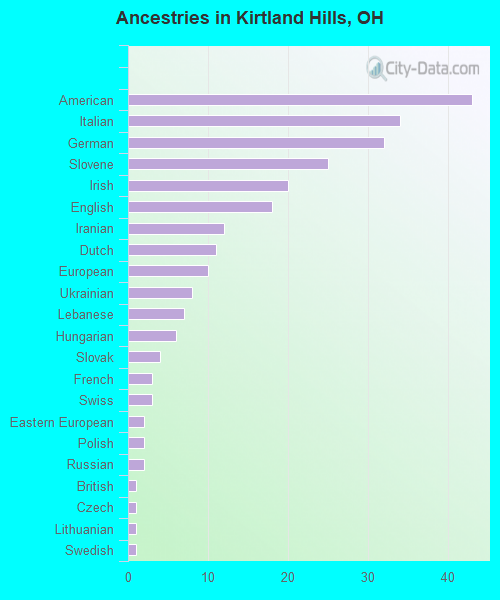
First ancestries reported:
- American: 43 (14.5%)
- Italian: 34 (11.5%)
- German: 32 (10.8%)
- Slovene: 25 (8.4%)
- Irish: 20 (6.7%)
- English: 18 (6.1%)
- Iranian: 12 (4.0%)
- Dutch: 11 (3.7%)
- European: 10 (3.4%)
- Ukrainian: 8 (2.7%)
- Lebanese: 7 (2.4%)
- Hungarian: 6 (2.0%)
- Slovak: 4 (1.3%)
- French: 3 (1.0%)
- Swiss: 3 (1.0%)
- Eastern European: 2 (0.7%)
- Polish: 2 (0.7%)
- Russian: 2 (0.7%)
- British: 1 (0.3%)
- Czech: 1 (0.3%)
- Lithuanian: 1 (0.3%)
- Swedish: 1 (0.3%)
Most common places of birth for foreign-born residents (%):
| Kirtland Hills: | 15.5% (9) |
| Ohio: | 0.3% (1,793) |
| Kirtland Hills: | 13.8% (8) |
| Ohio: | 0.6% (3,552) |
| Kirtland Hills: | 12.1% (7) |
| Ohio: | 1.2% (6,679) |
| Kirtland Hills: | 8.6% (5) |
| Ohio: | 0.7% (3,722) |
| Kirtland Hills: | 8.6% (5) |
| Ohio: | 0.7% (3,862) |
| Kirtland Hills: | 8.6% (5) |
| Ohio: | 0.9% (5,101) |
| Kirtland Hills: | 5.2% (3) |
| Ohio: | 1.7% (9,564) |
| Kirtland Hills: | 5.2% (3) |
| Ohio: | 0.7% (3,864) |
| Kirtland Hills: | 5.2% (3) |
| Ohio: | 7.8% (44,796) |
| Kirtland Hills: | 3.4% (2) |
| Ohio: | 2.2% (12,846) |
Place of birth for U.S.-born residents:
- This state: 498
- Other state: 121
- Northeast: 47
- Midwest: 26
- South: 19
- West: 34
88.9% of Kirtland Hills residents lived in the same house 1 years ago.
Out of people who lived in different houses, 23.9% lived in this county.
Out of people who lived in different counties, 56.0% lived in Ohio.
| Kirtland Hills: | 88.9% |
| State average: | 87.8% |
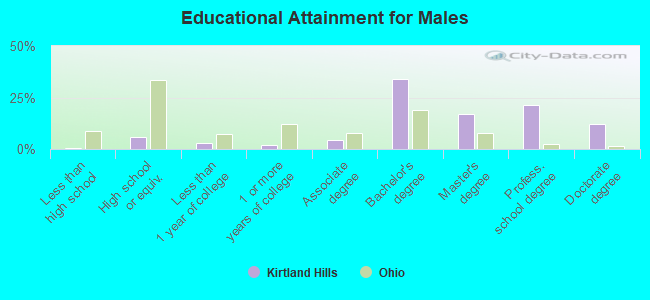
Education attainment for males 25 years and older:
- No schooling: 0
- Nursery to 4th grade: 0
- 5th and 6th grade: 1
- 7th and 8th grade: 0
- 9th grade: 0
- 10th grade: 0
- 11th grade: 0
- 12th grade, no diploma: 0
- High school graduate (or equivalency): 13
- Less than 1 year of college: 6
- Some college more than 1 year, no degree: 4
- Associate degree: 10
- Bachelor's degree: 75
- Master's degree: 37
- Professional school degree: 47
- Doctorate degree: 27
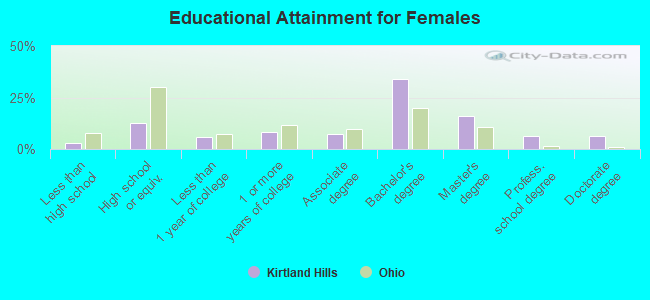
Education attainment for females 25 years and older:
- No schooling: 0
- Nursery to 4th grade: 1
- 5th and 6th grade: 0
- 7th and 8th grade: 1
- 9th grade: 0
- 10th grade: 0
- 11th grade: 5
- 12th grade, no diploma: 0
- High school graduate (or equivalency): 29
- Less than 1 year of college: 13
- Some college more than 1 year, no degree: 19
- Associate degree: 17
- Bachelor's degree: 77
- Master's degree: 36
- Professional school degree: 14
- Doctorate degree: 14
Housing units in structures:
- One, detached: 228
- 3 or 4: 3
- 5 to 9: 1
Housing units lacking complete kitchen facilities in 2022: 0.4%
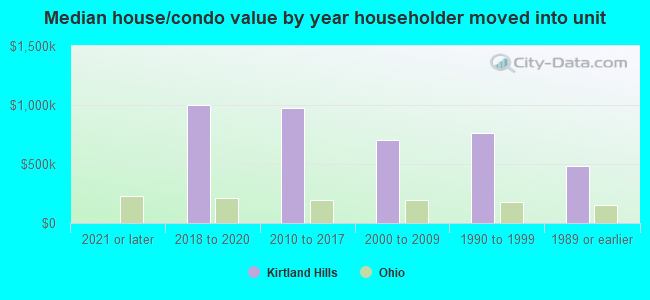
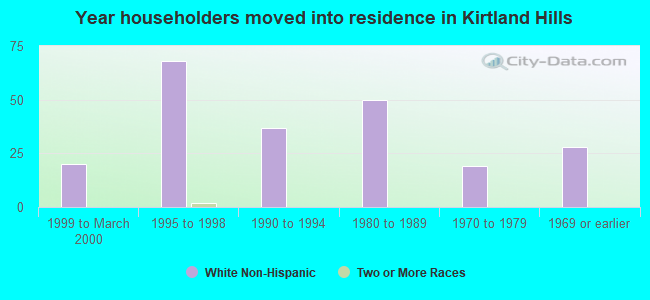
House/condo owner moved in on average 16 years ago
Renter moved in on average 23 years ago
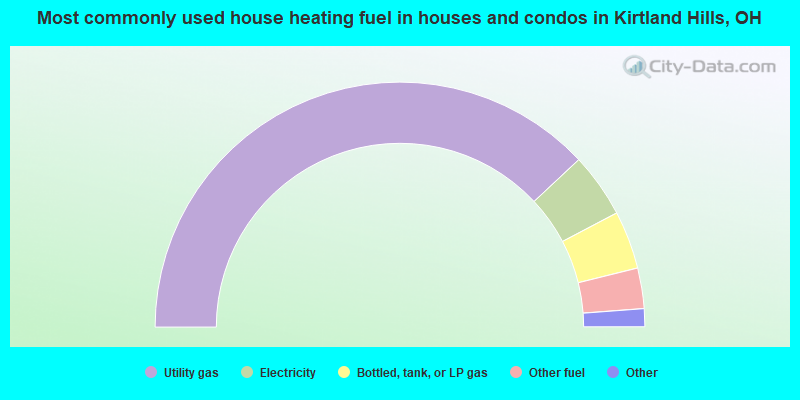
- 76.6%Utility gas
- 8.6%Electricity
- 7.7%Bottled, tank, or LP gas
- 5.4%Other fuel
- 1.4%Fuel oil, kerosene, etc.
- 0.5%Coal or coke
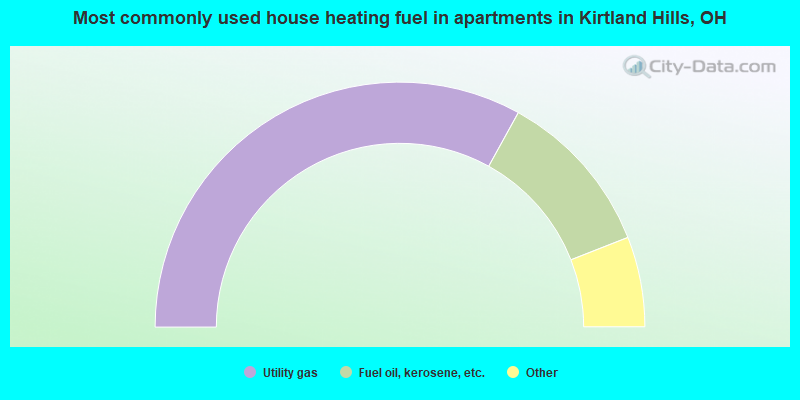
- 75.0%Utility gas
- 25.0%Fuel oil, kerosene, etc.
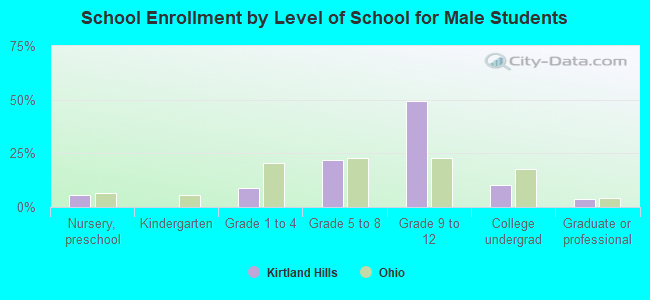
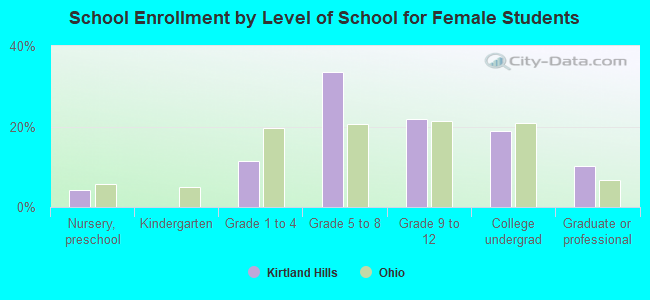
Private vs. public school enrollment:
| Here: | 56.1% |
| Ohio: | 16.0% |
| Here: | 40.0% |
| Ohio: | 13.1% |
| Here: | 53.6% |
| Ohio: | 22.3% |