Knightdale, NC (North Carolina) Houses and Residents
Estimated median house or condo value in 2022: $372,509 (it was $132,600 in 2000 )
Knightdale:
$372,509North Carolina:
$280,600
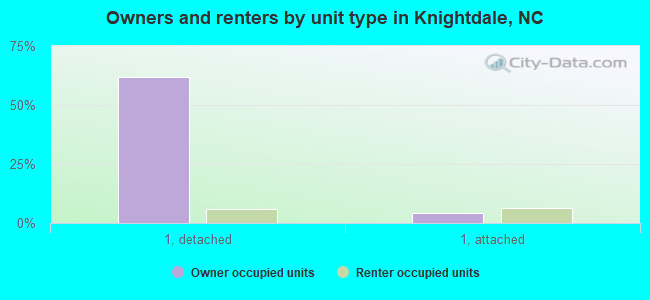
Lower value quartile - upper value quartile: $287,047 - $459,939Mean price in 2022: Detached houses: $374,119 Here:
$374,119State:
$375,326
Townhouses or other attached units: $259,050 Here:
$259,050State:
$317,935
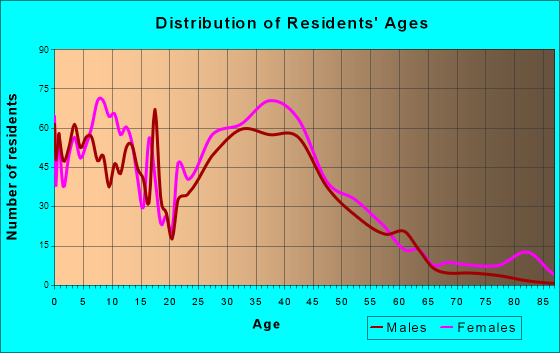
Total population: 13,871 (Urban population: 6,013, Rural population: 4 (all nonfarm) )
Houses: 8,151 (7,857 occupied: 5,038 owner occupied, 2,656 renter occupied )
% of renters here:
35%State:
33%
Housing density: 3,041 houses/condos per square mile
Median price asked for vacant for-sale houses and condos in 2022: $506,909.
Median contract rent in 2022: $1,271 (lower quartile is $1,067, upper quartile is $1,570)
Median rent asked for vacant for-rent units in 2022: $1,749
Median gross rent in Knightdale, NC in 2022: $1,456
Housing units in Knightdale with a mortgage: 4,162 (233 second mortgage, 0 home equity loan, 186 both second mortgage and home equity loan )Houses without a mortgage: 286
Median household income for houses/condos with a mortgage: $113,214
Median household income for apartments without a mortgage: $65,941
Median monthly housing costs: $1,466
Data:
Median house or condo value ($)
Median house or condo value ($ change since 2000)
Median house or condo value ($) - White
Median house or condo value ($) - Black or African American
Median house or condo value ($) - Asian
Median house or condo value ($) - Hispanic or Latino
Median house or condo value ($) - American Indian and Alaska Native
Median house or condo value ($) - Multirace
Median house or condo value ($) - Other Race
Median price asked for mobile homes ($)
Household density (households per square mile)
Mean house or condo value by units in structure - 1, detached ($)
Mean house or condo value by units in structure - 1, attached ($)
Mean house or condo value by units in structure - 2 ($)
Mean house or condo value by units in structure by units in structure - 3 or 4 ($)
Mean house or condo value by units in structure - 5 or more ($)
Mean house or condo value by units in structure - Boat, RV, van, etc. ($)
Mean house or condo value by units in structure - Mobile home ($)
Median contract rent ($)
Median contract rent - Lower quartile ($)
Median contract rent - Upper quartile ($)
Median gross rent ($)
Urban houses (%)
Rural houses (%)
Houses occupied (%)
Houses occupied (% change since 2000)
Houses owner occupied (%)
Houses owner occupied (% change since 2000)
Houses renter occupied (%)
Houses renter occupied (% change since 2000)
Vacant housing units - For rent (%)
Vacant housing units - For rent (% change since 2000)
Vacant housing units - For sale only (%)
Vacant housing units - For sale only (% change since 2000)
Vacant housing units - Rented or sold, not occupied (%)
Vacant housing units - Rented or sold, not occupied (% change since 2000)
Vacant housing units - For seasonal, recreational, or occasional use (%)
Vacant housing units - For seasonal, recreational, or occasional use (% change since 2000)
Vacant housing units - For migrant workers (%)
Vacant housing units - For migrant workers (% change since 2000)
Vacant housing units - Other vacant (%)
Vacant housing units - Other vacant (% change since 2000)
Median monthly housing costs ($)
Median household income for houses/condos with a mortgage ($)
Median household income for houses/condos without a mortgage ($)
Median household income ($)
Median household income ($) - White
Median household income ($) - Black or African American
Median household income ($) - Asian
Median household income ($) - Hispanic or Latino
Median household income ($) - American Indian and Alaska Native
Median household income ($) - Multirace
Median household income ($) - Other Race
Mortgage status - with mortgage (%)
Mortgage status - with second mortgage (%)
Mortgage status - with home equity loan (%)
Mortgage status - with both second mortgage and home equity loan (%)
Mortgage status - without a mortgage (%)
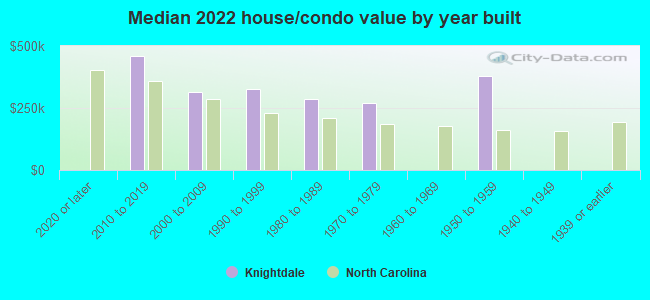
Median year house/condo built
Median year apartment built
Household type by relationship - Male householder living alone (%)
Household type by relationship - Male householder not living alone (%)
Household type by relationship - Female householder living alone (%)
Household type by relationship - Female householder not living alone (%)
Household type by relationship - Opposite-Sex spouse (%)
Household type by relationship - Same-Sex spouse (%)
Household type by relationship - Opposite-Sex unmarried partner (%)
Household type by relationship - Same-Sex unmarried partner (%)
Household type by relationship - In group quarters (%)
Size of family households - 2-person household (%)
Size of family households - 3-person household (%)
Size of family households - 4-person household (%)
Size of family households - 5-person household (%)
Size of family households - 6-person household (%)
Size of family households - 7-or-more-person household (%)
Size of nonfamily households - 1-person household (%)
Size of nonfamily households - 2-person household (%)
Size of nonfamily households - 3-person household (%)
Size of nonfamily households - 4-person household (%)
Size of nonfamily households - 5-person household (%)
Size of nonfamily households - 6-person household (%)
Size of nonfamily households - 7-or-moreperson household (%)
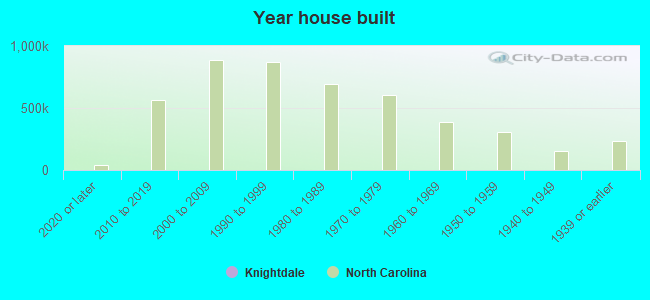
Year house built - Built 2010 or later (%)
Year house built - Built 2000 to 2009 (%)
Year house built - Built 1990 to 1999 (%)
Year house built - Built 1980 to 1989 (%)
Year house built - Built 1970 to 1979 (%)
Year house built - Built 1960 to 1969 (%)
Year house built - Built 1950 to 1959 (%)
Year house built - Built 1940 to 1949 (%)
Year house built - Built 1939 or earlier (%)
Median number of rooms in houses and condos
Median number of rooms in apartments
Median number of bedrooms in owner occupied houses
Mean number of bedrooms in owner occupied houses
Median number of bedrooms in renter occupied houses
Mean number of bedrooms in renter occupied houses
Median number of vehichles in owner occupied houses
Mean number of vehichles in owner occupied houses
Median number of vehichles in renter occupied houses
Mean number of vehichles in renter occupied houses
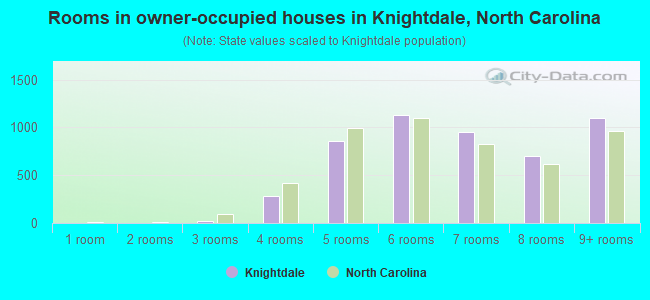
Rooms in owner-occupied houses - 1 room (%)
Rooms in owner-occupied houses - 2 rooms (%)
Rooms in owner-occupied houses - 3 rooms (%)
Rooms in owner-occupied houses - 4 rooms (%)
Rooms in owner-occupied houses - 5 rooms (%)
Rooms in owner-occupied houses - 6 rooms (%)
Rooms in owner-occupied houses - 7 rooms (%)
Rooms in owner-occupied houses - 8 rooms (%)
Rooms in owner-occupied houses - 9+ rooms (%)
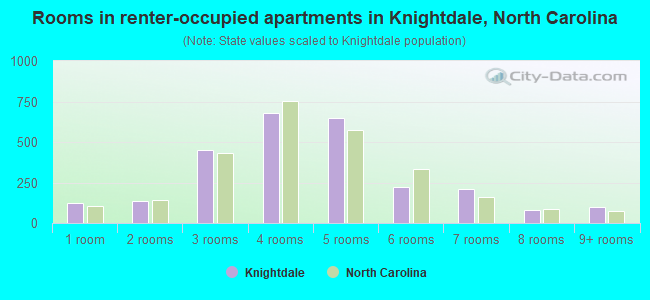
Rooms in renter-occupied houses - 1 room (%)
Rooms in renter-occupied houses - 2 rooms (%)
Rooms in renter-occupied houses - 3 rooms (%)
Rooms in renter-occupied houses - 4 rooms (%)
Rooms in renter-occupied houses - 5 rooms (%)
Rooms in renter-occupied houses - 6 rooms (%)
Rooms in renter-occupied houses - 7 rooms (%)
Rooms in renter-occupied houses - 8 rooms (%)
Rooms in renter-occupied houses - 9+ rooms (%)
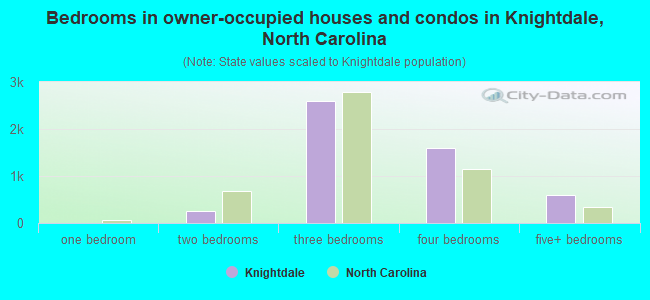
Bedrooms in owner-occupied houses - no bedrooms (%)
Bedrooms in owner-occupied houses - 1 bedroom (%)
Bedrooms in owner-occupied houses - 2 bedrooms (%)
Bedrooms in owner-occupied houses - 3 bedrooms (%)
Bedrooms in owner-occupied houses - 4 bedrooms (%)
Bedrooms in owner-occupied houses - 5+ bedrooms (%)
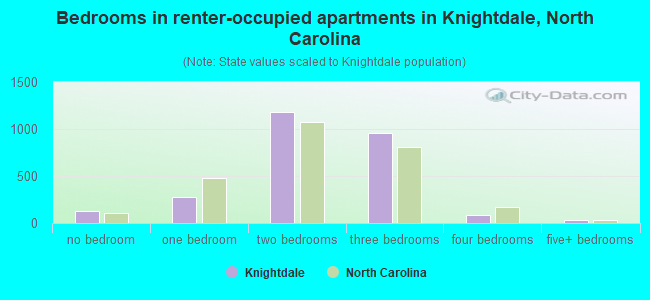
Bedrooms in renter-occupied houses - no bedrooms (%)
Bedrooms in renter-occupied houses - 1 bedroom (%)
Bedrooms in renter-occupied houses - 2 bedrooms (%)
Bedrooms in renter-occupied houses - 3 bedrooms (%)
Bedrooms in renter-occupied houses - 4 bedrooms (%)
Bedrooms in renter-occupied houses - 5+ bedrooms (%)
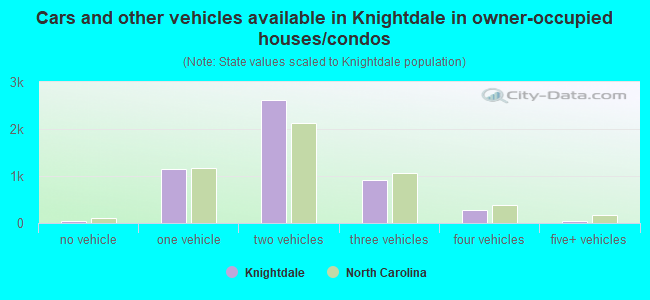
Vehicles available in owner-occupied houses - no vehicle available (%)
Vehicles available in owner-occupied houses - 1 vehicle available(%)
Vehicles available in owner-occupied houses - 2 Vehicles available (%)
Vehicles available in owner-occupied houses - 3 Vehicles available (%)
Vehicles available in owner-occupied houses - 4 Vehicles available (%)
Vehicles available in owner-occupied houses - 5+ Vehicles available (%)
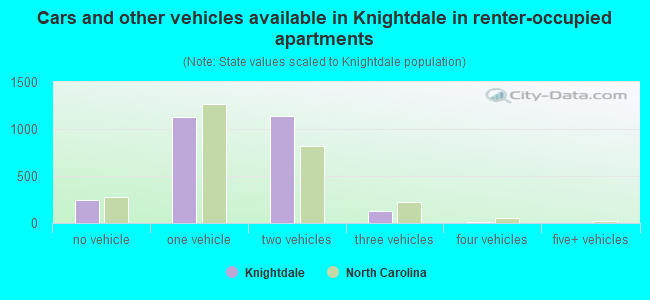
Vehicles available in renter-occupied houses - no vehicle available (%)
Vehicles available in renter-occupied houses - 1 vehicle available (%)
Vehicles available in renter-occupied houses - 2 Vehicles available (%)
Vehicles available in renter-occupied houses - 3 Vehicles available (%)
Vehicles available in renter-occupied houses - 4 Vehicles available (%)
Vehicles available in renter-occupied houses - 5+ Vehicles available (%)
Housing units in structures - 1, detached (%)
Housing units in structures - 1, attached (%)
Housing units in structures - 2 (%)
Housing units in structures - 3 or 4 (%)
Housing units in structures - 5 to 9 (%)
Housing units in structures - 10 to 19 (%)
Housing units in structures - 20 to 49 (%)
Housing units in structures - 50 or more (%)
Housing units in structures - Mobile home (%)
Housing units in structures - Boat, RV, van, etc. (%)
Housing units in structures - Owners - 1, detached (%)
Housing units in structures - Owners - 1, attached (%)
Housing units in structures - Owners - 2 (%)
Housing units in structures - Owners - 3 or 4 (%)
Housing units in structures - Owners - 5 to 9 (%)
Housing units in structures - Owners - 10 to 19 (%)
Housing units in structures - Owners - 20 to 49 (%)
Housing units in structures - Owners - 50 or more (%)
Housing units in structures - Owners - Mobile home (%)
Housing units in structures - Owners - Boat, RV, van, etc. (%)
Housing units in structures - Renters - 1, detached (%)
Housing units in structures - Renters - 1, attached (%)
Housing units in structures - Renters - 2 (%)
Housing units in structures - Renters - 3 or 4 (%)
Housing units in structures - Renters - 5 to 9 (%)
Housing units in structures - Renters - 10 to 19 (%)
Housing units in structures - Renters - 20 to 49 (%)
Housing units in structures - Renters - 50 or more (%)
Housing units in structures - Renters - Mobile home (%)
Housing units in structures - Renters - Boat, RV, van, etc. (%)
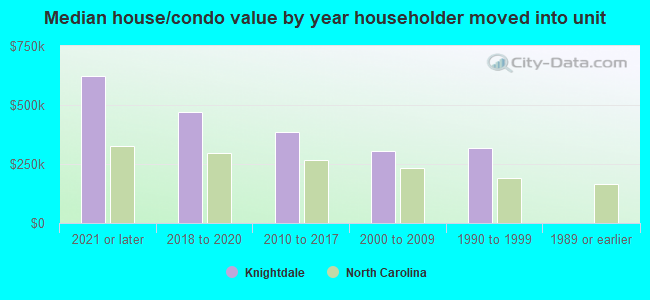
House/condo owner moved in on average (years ago)
Renter moved in on average (years ago)
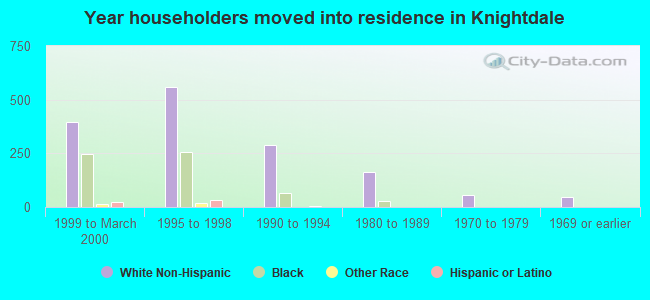
Year householder moved into unit - Moved in 1999 to March 2000 (%)
Year householder moved into unit - Moved in 1999 to March 2000 (%) - White
Year householder moved into unit - Moved in 1999 to March 2000 (%) - Black or African American
Year householder moved into unit - Moved in 1999 to March 2000 (%) - Asian
Year householder moved into unit - Moved in 1999 to March 2000 (%) - Hispanic or Latino
Year householder moved into unit - Moved in 1999 to March 2000 (%) - American Indian and Alaska Native
Year householder moved into unit - Moved in 1999 to March 2000 (%) - Multirace
Year householder moved into unit - Moved in 1999 to March 2000 (%) - Other Race
Year householder moved into unit - Moved in 1995 to 1998 (%)
Year householder moved into unit - Moved in 1995 to 1998 (%) - White
Year householder moved into unit - Moved in 1995 to 1998 (%) - Black or African American
Year householder moved into unit - Moved in 1995 to 1998 (%) - Asian
Year householder moved into unit - Moved in 1995 to 1998 (%) - Hispanic or Latino
Year householder moved into unit - Moved in 1995 to 1998 (%) - American Indian and Alaska Native
Year householder moved into unit - Moved in 1995 to 1998 (%) - Multirace
Year householder moved into unit - Moved in 1995 to 1998 (%) - Other Race
Year householder moved into unit - Moved in 1990 to 1994 (%)
Year householder moved into unit - Moved in 1990 to 1994 (%) - White
Year householder moved into unit - Moved in 1990 to 1994 (%) - Black or African American
Year householder moved into unit - Moved in 1990 to 1994 (%) - Asian
Year householder moved into unit - Moved in 1990 to 1994 (%) - Hispanic or Latino
Year householder moved into unit - Moved in 1990 to 1994 (%) - American Indian and Alaska Native
Year householder moved into unit - Moved in 1990 to 1994 (%) - Multirace
Year householder moved into unit - Moved in 1990 to 1994 (%) - Other Race
Year householder moved into unit - Moved in 1980 to 1989 (%)
Year householder moved into unit - Moved in 1980 to 1989 (%) - White
Year householder moved into unit - Moved in 1980 to 1989 (%) - Black or African American
Year householder moved into unit - Moved in 1980 to 1989 (%) - Asian
Year householder moved into unit - Moved in 1980 to 1989 (%) - Hispanic or Latino
Year householder moved into unit - Moved in 1980 to 1989 (%) - American Indian and Alaska Native
Year householder moved into unit - Moved in 1980 to 1989 (%) - Multirace
Year householder moved into unit - Moved in 1980 to 1989 (%) - Other Race
Year householder moved into unit - Moved in 1970 to 1979 (%)
Year householder moved into unit - Moved in 1970 to 1979 (%) - White
Year householder moved into unit - Moved in 1970 to 1979 (%) - Black or African American
Year householder moved into unit - Moved in 1970 to 1979 (%) - Asian
Year householder moved into unit - Moved in 1970 to 1979 (%) - Hispanic or Latino
Year householder moved into unit - Moved in 1970 to 1979 (%) - American Indian and Alaska Native
Year householder moved into unit - Moved in 1970 to 1979 (%) - Multirace
Year householder moved into unit - Moved in 1970 to 1979 (%) - Other Race
Year householder moved into unit - Moved in 1969 or earlier (%)
Year householder moved into unit - Moved in 1969 or earlier (%) - White
Year householder moved into unit - Moved in 1969 or earlier (%) - Black or African American
Year householder moved into unit - Moved in 1969 or earlier (%) - Asian
Year householder moved into unit - Moved in 1969 or earlier (%) - Hispanic or Latino
Year householder moved into unit - Moved in 1969 or earlier (%) - American Indian and Alaska Native
Year householder moved into unit - Moved in 1969 or earlier (%) - Multirace
Year householder moved into unit - Moved in 1969 or earlier (%) - Other Race
Housing units lacking complete plumbing facilities (%)
Housing units lacking complete kitchen facilities (%)
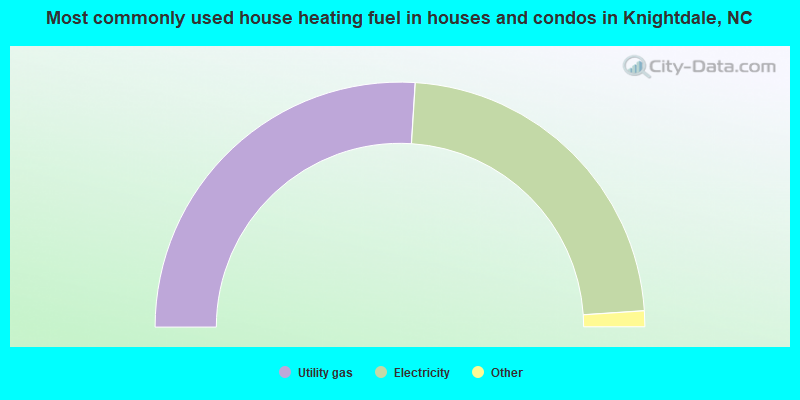
House heating fuel used in houses and condos - Utility gas (%)
House heating fuel used in houses and condos - Bottled, tank, or LP gas (%)
House heating fuel used in houses and condos - Electricity (%)
House heating fuel used in houses and condos - Fuel oil, kerosene, etc. (%)
House heating fuel used in houses and condos - Coal or coke (%)
House heating fuel used in houses and condos - Wood (%)
House heating fuel used in houses and condos - Solar energy (%)
House heating fuel used in houses and condos - Other fuel (%)
House heating fuel used in houses and condos - No fuel used (%)
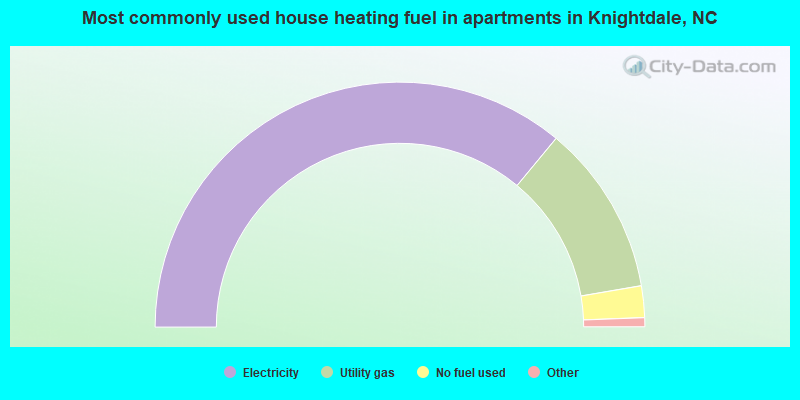
House heating fuel used in apartments - Utility gas (%)
House heating fuel used in apartments - Bottled, tank, or LP gas (%)
House heating fuel used in apartments - Electricity (%)
House heating fuel used in apartments - Fuel oil, kerosene, etc. (%)
House heating fuel used in apartments - Coal or coke (%)
House heating fuel used in apartments - Wood (%)
House heating fuel used in apartments - Solar energy (%)
House heating fuel used in apartments - Other fuel (%)
House heating fuel used in apartments - No fuel used (%)
Latest news about housing in Knightdale, NC collected exclusively by city-data.com from local newspapers, TV, and radio stations
Median year house/condo built: 2007Median year apartment built: 2009Household type by relationship:
Households: 19,852
Male householders: 3,430 (810 living alone ), Female householders: 4,287 (1,240 living alone )3,716 spouses (3,703 opposite-sex spouses ), 365 unmarried partners , (352 opposite-sex unmarried partners ), 6,778 children (6,320 natural , 12 adopted , 445 stepchildren ), 247 grandchildren , 254 brothers or sisters , 275 parents , 14 foster children , 223 other relatives , 155 non-relatives In group quarters: 103
Size of family households: 2,146 2-persons , 1,695 3-persons , 1,124 4-persons , 397 5-persons , 11 6-persons , 30 7-or-more-persons .
Size of nonfamily households: 2,070 1-person , 235 2-persons , 8 3-persons .
3,490 married couples with children. single-parent households (202 men , 1,131 women ).
86.7% of residents of Knightdale speak English at home. of residents speak Spanish at home (73% speak English very well , 14% speak English well , 11% speak English not well , 2% don't speak English at all ).of residents speak other Indo-European language at home (59% speak English very well , 41% speak English well ).of residents speak Asian or Pacific Island language at home (71% speak English very well , 12% speak English well , 7% speak English not well , 10% don't speak English at all ).of residents speak other language at home (64% speak English very well , 36% speak English not well ).
Foreign born population: 2,023 (10.2%)of them are naturalized citizens )
Median number of rooms in houses and condos:
Median number of rooms in apartments
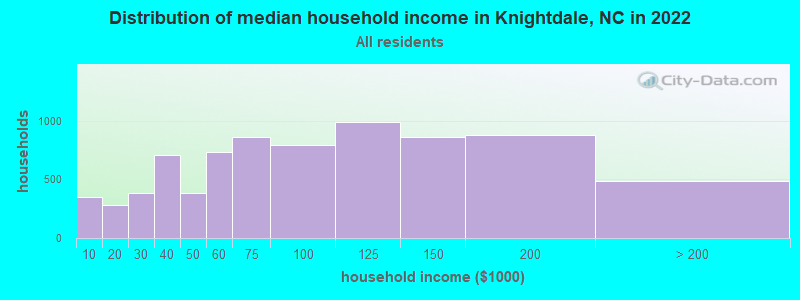
Knightdale, NC household income distribution 354 Less than $10,000278 $10,000 to $19,999386 $20,000 to $29,999711 $30,000 to $39,999384 $40,000 to $49,999735 $50,000 to $59,999859 $60,000 to $74,999795 $75,000 to $99,999990 $100,000 to $124,999860 $125,000 to $149,999879 $150,000 to $199,999488 $200,000 or more
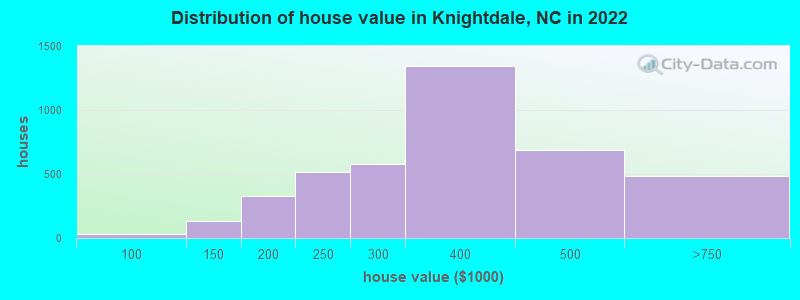
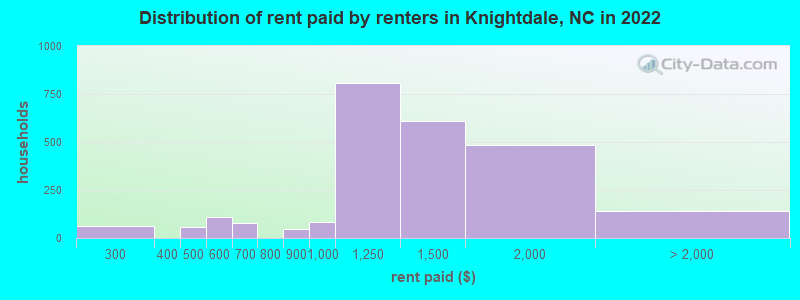
Home value of owner - occupied houses in 2022 in Knightdale, NC 3 $20,000 to $24,99932 $70,000 to $79,999104 $100,000 to $124,99930 $125,000 to $149,999107 $150,000 to $174,999217 $175,000 to $199,999515 $200,000 to $249,999574 $250,000 to $299,9991,346 $300,000 to $399,999689 $400,000 to $499,999469 $500,000 to $749,99918 $1,500,000 to $1,999,999Rent paid by renters in 2022 in Knightdale, NC 65 $250 to $29943 $400 to $44912 $450 to $49924 $500 to $54983 $550 to $59928 $600 to $64950 $650 to $69947 $800 to $89982 $900 to $999806 $1,000 to $1,249607 $1,250 to $1,499482 $1,500 to $1,999122 $2,000 to $2,49919 No cash rent
Percentage of workers working in this county: 91.8%Number of people working at home: 2,296 (20.6% of all workers )
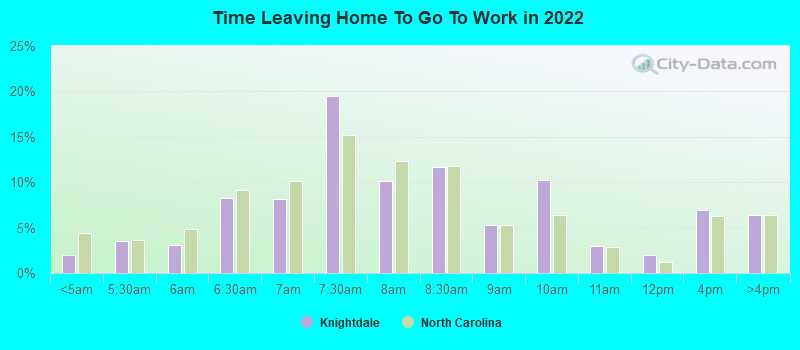
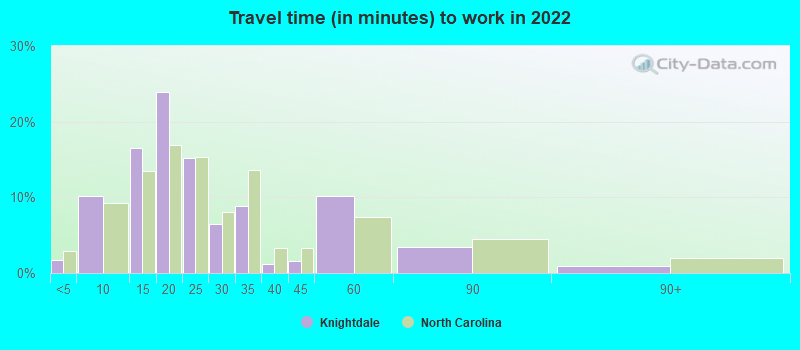
Travel time to work (commute)
Less than 5 minutes: 1025 to 9 minutes: 54410 to 14 minutes: 74615 to 19 minutes: 1,57720 to 24 minutes: 1,60425 to 29 minutes: 1,32030 to 34 minutes: 91735 to 39 minutes: 39540 to 44 minutes: 29145 to 59 minutes: 64360 to 89 minutes: 35790 or more minutes: 97
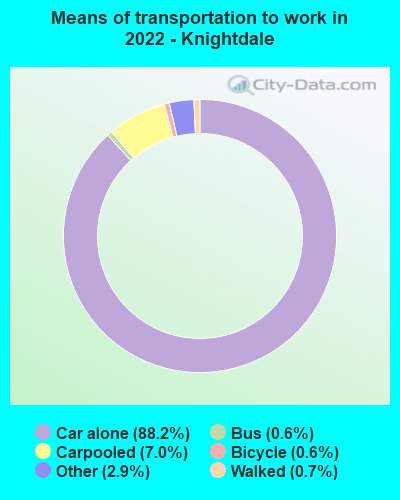
Means of transportation to work:
Drove a car alone: 5,399 (63.6%)Carpooled: 455 (5.4%)Bus : 29 (0.3%)Taxi: 249 (2.9%)Bicycle: 62 (0.7%)Walked: 61 (0.7%)Worked at home: 2,296 (27.0%)
Unemployment by race in 2022
Unemployment rate for White non-Hispanic residents 1.6% Males1.0% FemalesUnemployment rate for Black residents 10.0% Males6.5% FemalesUnemployment rate for Asian residents 1.1% MalesUnemployment rate for Hispanic or Latino residents 3.9% Females
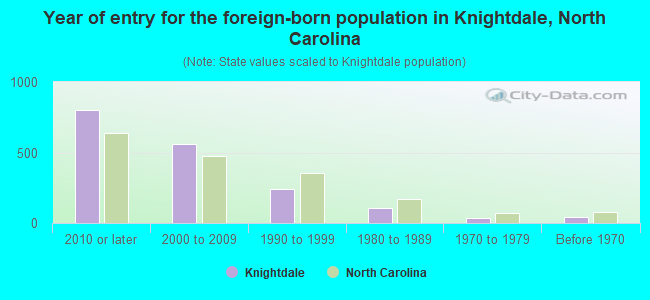
Year of entry for the foreign-born population in Knightdale, North Carolina
803 2010 or later 557 2000 to 2009 239 1990 to 1999 105 1980 to 1989 33 1970 to 1979 45 Before 1970
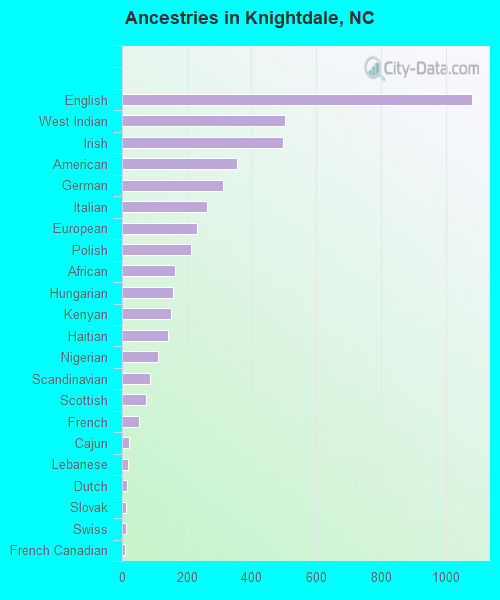
First ancestries reported:
English: 1,080 (9.0%)
West Indian: 505 (4.2%)
Irish: 498 (4.1%)
American: 356 (3.0%)
German: 313 (2.6%)
Italian: 263 (2.2%)
European: 233 (1.9%)
Polish: 214 (1.8%)
African: 165 (1.4%)
Hungarian: 159 (1.3%)
Kenyan: 150 (1.2%)
Haitian: 143 (1.2%)
Nigerian: 111 (0.9%)
Scandinavian: 87 (0.7%)
Scottish: 73 (0.6%)
French: 51 (0.4%)
Cajun: 22 (0.2%)
Lebanese: 20 (0.2%)
Dutch: 16 (0.1%)
Slovak: 13 (0.1%)
Swiss: 13 (0.1%)
French Canadian: 10 (0.08%)
Scotch-Irish: 2 (0.02%) Most common places of birth for foreign-born residents (%): Dominica Knightdale:
15.1% (291)North Carolina:
0.1% (859)
Burma (Myanmar) Knightdale:
13.0% (251)North Carolina:
0.5% (4,516)
Mexico Knightdale:
9.6% (185)North Carolina:
24.7% (214,776)
Haiti Knightdale:
7.7% (148)North Carolina:
0.6% (5,018)
Peru Knightdale:
6.9% (132)North Carolina:
0.7% (6,091)
Congo Knightdale:
5.8% (112)North Carolina:
0.4% (3,108)
Germany Knightdale:
5.6% (107)North Carolina:
1.8% (15,534)
Canada Knightdale:
5.1% (98)North Carolina:
2.1% (18,105)
Kenya Knightdale:
3.9% (75)North Carolina:
0.5% (4,309)
Honduras Knightdale:
3.4% (66)North Carolina:
4.7% (40,707)
Vietnam Knightdale:
3.1% (60)North Carolina:
2.9% (24,965)
Trinidad and Tobago Knightdale:
3.1% (59)North Carolina:
0.4% (3,587)
Togo Knightdale:
2.9% (55)North Carolina:
0.1% (1,153)
France Knightdale:
2.2% (42)North Carolina:
0.4% (3,292)
El Salvador Knightdale:
2.0% (39)North Carolina:
3.8% (33,379)
Philippines Knightdale:
1.8% (34)North Carolina:
2.4% (20,695)
Thailand Knightdale:
1.8% (34)North Carolina:
0.7% (6,161)
Africa, n.e.c. Knightdale:
1.6% (31)North Carolina:
0.5% (4,032)
Korea Knightdale:
1.6% (30)North Carolina:
1.8% (15,988)
Place of birth for U.S.-born residents:
This state: 9,628Other state: 7,635Northeast: 2,792Midwest: 1,394South: 2,658West: 785 91.0% of Knightdale residents lived in the same house 1 years ago.
Out of people who lived in different houses, 36.4% lived in this county.
Out of people who lived in different counties, 42.7% lived in North Carolina.
Knightdale:
91.0%State average:
87.3%
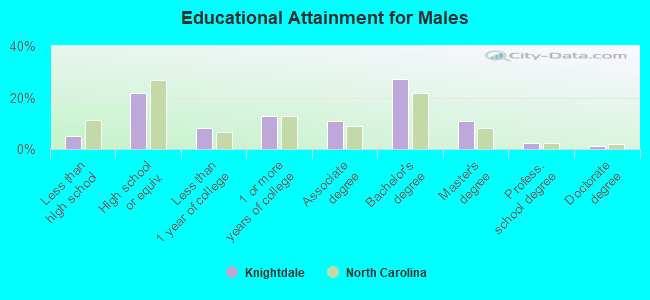
Education attainment for males 25 years and older:
No schooling: 9Nursery to 4th grade: 295th and 6th grade: 07th and 8th grade: 109th grade: 3510th grade: 011th grade: 5612th grade, no diploma: 160High school graduate (or equivalency): 1,348Less than 1 year of college: 504Some college more than 1 year, no degree: 781Associate degree: 678Bachelor's degree: 1,673Master's degree: 664Professional school degree: 137Doctorate degree: 68
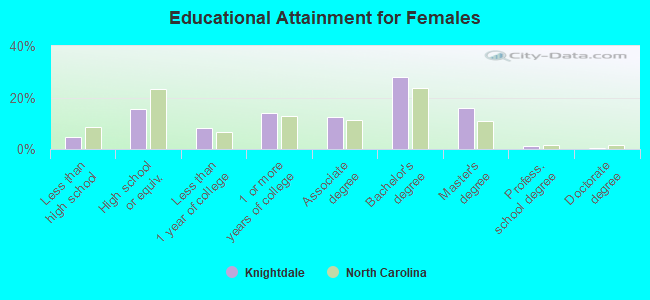
Education attainment for females 25 years and older:
No schooling: 19Nursery to 4th grade: 05th and 6th grade: 1057th and 8th grade: 269th grade: 510th grade: 5711th grade: 5712th grade, no diploma: 64High school graduate (or equivalency): 1,124Less than 1 year of college: 593Some college more than 1 year, no degree: 1,008Associate degree: 898Bachelor's degree: 2,022Master's degree: 1,157Professional school degree: 72Doctorate degree: 39
Housing units in structures:
One, detached: 5,446One, attached: 808Two: 1153 or 4: 855 to 9: 48510 to 19: 36620 to 49: 67350 or more: 105Mobile homes: 65Housing units lacking complete plumbing facilities in 2022: 0.4%Housing units lacking complete kitchen facilities in 2022: 0.2%House/condo owner moved in on average 7 years ago
Renter moved in on average 3 years ago
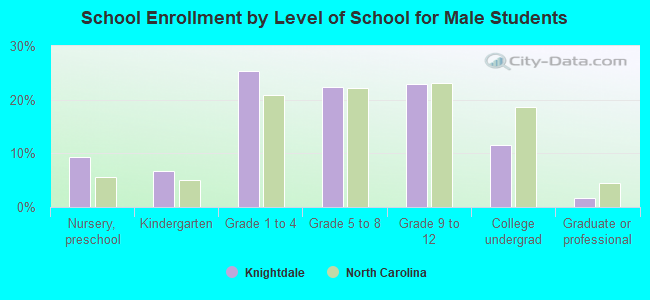
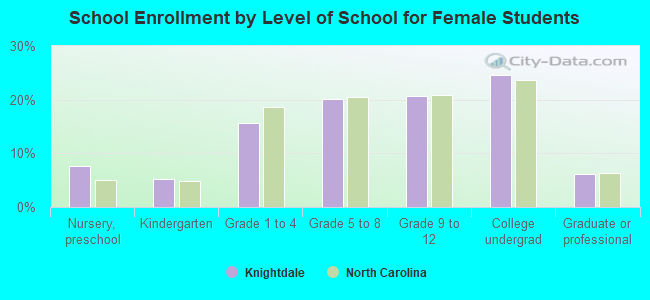
Private vs. public school enrollment:
Students in private schools in grades 1 to 8 (elementary and middle school): 651 Here:
29.0%North Carolina:
13.8%
Students in private schools in grades 9 to 12 (high school): 55 Here:
4.7%North Carolina:
11.9%
Students in private undergraduate colleges: 150 Here:
15.9%North Carolina:
19.3%