Lake Morton-Berrydale, WA (Washington) Houses and Residents
| Lake Morton-Berrydale: | $683,646 |
| Washington: | $569,500 |
Total population: 10,160 (Urban population: 9,439, Rural population: 297 (all nonfarm))
Houses: 3,693 (3,649 occupied: 3,258 owner occupied, 386 renter occupied)
| % of renters here: | 11% |
| State: | 36% |
Housing density: 296 houses/condos per square mile
Median price asked for vacant for-sale houses and condos in 2022 in this county: $843,880.
Median contract rent in 2022: $1,714 (lower quartile is $946, upper quartile is over $2,000)
Median gross rent in Lake Morton-Berrydale, WA in 2022: $1,849
Housing units in Lake Morton-Berrydale with a mortgage: 2,259 (220 second mortgage, 0 home equity loan, 177 both second mortgage and home equity loan)
Houses without a mortgage: 149
Median household income for houses/condos with a mortgage: $138,080
Median household income for apartments without a mortgage: $108,831
Median monthly housing costs: $2,149
Compare current foreclosures near Lake Morton-Berrydale, WA:
| Photo | Address | Area | Beds / Baths | Price | Details |
|---|---|---|---|---|---|

|
#1
18th Ave S Apt V201
Federal Way, WA 98003
|
1,200 sq. feet
|
2 baths 3 beds |
show details | |

|
#2
7th Street Southeast Unit 1
Puyallup, WA 98372
|
1,114 sq. feet
|
2 baths 2 beds |
show details | |

|
#3
42nd Ave S Apt 101
Kent, WA 98032
|
995 sq. feet
|
2 baths 2 beds |
show details | |

|
#4
57th Ave S Unit B104
Seattle, WA 98178
|
572 sq. feet
|
1 baths 1 beds |
show details | |

|
#5
S 124th St
Seattle, WA 98178
|
1,100 sq. feet
|
1 baths 2 beds |
show details | |

|
#6
SE 264th St
Kent, WA 98030
|
1,270 sq. feet
|
2 baths 3 beds |
show details | |

|
#7
SE 383rd St
Auburn, WA 98092
|
3,800 sq. feet
|
3 baths 5 beds |
show details | |

|
#8
S 170th St
Seattle, WA 98188
|
2,650 sq. feet
|
2 baths 5 beds |
show details | |

|
#9
NE 5th St
Renton, WA 98056
|
1,930 sq. feet
|
2 baths 3 beds |
show details | |

|
#10
203rd Ave E
Bonney Lake, WA 98391
|
2,884 sq. feet
|
2 baths 4 beds |
show details |
| Photo | Address | Area | Beds / Baths | Price | Details |
|---|---|---|---|---|---|

|
#11
Lyons Ave NE
Renton, WA 98059
|
2,510 sq. feet
|
2 baths 3 beds |
show details | |

|
#12
S 182nd St
Seattle, WA 98188
|
1,168 sq. feet
|
2 baths 3 beds |
show details | |

|
#13
SE 200th St
Maple Valley, WA 98038
|
1,530 sq. feet
|
1 baths 3 beds |
show details | |

|
#14
20th Ave S
Federal Way, WA 98003
|
1,150 sq. feet
|
1 baths 3 beds |
show details | |

|
#15
28th St E
Bonney Lake, WA 98391
|
3,330 sq. feet
|
3 baths 3 beds |
show details | |

|
#16
SE 147th Pl
Renton, WA 98059
|
2,440 sq. feet
|
2 baths 3 beds |
show details | |

|
#17
S 36th Pl
Renton, WA 98055
|
- sq. feet
|
2 baths 4 beds |
show details | |

|
#18
S Sullivan St
Seattle, WA 98118
|
1,710 sq. feet
|
2 baths 3 beds |
show details | |

|
#19
14th St SW
Puyallup, WA 98371
|
1,920 sq. feet
|
1 baths 3 beds |
show details | |

|
#20
113th Ave SE
Kent, WA 98031
|
2,260 sq. feet
|
3 baths 4 beds |
show details |
| Photo | Address | Area | Beds / Baths | Price | Details |
|---|---|---|---|---|---|

|
#21
50th St SE
Auburn, WA 98092
|
2,560 sq. feet
|
2 baths 5 beds |
show details | |

|
#22
108th Ave E
Puyallup, WA 98374
|
- sq. feet
|
2 baths 5 beds |
show details | |

|
#23
SW 119th St
Seattle, WA 98146
|
2,540 sq. feet
|
2 baths 4 beds |
show details | |

|
#24
SE 47th Pl
Issaquah, WA 98029
|
2,610 sq. feet
|
2 baths 3 beds |
show details | |

|
#25
S 158th St Apt B8
Seattle, WA 98188
|
- sq. feet
|
1 baths 2 beds |
show details | |

|
#26
S Wallace St
Seattle, WA 98178
|
1,890 sq. feet
|
3 baths 4 beds |
show details | |

|
#27
74th Ave E
Puyallup, WA 98373
|
1,836 sq. feet
|
1 baths 3 beds |
show details | |

|
#28
208th Ave SE
Enumclaw, WA 98022
|
1,570 sq. feet
|
1 baths 3 beds |
show details | |

|
#29
SE 236th St
Kent, WA 98031
|
1,790 sq. feet
|
1 baths 4 beds |
show details | |

|
#30
SE 217th Pl
Kent, WA 98031
|
1,260 sq. feet
|
1 baths 3 beds |
show details |
| Photo | Address | Area | Beds / Baths | Price | Details |
|---|---|---|---|---|---|

|
#31
17th Ave SW
Federal Way, WA 98023
|
1,970 sq. feet
|
2 baths 3 beds |
show details | |

|
#32
SE 216th St
Kent, WA 98031
|
1,840 sq. feet
|
2 baths 3 beds |
show details | |

|
#33
F St SE
Auburn, WA 98002
|
820 sq. feet
|
1 baths 2 beds |
show details | |

|
#34
10th Ave S
Seattle, WA 98168
|
830 sq. feet
|
1 baths 2 beds |
show details | |

|
#35
115th Ct SE
Renton, WA 98056
|
2,970 sq. feet
|
2 baths 4 beds |
show details | |

|
#36
16th Ave S
Seattle, WA 98168
|
2,320 sq. feet
|
2 baths 3 beds |
show details | |

|
#37
3rd Ave S
Seattle, WA 98168
|
870 sq. feet
|
1 baths 2 beds |
show details | |

|
#38
126th Pl SE
Renton, WA 98056
|
2,450 sq. feet
|
2 baths 4 beds |
show details | |

|
#39
119th Ave SE
Kent, WA 98030
|
2,760 sq. feet
|
2 baths 4 beds |
show details | |

|
#40
SW 148th St
Seattle, WA 98166
|
1,030 sq. feet
|
1 baths 3 beds |
show details |
| Photo | Address | Area | Beds / Baths | Price | Details |
|---|---|---|---|---|---|

|
#41
16th Ave S
Seattle, WA 98168
|
1,800 sq. feet
|
1 baths 4 beds |
show details | |

|
#42
42nd Ct NE
Auburn, WA 98002
|
1,584 sq. feet
|
2 baths 3 beds |
show details | |

|
#43
S 241st St
Kent, WA 98030
|
1,840 sq. feet
|
2 baths 4 beds |
show details | |

|
#44
44th Ave S
Seattle, WA 98178
|
1,680 sq. feet
|
2 baths 3 beds |
show details | |

|
#45
113th Ave SE
Renton, WA 98055
|
1,960 sq. feet
|
2 baths 3 beds |
show details | |

|
#46
SE 243rd St
Maple Valley, WA 98038
|
2,350 sq. feet
|
2 baths 4 beds |
show details | |

|
#47
S 240th Pl
Kent, WA 98030
|
- sq. feet
|
3 baths 4 beds |
show details | |

|
#48
207th Avenue Ct E
Bonney Lake, WA 98391
|
1,953 sq. feet
|
2 baths 4 beds |
show details | |

|
#49
55th St SE
Auburn, WA 98092
|
2,680 sq. feet
|
3 baths 4 beds |
show details | |

|
Check over 1 million property listings on Foreclosure.com!
|
browse all offers | |||


Median year apartment built: 1980
Household type by relationship:
Households: 10,514- Male householders: 1,834 (169 living alone), Female householders: 1,719 (138 living alone)
2,618 spouses (2,591 opposite-sex spouses), 304 unmarried partners, (298 opposite-sex unmarried partners), 3,132 children (2,960 natural, 59 adopted, 112 stepchildren), 87 grandchildren, 163 brothers or sisters, 247 parents, 69 foster children, 158 other relatives, 151 non-relatives
- In group quarters: 27
Size of family households: 1,442 2-persons, 659 3-persons, 465 4-persons, 318 5-persons, 98 6-persons, 79 7-or-more-persons.
Size of nonfamily households: 331 1-person, 135 2-persons, 20 3-persons.
1,979 married couples with children.
426 single-parent households (72 men, 354 women).
81.3% of residents of Lake Morton-Berrydale speak English at home.
4.3% of residents speak Spanish at home (54% speak English very well, 31% speak English well, 15% speak English not well).
7.4% of residents speak other Indo-European language at home (55% speak English very well, 16% speak English well, 26% speak English not well, 4% don't speak English at all).
5.0% of residents speak Asian or Pacific Island language at home (56% speak English very well, 26% speak English well, 18% speak English not well).
Foreign born population: 1,438 (13.7%)
(50.9% of them are naturalized citizens)
| Here: | 7.0 |
| State: | 6.5 |
| Here: | 5.9 |
| State: | 3.9 |
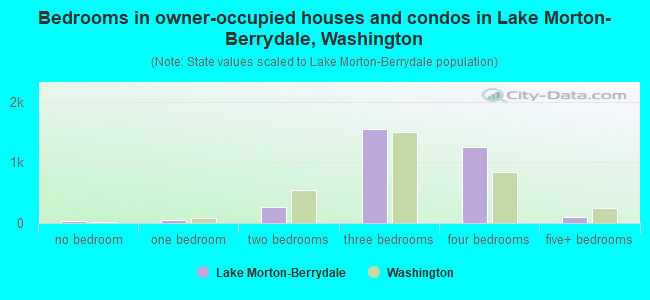
- Bedrooms in owner-occupied houses and condos in Lake Morton-Berrydale, Washington
- 36no bedroom
- 481 bedroom
- 2622 bedrooms
- 1,5533 bedrooms
- 1,2534 bedrooms
- 1055+ bedrooms
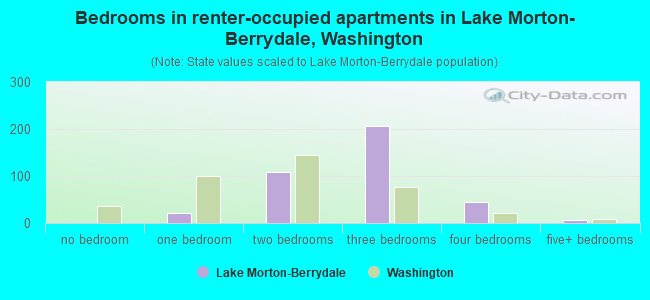
- Bedrooms in renter-occupied apartments in Lake Morton-Berrydale, Washington
- 0no bedroom
- 211 bedroom
- 1082 bedrooms
- 2063 bedrooms
- 444 bedrooms
- 75+ bedrooms
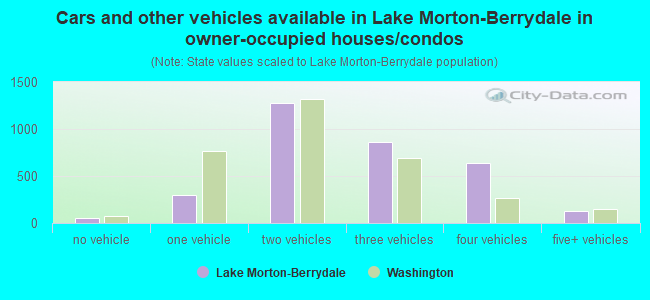
- Cars and other vehicles available in Lake Morton-Berrydale in owner-occupied houses/condos
- 52no vehicle
- 2991 vehicle
- 1,2792 vehicles
- 8663 vehicles
- 6334 vehicles
- 1295+ vehicles
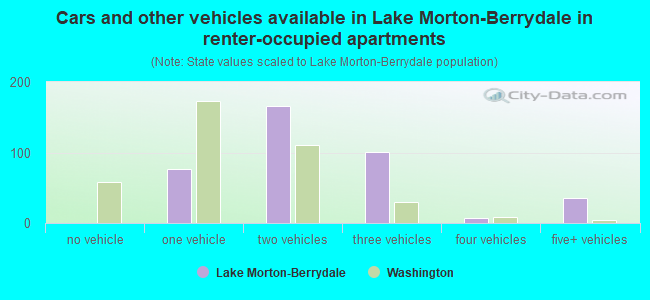
- Cars and other vehicles available in Lake Morton-Berrydale in renter-occupied apartments
- 0no vehicle
- 771 vehicle
- 1662 vehicles
- 1013 vehicles
- 74 vehicles
- 355+ vehicles
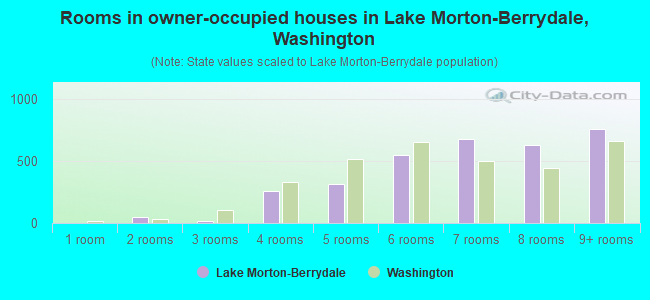
- Rooms in owner-occupied houses in Lake Morton-Berrydale, Washington
- 01 room
- 472 rooms
- 193 rooms
- 2554 rooms
- 3185 rooms
- 5506 rooms
- 6807 rooms
- 6308 rooms
- 7609+ rooms
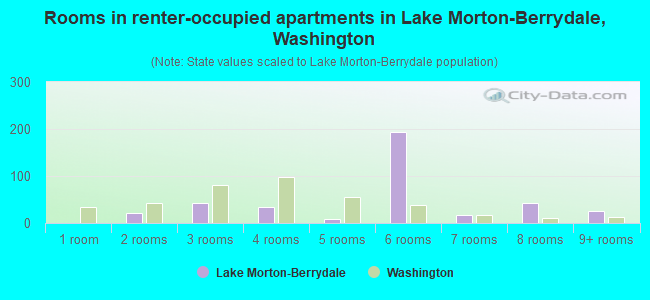
- Rooms in renter-occupied apartments in Lake Morton-Berrydale, Washington
- 01 room
- 212 rooms
- 433 rooms
- 344 rooms
- 95 rooms
- 1946 rooms
- 187 rooms
- 428 rooms
- 269+ rooms
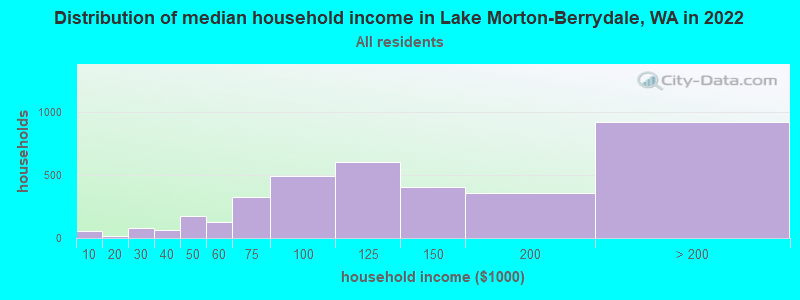
Lake Morton-Berrydale, WA household income distribution

- 58Less than $10,000
- 16$10,000 to $19,999
- 79$20,000 to $29,999
- 62$30,000 to $39,999
- 175$40,000 to $49,999
- 128$50,000 to $59,999
- 329$60,000 to $74,999
- 491$75,000 to $99,999
- 607$100,000 to $124,999
- 406$125,000 to $149,999
- 358$150,000 to $199,999
- 921$200,000 or more
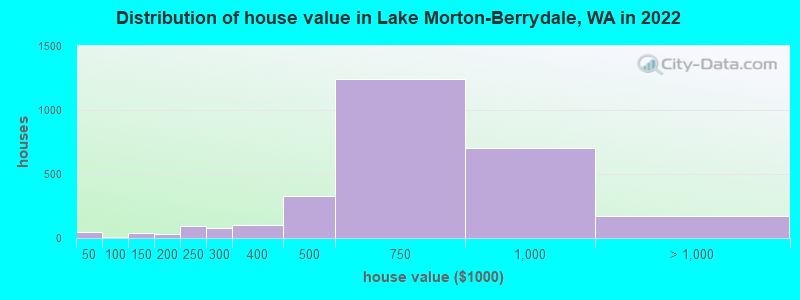
Home value of owner - occupied houses in 2022 in Lake Morton-Berrydale, WA
-
- 39Less than $10,000
- 4$20,000 to $24,999
- 8$90,000 to $99,999
- 36$100,000 to $124,999
- 35$150,000 to $174,999
- 95$200,000 to $249,999
- 81$250,000 to $299,999
- 104$300,000 to $399,999
- 331$400,000 to $499,999
- 1,239$500,000 to $749,999
- 699$750,000 to $999,999
- 111$1,000,000 to $1,499,999
- 30$1,500,000 to $1,999,999
- 29$2,000,000 or more
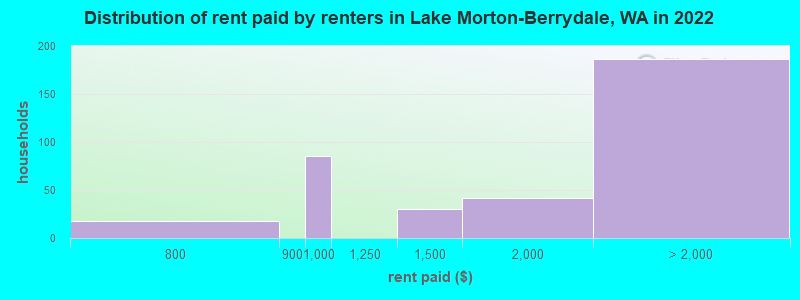
Rent paid by renters in 2022 in Lake Morton-Berrydale, WA
-
- 18$750 to $799
- 85$900 to $999
- 30$1,250 to $1,499
- 42$1,500 to $1,999
- 32$2,000 to $2,499
- 109$2,500 to $2,999
- 43No cash rent
Percentage of workers working in this county: 87.6%
Number of people working at home: 959 (18.2% of all workers)
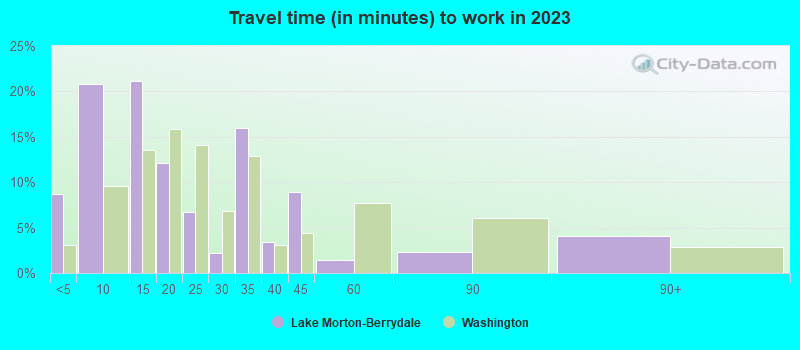
Travel time to work (commute)
- Less than 5 minutes: 46
- 5 to 9 minutes: 151
- 10 to 14 minutes: 219
- 15 to 19 minutes: 215
- 20 to 24 minutes: 587
- 25 to 29 minutes: 200
- 30 to 34 minutes: 544
- 35 to 39 minutes: 228
- 40 to 44 minutes: 264
- 45 to 59 minutes: 790
- 60 to 89 minutes: 471
- 90 or more minutes: 160
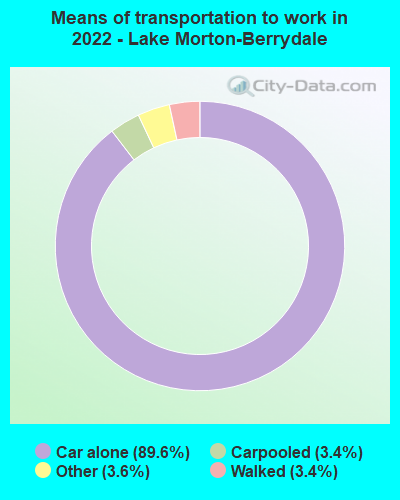
Means of transportation to work:
- Drove a car alone: 719 (46.7%)
- Carpooled: 26 (1.7%)
- Taxi: 26 (1.7%)
- Walked: 24 (1.6%)
- Worked at home: 959 (62.3%)
- Unemployment by race in 2022
- Unemployment rate for White non-Hispanic residents
- 2.5%Males
- 2.7%Females
- Unemployment rate for Asian residents
- 8.8%Females
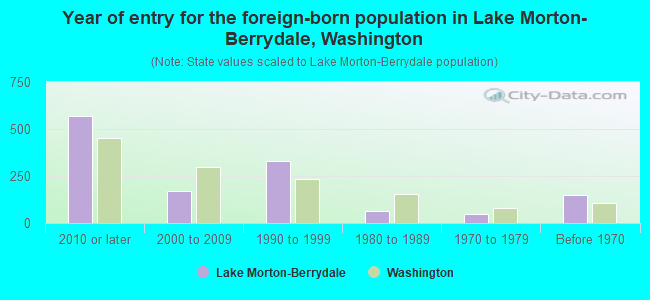
- Year of entry for the foreign-born population in Lake Morton-Berrydale, Washington
- 5672010 or later
- 1682000 to 2009
- 3301990 to 1999
- 631980 to 1989
- 491970 to 1979
- 149Before 1970
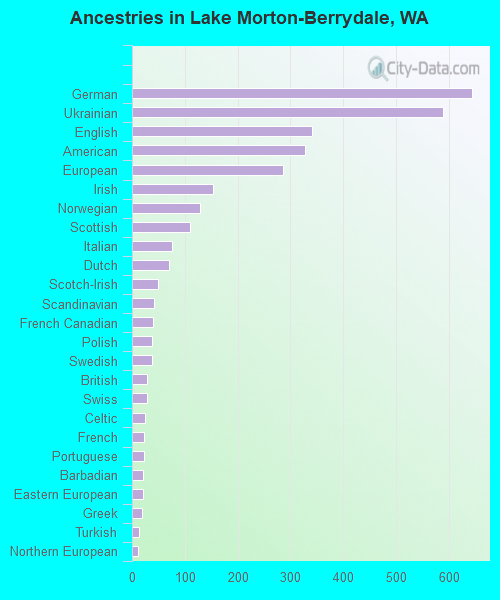
First ancestries reported:
- German: 644 (13.0%)
- Ukrainian: 589 (11.9%)
- English: 341 (6.9%)
- American: 327 (6.6%)
- European: 286 (5.8%)
- Irish: 154 (3.1%)
- Norwegian: 129 (2.6%)
- Scottish: 110 (2.2%)
- Italian: 76 (1.5%)
- Dutch: 71 (1.4%)
- Scotch-Irish: 50 (1.0%)
- Scandinavian: 41 (0.8%)
- French Canadian: 39 (0.8%)
- Polish: 38 (0.8%)
- Swedish: 38 (0.8%)
- British: 28 (0.6%)
- Swiss: 28 (0.6%)
- Celtic: 24 (0.5%)
- French: 23 (0.5%)
- Portuguese: 22 (0.4%)
- Barbadian: 21 (0.4%)
- Eastern European: 20 (0.4%)
- Greek: 18 (0.4%)
- Turkish: 13 (0.3%)
- Northern European: 11 (0.2%)
- Canadian: 9 (0.2%)
- Welsh: 8 (0.2%)
- Jamaican: 8 (0.2%)
Most common places of birth for foreign-born residents (%):
| Lake Morton-Berrydale: | 26.7% (384) |
| Washington: | 3.1% (35,872) |
| Lake Morton-Berrydale: | 14.9% (214) |
| Washington: | 6.3% (71,661) |
| Lake Morton-Berrydale: | 10.6% (153) |
| Washington: | 4.1% (47,238) |
| Lake Morton-Berrydale: | 8.4% (121) |
| Washington: | 5.4% (62,003) |
| Lake Morton-Berrydale: | 4.8% (69) |
| Washington: | 21.1% (241,655) |
| Lake Morton-Berrydale: | 4.6% (66) |
| Washington: | 7.4% (84,470) |
| Lake Morton-Berrydale: | 3.5% (50) |
| Washington: | 8.9% (101,353) |
| Lake Morton-Berrydale: | 3.5% (50) |
| Washington: | 0.7% (7,568) |
| Lake Morton-Berrydale: | 2.5% (36) |
| Washington: | 1.2% (13,745) |
| Lake Morton-Berrydale: | 2.3% (33) |
| Washington: | 0.9% (9,937) |
| Lake Morton-Berrydale: | 1.9% (28) |
| Washington: | 1.0% (10,943) |
| Lake Morton-Berrydale: | 1.8% (26) |
| Washington: | 0.3% (3,414) |
Place of birth for U.S.-born residents:
- This state: 5,732
- Other state: 3,095
- Northeast: 302
- Midwest: 483
- South: 592
- West: 1,699
89.7% of Lake Morton-Berrydale residents lived in the same house 1 years ago.
Out of people who lived in different houses, 46.4% lived in this county.
Out of people who lived in different counties, 78.9% lived in Washington.
| Lake Morton-Berrydale: | 89.7% |
| State average: | 85.2% |
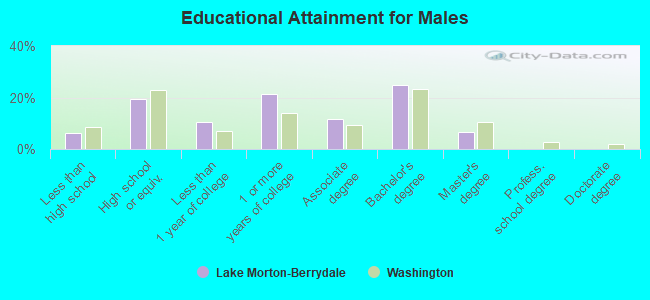
Education attainment for males 25 years and older:
- No schooling: 95
- Nursery to 4th grade: 28
- 5th and 6th grade: 0
- 7th and 8th grade: 0
- 9th grade: 39
- 10th grade: 18
- 11th grade: 6
- 12th grade, no diploma: 34
- High school graduate (or equivalency): 706
- Less than 1 year of college: 376
- Some college more than 1 year, no degree: 770
- Associate degree: 427
- Bachelor's degree: 897
- Master's degree: 237
- Professional school degree: 0
- Doctorate degree: 0
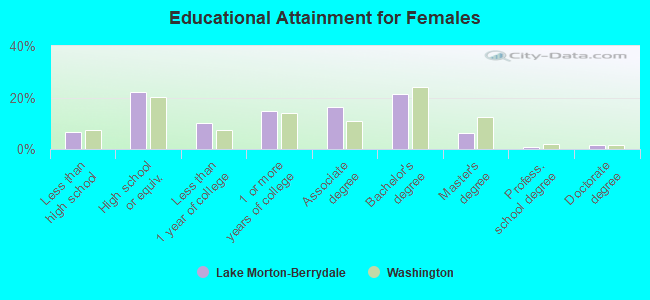
Education attainment for females 25 years and older:
- No schooling: 151
- Nursery to 4th grade: 0
- 5th and 6th grade: 9
- 7th and 8th grade: 6
- 9th grade: 0
- 10th grade: 0
- 11th grade: 60
- 12th grade, no diploma: 10
- High school graduate (or equivalency): 784
- Less than 1 year of college: 364
- Some college more than 1 year, no degree: 529
- Associate degree: 574
- Bachelor's degree: 756
- Master's degree: 224
- Professional school degree: 30
- Doctorate degree: 59
Housing units in structures:
- One, detached: 3,527
- One, attached: 11
- Mobile homes: 112
- Boats, RVs, vans, etc.: 42
Median worth of mobile homes: $320,436
Housing units lacking complete kitchen facilities in 2022: 0.3%
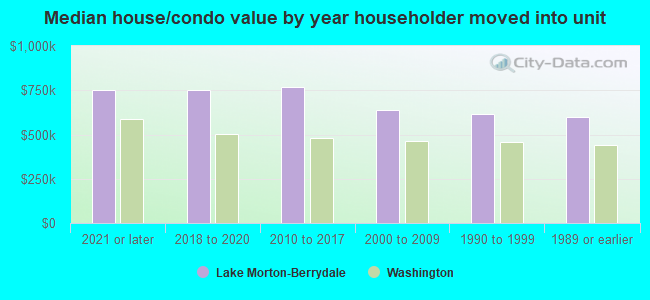
House/condo owner moved in on average 15 years ago
Renter moved in on average 7 years ago
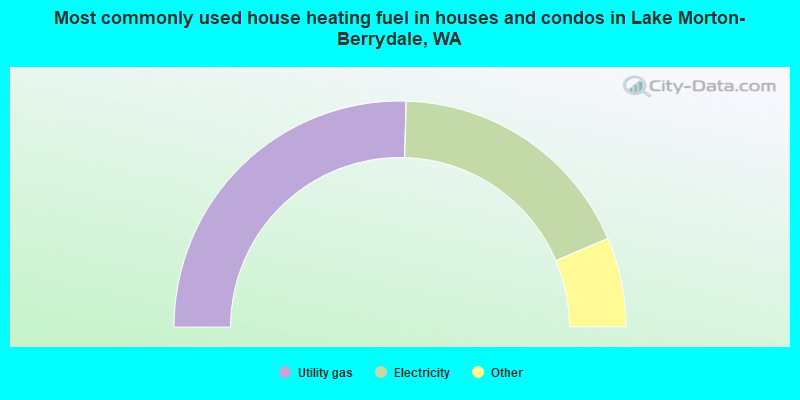
- 50.9%Utility gas
- 36.3%Electricity
- 3.9%Bottled, tank, or LP gas
- 3.9%Fuel oil, kerosene, etc.
- 3.8%Wood
- 0.9%Other fuel
- 0.3%No fuel used
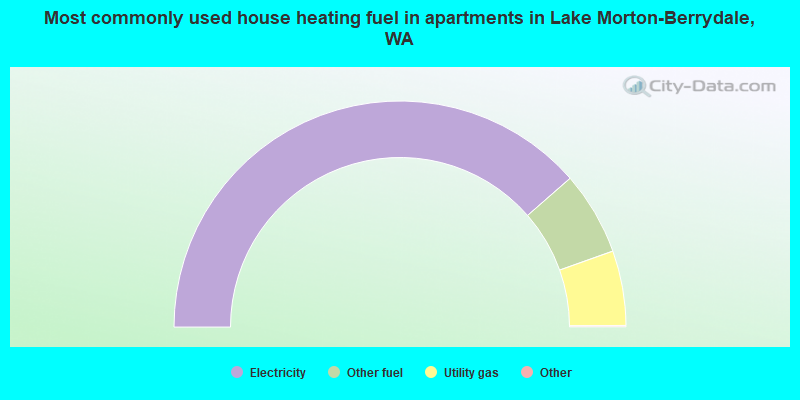
- 77.3%Electricity
- 12.0%Other fuel
- 10.7%Utility gas
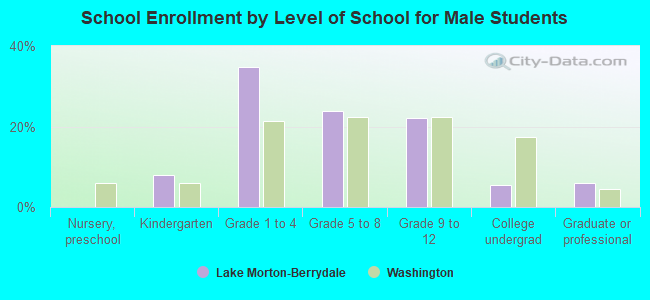
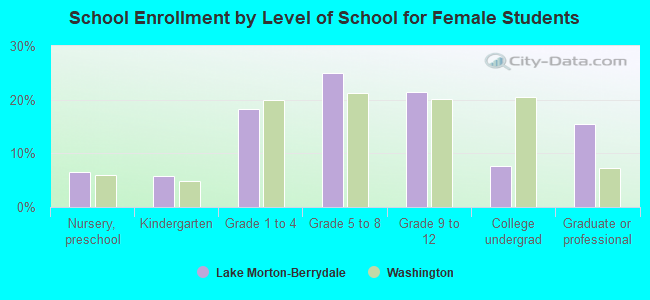
Private vs. public school enrollment:
| Here: | 3.7% |
| Washington: | 12.4% |
| Here: | 1.7% |
| Washington: | 9.2% |
| Here: | 27.8% |
| Washington: | 16.5% |