Lake Wales, FL (Florida) Houses and Residents
Estimated median house or condo value in 2022: $258,571 (it was $68,300 in 2000 )
Lake Wales:
$258,571Florida:
$354,100
Lower value quartile - upper value quartile: $178,485 - $336,907Mean price in 2022: Detached houses: $278,855 Here:
$278,855State:
$500,941
Townhouses or other attached units: $240,717 Here:
$240,717State:
$370,869
In 5-or-more-unit structures: $59,028 Here:
$59,028State:
$447,145
Mobile homes: $63,154 Here:
$63,154State:
$113,202
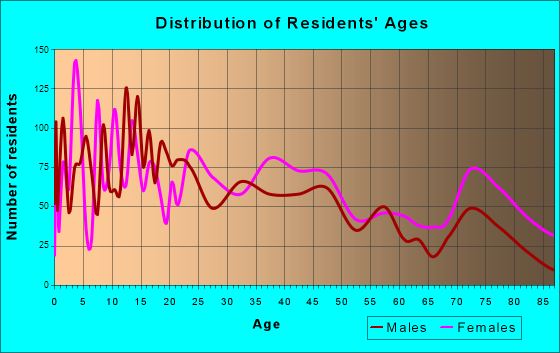
Total population: 15,140 (Urban population: 10,255, Rural population: 47 (all nonfarm) )
Houses: 8,711 (7,170 occupied: 4,448 owner occupied, 2,995 renter occupied )
% of renters here:
40%State:
33%
Housing density: 653 houses/condos per square mile
Median price asked for vacant for-sale houses and condos in 2022: $193,463.
Median contract rent in 2022: $874 (lower quartile is $757, upper quartile is $1,024)
Median rent asked for vacant for-rent units in 2022: $793
Median gross rent in Lake Wales, FL in 2022: $1,011
Housing units in Lake Wales with a mortgage: 2,331 (137 second mortgage, 0 home equity loan, 83 both second mortgage and home equity loan )Houses without a mortgage: 14
Median household income for houses/condos with a mortgage: $83,731
Median household income for apartments without a mortgage: $68,013
Median monthly housing costs: $997
Data:
Median house or condo value ($)
Median house or condo value ($ change since 2000)
Median house or condo value ($) - White
Median house or condo value ($) - Black or African American
Median house or condo value ($) - Asian
Median house or condo value ($) - Hispanic or Latino
Median house or condo value ($) - American Indian and Alaska Native
Median house or condo value ($) - Multirace
Median house or condo value ($) - Other Race
Median price asked for mobile homes ($)
Household density (households per square mile)
Mean house or condo value by units in structure - 1, detached ($)
Mean house or condo value by units in structure - 1, attached ($)
Mean house or condo value by units in structure - 2 ($)
Mean house or condo value by units in structure by units in structure - 3 or 4 ($)
Mean house or condo value by units in structure - 5 or more ($)
Mean house or condo value by units in structure - Boat, RV, van, etc. ($)
Mean house or condo value by units in structure - Mobile home ($)
Median contract rent ($)
Median contract rent - Lower quartile ($)
Median contract rent - Upper quartile ($)
Median gross rent ($)
Urban houses (%)
Rural houses (%)
Houses occupied (%)
Houses occupied (% change since 2000)
Houses owner occupied (%)
Houses owner occupied (% change since 2000)
Houses renter occupied (%)
Houses renter occupied (% change since 2000)
Vacant housing units - For rent (%)
Vacant housing units - For rent (% change since 2000)
Vacant housing units - For sale only (%)
Vacant housing units - For sale only (% change since 2000)
Vacant housing units - Rented or sold, not occupied (%)
Vacant housing units - Rented or sold, not occupied (% change since 2000)
Vacant housing units - For seasonal, recreational, or occasional use (%)
Vacant housing units - For seasonal, recreational, or occasional use (% change since 2000)
Vacant housing units - For migrant workers (%)
Vacant housing units - For migrant workers (% change since 2000)
Vacant housing units - Other vacant (%)
Vacant housing units - Other vacant (% change since 2000)
Median monthly housing costs ($)
Median household income for houses/condos with a mortgage ($)
Median household income for houses/condos without a mortgage ($)
Median household income ($)
Median household income ($) - White
Median household income ($) - Black or African American
Median household income ($) - Asian
Median household income ($) - Hispanic or Latino
Median household income ($) - American Indian and Alaska Native
Median household income ($) - Multirace
Median household income ($) - Other Race
Mortgage status - with mortgage (%)
Mortgage status - with second mortgage (%)
Mortgage status - with home equity loan (%)
Mortgage status - with both second mortgage and home equity loan (%)
Mortgage status - without a mortgage (%)
Median year house/condo built
Median year apartment built
Household type by relationship - Male householder living alone (%)
Household type by relationship - Male householder not living alone (%)
Household type by relationship - Female householder living alone (%)
Household type by relationship - Female householder not living alone (%)
Household type by relationship - Opposite-Sex spouse (%)
Household type by relationship - Same-Sex spouse (%)
Household type by relationship - Opposite-Sex unmarried partner (%)
Household type by relationship - Same-Sex unmarried partner (%)
Household type by relationship - In group quarters (%)
Size of family households - 2-person household (%)
Size of family households - 3-person household (%)
Size of family households - 4-person household (%)
Size of family households - 5-person household (%)
Size of family households - 6-person household (%)
Size of family households - 7-or-more-person household (%)
Size of nonfamily households - 1-person household (%)
Size of nonfamily households - 2-person household (%)
Size of nonfamily households - 3-person household (%)
Size of nonfamily households - 4-person household (%)
Size of nonfamily households - 5-person household (%)
Size of nonfamily households - 6-person household (%)
Size of nonfamily households - 7-or-moreperson household (%)
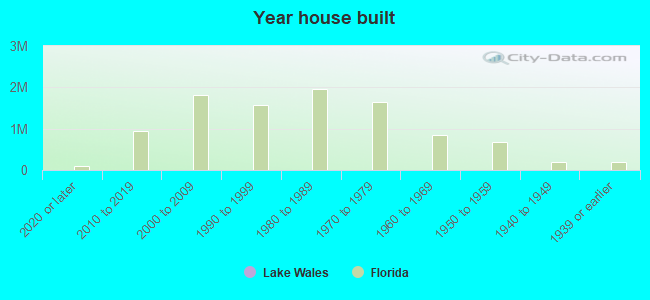
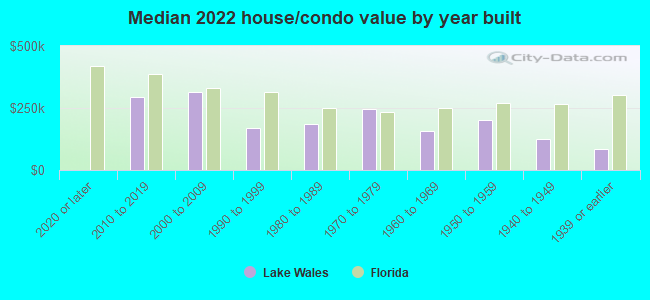
Year house built - Built 2010 or later (%)
Year house built - Built 2000 to 2009 (%)
Year house built - Built 1990 to 1999 (%)
Year house built - Built 1980 to 1989 (%)
Year house built - Built 1970 to 1979 (%)
Year house built - Built 1960 to 1969 (%)
Year house built - Built 1950 to 1959 (%)
Year house built - Built 1940 to 1949 (%)
Year house built - Built 1939 or earlier (%)
Median number of rooms in houses and condos
Median number of rooms in apartments
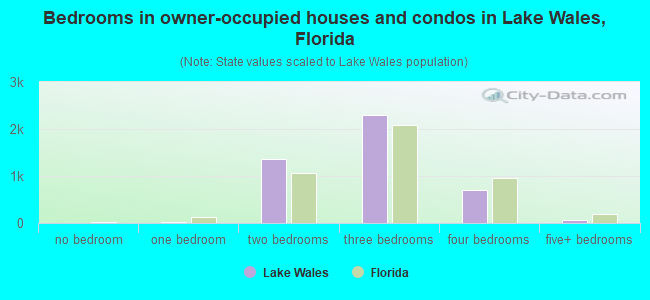
Median number of bedrooms in owner occupied houses
Mean number of bedrooms in owner occupied houses
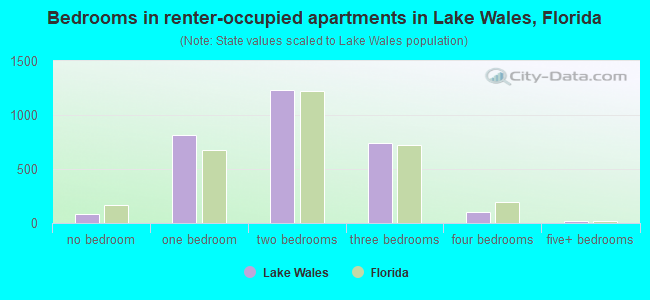
Median number of bedrooms in renter occupied houses
Mean number of bedrooms in renter occupied houses
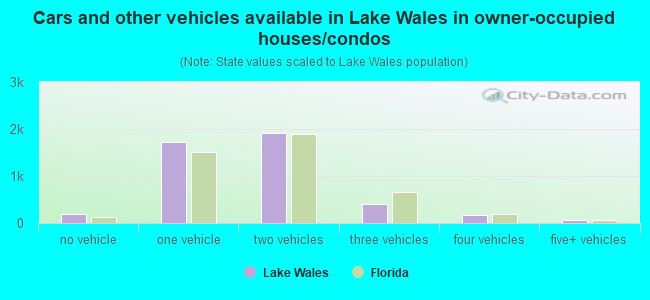
Median number of vehichles in owner occupied houses
Mean number of vehichles in owner occupied houses
Median number of vehichles in renter occupied houses
Mean number of vehichles in renter occupied houses
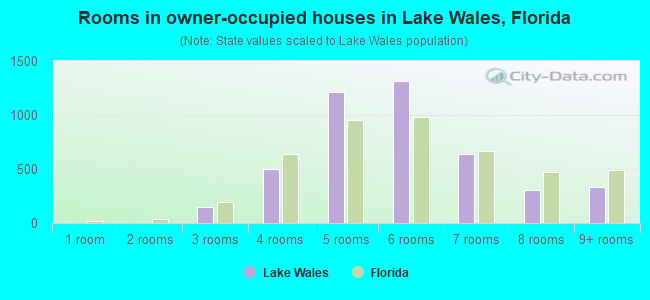
Rooms in owner-occupied houses - 1 room (%)
Rooms in owner-occupied houses - 2 rooms (%)
Rooms in owner-occupied houses - 3 rooms (%)
Rooms in owner-occupied houses - 4 rooms (%)
Rooms in owner-occupied houses - 5 rooms (%)
Rooms in owner-occupied houses - 6 rooms (%)
Rooms in owner-occupied houses - 7 rooms (%)
Rooms in owner-occupied houses - 8 rooms (%)
Rooms in owner-occupied houses - 9+ rooms (%)
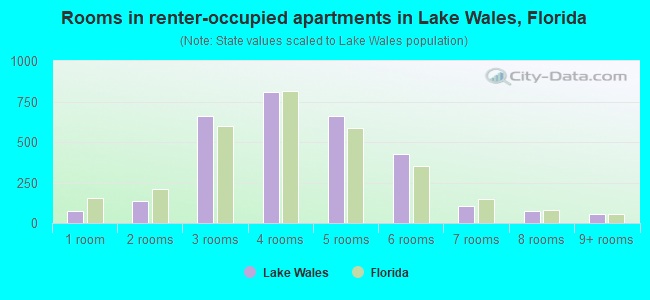
Rooms in renter-occupied houses - 1 room (%)
Rooms in renter-occupied houses - 2 rooms (%)
Rooms in renter-occupied houses - 3 rooms (%)
Rooms in renter-occupied houses - 4 rooms (%)
Rooms in renter-occupied houses - 5 rooms (%)
Rooms in renter-occupied houses - 6 rooms (%)
Rooms in renter-occupied houses - 7 rooms (%)
Rooms in renter-occupied houses - 8 rooms (%)
Rooms in renter-occupied houses - 9+ rooms (%)
Bedrooms in owner-occupied houses - no bedrooms (%)
Bedrooms in owner-occupied houses - 1 bedroom (%)
Bedrooms in owner-occupied houses - 2 bedrooms (%)
Bedrooms in owner-occupied houses - 3 bedrooms (%)
Bedrooms in owner-occupied houses - 4 bedrooms (%)
Bedrooms in owner-occupied houses - 5+ bedrooms (%)
Bedrooms in renter-occupied houses - no bedrooms (%)
Bedrooms in renter-occupied houses - 1 bedroom (%)
Bedrooms in renter-occupied houses - 2 bedrooms (%)
Bedrooms in renter-occupied houses - 3 bedrooms (%)
Bedrooms in renter-occupied houses - 4 bedrooms (%)
Bedrooms in renter-occupied houses - 5+ bedrooms (%)
Vehicles available in owner-occupied houses - no vehicle available (%)
Vehicles available in owner-occupied houses - 1 vehicle available(%)
Vehicles available in owner-occupied houses - 2 Vehicles available (%)
Vehicles available in owner-occupied houses - 3 Vehicles available (%)
Vehicles available in owner-occupied houses - 4 Vehicles available (%)
Vehicles available in owner-occupied houses - 5+ Vehicles available (%)
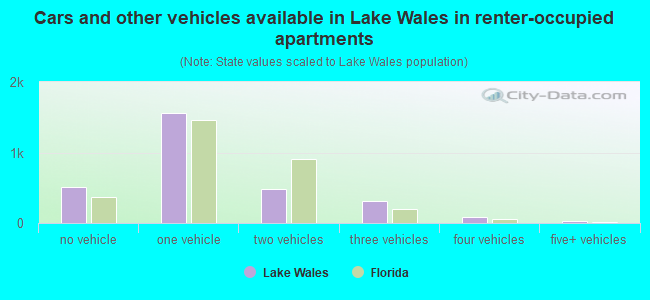
Vehicles available in renter-occupied houses - no vehicle available (%)
Vehicles available in renter-occupied houses - 1 vehicle available (%)
Vehicles available in renter-occupied houses - 2 Vehicles available (%)
Vehicles available in renter-occupied houses - 3 Vehicles available (%)
Vehicles available in renter-occupied houses - 4 Vehicles available (%)
Vehicles available in renter-occupied houses - 5+ Vehicles available (%)
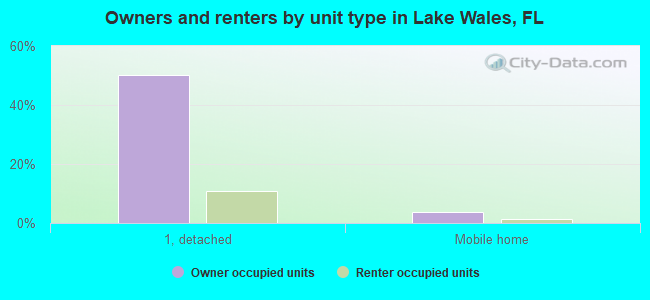
Housing units in structures - 1, detached (%)
Housing units in structures - 1, attached (%)
Housing units in structures - 2 (%)
Housing units in structures - 3 or 4 (%)
Housing units in structures - 5 to 9 (%)
Housing units in structures - 10 to 19 (%)
Housing units in structures - 20 to 49 (%)
Housing units in structures - 50 or more (%)
Housing units in structures - Mobile home (%)
Housing units in structures - Boat, RV, van, etc. (%)
Housing units in structures - Owners - 1, detached (%)
Housing units in structures - Owners - 1, attached (%)
Housing units in structures - Owners - 2 (%)
Housing units in structures - Owners - 3 or 4 (%)
Housing units in structures - Owners - 5 to 9 (%)
Housing units in structures - Owners - 10 to 19 (%)
Housing units in structures - Owners - 20 to 49 (%)
Housing units in structures - Owners - 50 or more (%)
Housing units in structures - Owners - Mobile home (%)
Housing units in structures - Owners - Boat, RV, van, etc. (%)
Housing units in structures - Renters - 1, detached (%)
Housing units in structures - Renters - 1, attached (%)
Housing units in structures - Renters - 2 (%)
Housing units in structures - Renters - 3 or 4 (%)
Housing units in structures - Renters - 5 to 9 (%)
Housing units in structures - Renters - 10 to 19 (%)
Housing units in structures - Renters - 20 to 49 (%)
Housing units in structures - Renters - 50 or more (%)
Housing units in structures - Renters - Mobile home (%)
Housing units in structures - Renters - Boat, RV, van, etc. (%)
House/condo owner moved in on average (years ago)
Renter moved in on average (years ago)
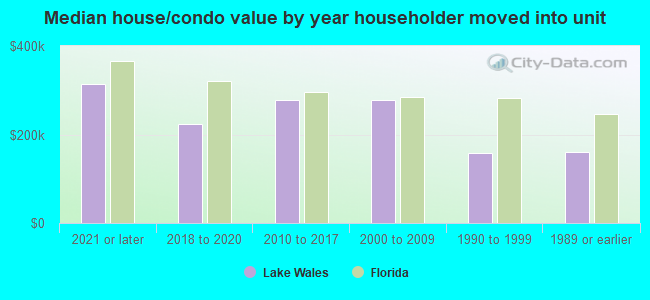
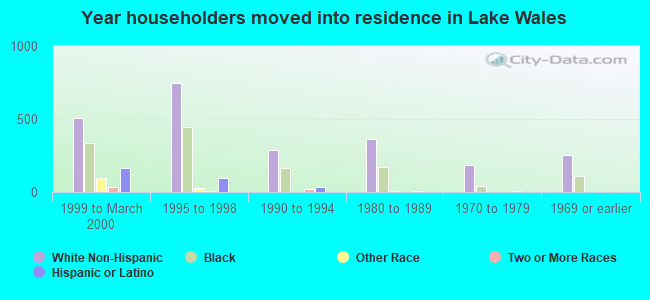
Year householder moved into unit - Moved in 1999 to March 2000 (%)
Year householder moved into unit - Moved in 1999 to March 2000 (%) - White
Year householder moved into unit - Moved in 1999 to March 2000 (%) - Black or African American
Year householder moved into unit - Moved in 1999 to March 2000 (%) - Asian
Year householder moved into unit - Moved in 1999 to March 2000 (%) - Hispanic or Latino
Year householder moved into unit - Moved in 1999 to March 2000 (%) - American Indian and Alaska Native
Year householder moved into unit - Moved in 1999 to March 2000 (%) - Multirace
Year householder moved into unit - Moved in 1999 to March 2000 (%) - Other Race
Year householder moved into unit - Moved in 1995 to 1998 (%)
Year householder moved into unit - Moved in 1995 to 1998 (%) - White
Year householder moved into unit - Moved in 1995 to 1998 (%) - Black or African American
Year householder moved into unit - Moved in 1995 to 1998 (%) - Asian
Year householder moved into unit - Moved in 1995 to 1998 (%) - Hispanic or Latino
Year householder moved into unit - Moved in 1995 to 1998 (%) - American Indian and Alaska Native
Year householder moved into unit - Moved in 1995 to 1998 (%) - Multirace
Year householder moved into unit - Moved in 1995 to 1998 (%) - Other Race
Year householder moved into unit - Moved in 1990 to 1994 (%)
Year householder moved into unit - Moved in 1990 to 1994 (%) - White
Year householder moved into unit - Moved in 1990 to 1994 (%) - Black or African American
Year householder moved into unit - Moved in 1990 to 1994 (%) - Asian
Year householder moved into unit - Moved in 1990 to 1994 (%) - Hispanic or Latino
Year householder moved into unit - Moved in 1990 to 1994 (%) - American Indian and Alaska Native
Year householder moved into unit - Moved in 1990 to 1994 (%) - Multirace
Year householder moved into unit - Moved in 1990 to 1994 (%) - Other Race
Year householder moved into unit - Moved in 1980 to 1989 (%)
Year householder moved into unit - Moved in 1980 to 1989 (%) - White
Year householder moved into unit - Moved in 1980 to 1989 (%) - Black or African American
Year householder moved into unit - Moved in 1980 to 1989 (%) - Asian
Year householder moved into unit - Moved in 1980 to 1989 (%) - Hispanic or Latino
Year householder moved into unit - Moved in 1980 to 1989 (%) - American Indian and Alaska Native
Year householder moved into unit - Moved in 1980 to 1989 (%) - Multirace
Year householder moved into unit - Moved in 1980 to 1989 (%) - Other Race
Year householder moved into unit - Moved in 1970 to 1979 (%)
Year householder moved into unit - Moved in 1970 to 1979 (%) - White
Year householder moved into unit - Moved in 1970 to 1979 (%) - Black or African American
Year householder moved into unit - Moved in 1970 to 1979 (%) - Asian
Year householder moved into unit - Moved in 1970 to 1979 (%) - Hispanic or Latino
Year householder moved into unit - Moved in 1970 to 1979 (%) - American Indian and Alaska Native
Year householder moved into unit - Moved in 1970 to 1979 (%) - Multirace
Year householder moved into unit - Moved in 1970 to 1979 (%) - Other Race
Year householder moved into unit - Moved in 1969 or earlier (%)
Year householder moved into unit - Moved in 1969 or earlier (%) - White
Year householder moved into unit - Moved in 1969 or earlier (%) - Black or African American
Year householder moved into unit - Moved in 1969 or earlier (%) - Asian
Year householder moved into unit - Moved in 1969 or earlier (%) - Hispanic or Latino
Year householder moved into unit - Moved in 1969 or earlier (%) - American Indian and Alaska Native
Year householder moved into unit - Moved in 1969 or earlier (%) - Multirace
Year householder moved into unit - Moved in 1969 or earlier (%) - Other Race
Housing units lacking complete plumbing facilities (%)
Housing units lacking complete kitchen facilities (%)
House heating fuel used in houses and condos - Utility gas (%)
House heating fuel used in houses and condos - Bottled, tank, or LP gas (%)
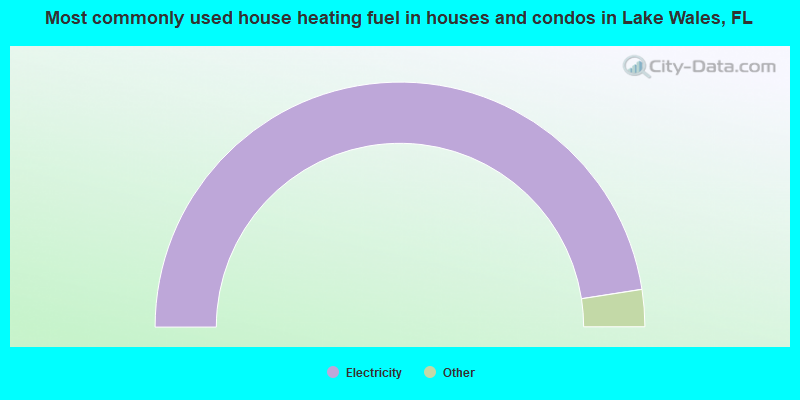
House heating fuel used in houses and condos - Electricity (%)
House heating fuel used in houses and condos - Fuel oil, kerosene, etc. (%)
House heating fuel used in houses and condos - Coal or coke (%)
House heating fuel used in houses and condos - Wood (%)
House heating fuel used in houses and condos - Solar energy (%)
House heating fuel used in houses and condos - Other fuel (%)
House heating fuel used in houses and condos - No fuel used (%)
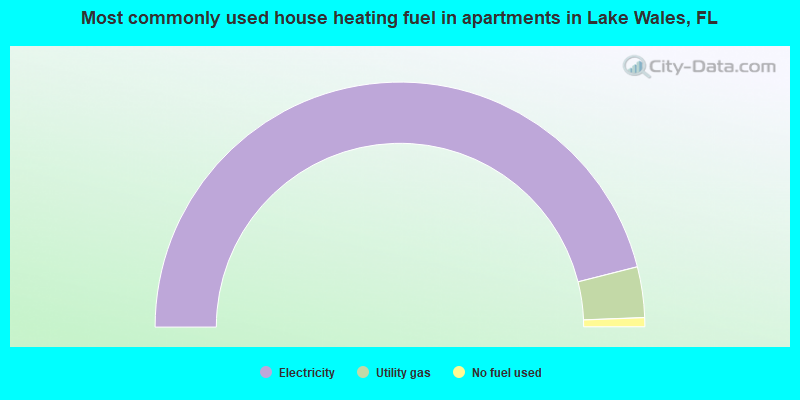
House heating fuel used in apartments - Utility gas (%)
House heating fuel used in apartments - Bottled, tank, or LP gas (%)
House heating fuel used in apartments - Electricity (%)
House heating fuel used in apartments - Fuel oil, kerosene, etc. (%)
House heating fuel used in apartments - Coal or coke (%)
House heating fuel used in apartments - Wood (%)
House heating fuel used in apartments - Solar energy (%)
House heating fuel used in apartments - Other fuel (%)
House heating fuel used in apartments - No fuel used (%)
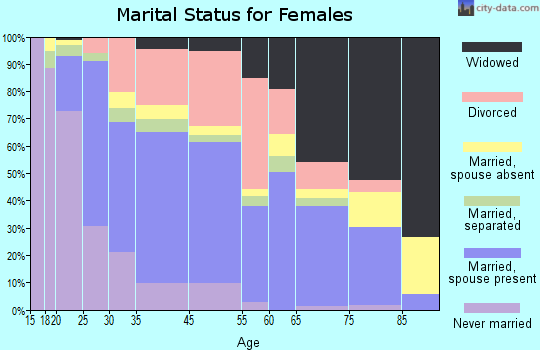
Median year house/condo built: 2002Median year apartment built: 1983Household type by relationship:
Households: 17,598
Male householders: 2,922 (996 living alone ), Female householders: 4,279 (1,286 living alone )3,176 spouses (3,157 opposite-sex spouses ), 688 unmarried partners , (688 opposite-sex unmarried partners ), 4,530 children (4,120 natural , 150 adopted , 258 stepchildren ), 567 grandchildren , 139 brothers or sisters , 162 parents , 0 foster children , 247 other relatives , 424 non-relatives In group quarters: 459
Size of family households: 2,382 2-persons , 752 3-persons , 585 4-persons , 594 5-persons , 146 6-persons , 46 7-or-more-persons .
Size of nonfamily households: 2,481 1-person , 407 2-persons , 20 3-persons , 43 4-persons .
1,986 married couples with children. single-parent households (62 men , 954 women ).
74.6% of residents of Lake Wales speak English at home. of residents speak Spanish at home (54% speak English very well , 21% speak English well , 14% speak English not well , 12% don't speak English at all ).of residents speak other Indo-European language at home (96% speak English very well , 4% speak English not well ).of residents speak Asian or Pacific Island language at home (42% speak English very well , 58% speak English not well ).of residents speak other language at home (100% speak English very well ).
Foreign born population: 2,067 (11.7%)of them are naturalized citizens )
Median number of rooms in houses and condos:
Median number of rooms in apartments
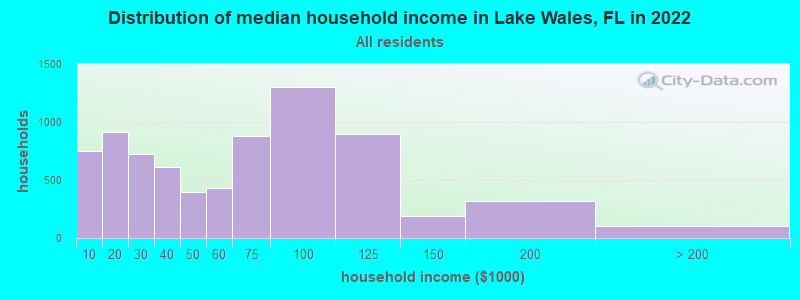
Lake Wales, FL household income distribution 753 Less than $10,000918 $10,000 to $19,999724 $20,000 to $29,999614 $30,000 to $39,999398 $40,000 to $49,999435 $50,000 to $59,999877 $60,000 to $74,9991,302 $75,000 to $99,999893 $100,000 to $124,999187 $125,000 to $149,999320 $150,000 to $199,999100 $200,000 or more
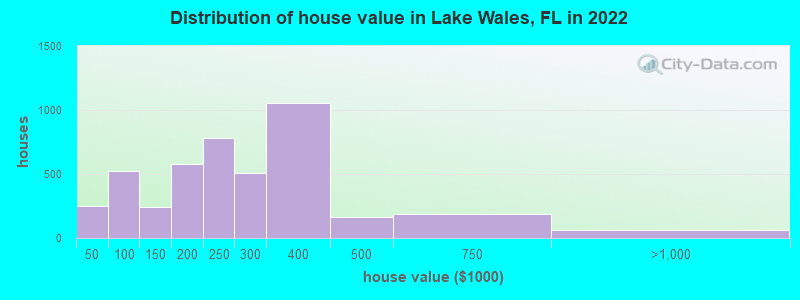
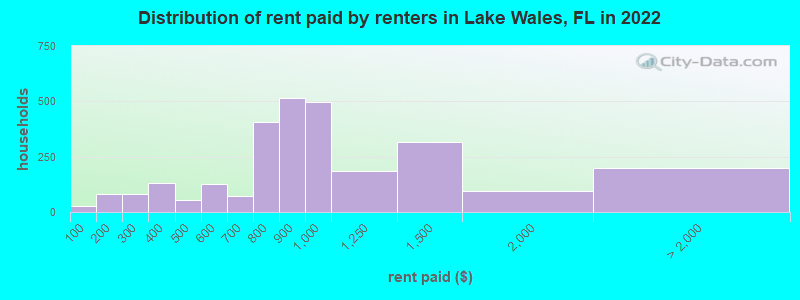
Home value of owner - occupied houses in 2022 in Lake Wales, FL 28 Less than $10,0005 $10,000 to $14,99965 $20,000 to $24,99948 $30,000 to $34,99939 $35,000 to $39,99963 $40,000 to $49,99983 $50,000 to $59,99993 $60,000 to $69,999129 $70,000 to $79,999146 $80,000 to $89,9996 $90,000 to $99,999183 $100,000 to $124,99962 $125,000 to $149,999264 $150,000 to $174,999311 $175,000 to $199,999782 $200,000 to $249,999510 $250,000 to $299,9991,055 $300,000 to $399,999162 $400,000 to $499,999190 $500,000 to $749,99948 $750,000 to $999,99910 $2,000,000 or moreRent paid by renters in 2022 in Lake Wales, FL 27 Less than $10032 $100 to $14946 $150 to $19980 $200 to $24987 $300 to $34945 $350 to $39938 $400 to $44915 $450 to $499108 $500 to $54917 $550 to $59917 $600 to $64956 $650 to $699137 $700 to $749269 $750 to $799515 $800 to $899498 $900 to $999185 $1,000 to $1,249317 $1,250 to $1,49994 $1,500 to $1,99971 $2,000 to $2,49921 $3,000 to $3,499105 No cash rent
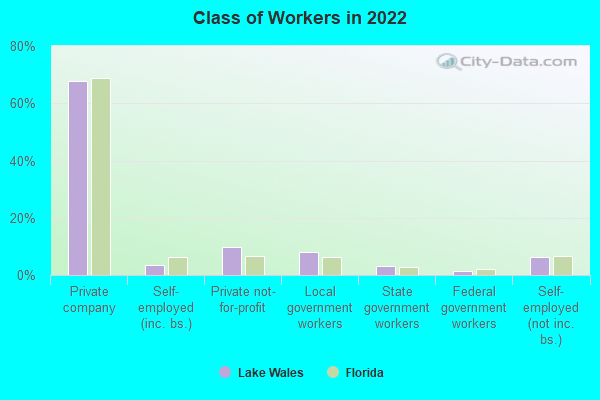
Percentage of workers working in this county: 89.2%Number of people working at home: 407 (6.2% of all workers )
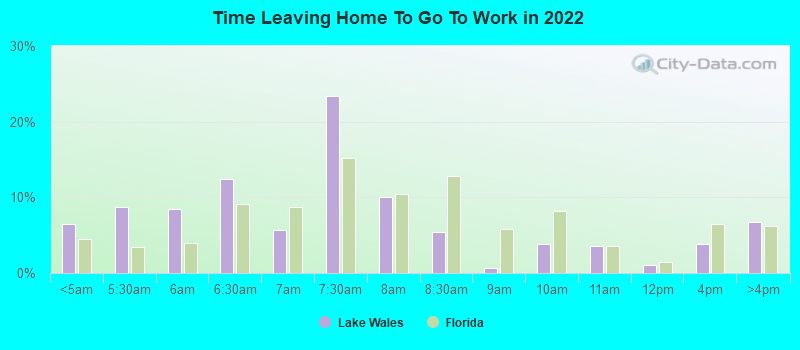
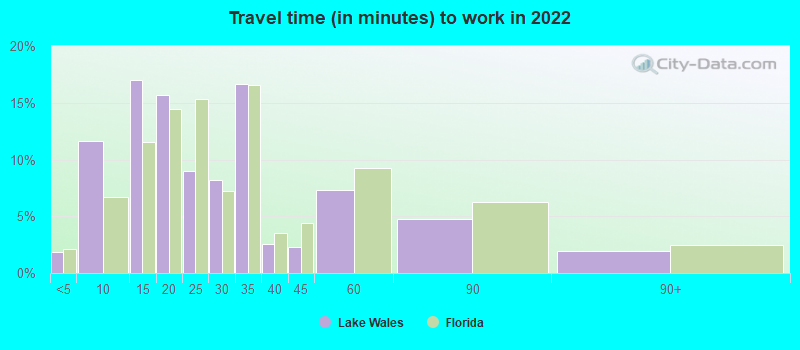
Travel time to work (commute)
Less than 5 minutes: 1625 to 9 minutes: 61310 to 14 minutes: 85015 to 19 minutes: 88420 to 24 minutes: 41525 to 29 minutes: 42430 to 34 minutes: 1,11735 to 39 minutes: 23140 to 44 minutes: 21045 to 59 minutes: 38360 to 89 minutes: 49190 or more minutes: 265
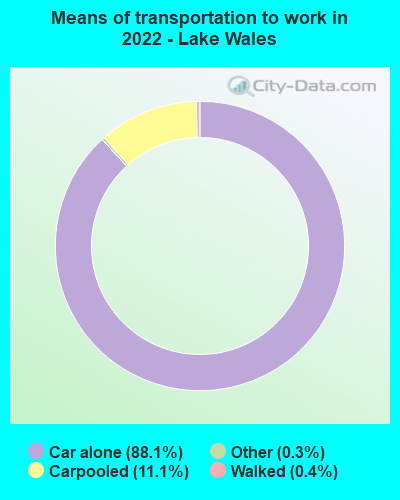
Means of transportation to work:
Drove a car alone: 7,828 (82.5%)Carpooled: 835 (8.8%)Bus : 1 (0.0%)Taxi: 33 (0.3%)Bicycle: 1 (0.0%)Walked: 48 (0.5%)Worked at home: 407 (4.3%)
Unemployment by race in 2022
Unemployment rate for White non-Hispanic residents 5.8% Males2.6% FemalesUnemployment rate for Black residents 7.7% Males15.4% FemalesUnemployment rate for Asian residents 100.0% MalesUnemployment rate for other race residents 6.8% FemalesUnemployment rate for two or more race residents 2.7% Males3.1% FemalesUnemployment rate for Hispanic or Latino residents 4.1% Females
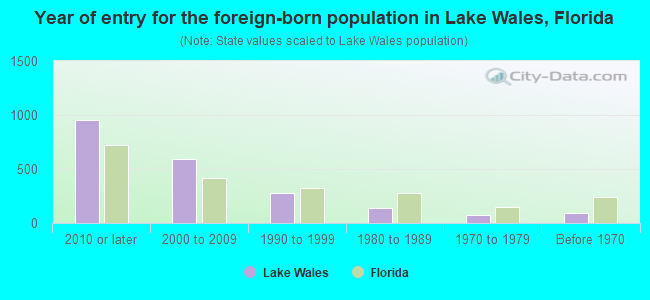
Year of entry for the foreign-born population in Lake Wales, Florida
955 2010 or later 595 2000 to 2009 274 1990 to 1999 142 1980 to 1989 70 1970 to 1979 89 Before 1970
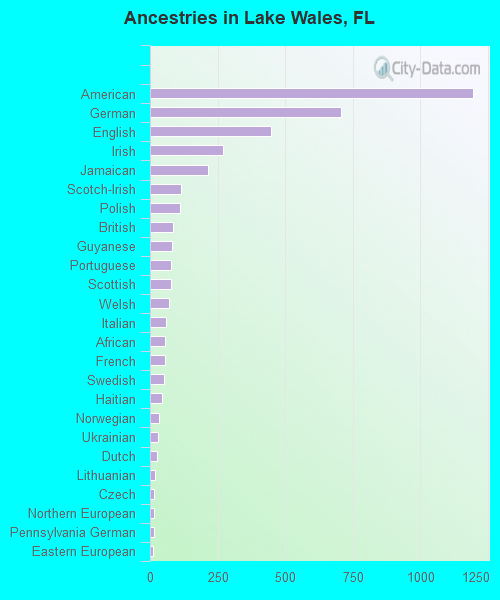
First ancestries reported:
American: 1,194 (12.6%)
German: 706 (7.5%)
English: 447 (4.7%)
Irish: 271 (2.9%)
Jamaican: 213 (2.2%)
Scotch-Irish: 114 (1.2%)
Polish: 111 (1.2%)
British: 85 (0.9%)
Guyanese: 82 (0.9%)
Portuguese: 77 (0.8%)
Scottish: 77 (0.8%)
Welsh: 69 (0.7%)
Italian: 58 (0.6%)
African: 55 (0.6%)
French: 54 (0.6%)
Swedish: 51 (0.5%)
Haitian: 45 (0.5%)
Norwegian: 33 (0.3%)
Ukrainian: 29 (0.3%)
Dutch: 27 (0.3%)
Lithuanian: 17 (0.2%)
Czech: 16 (0.2%)
Northern European: 15 (0.2%)
Pennsylvania German: 14 (0.1%)
Eastern European: 12 (0.1%)
Romanian: 11 (0.1%)
Danish: 10 (0.1%)
Bahamian: 10 (0.1%)
Croatian: 9 (0.10%)
Iranian: 9 (0.10%)
European: 8 (0.08%)
Hungarian: 6 (0.06%) Most common places of birth for foreign-born residents (%): Mexico Lake Wales:
28.2% (500)Florida:
5.6% (257,152)
Cuba Lake Wales:
18.5% (328)Florida:
22.0% (1,006,576)
Honduras Lake Wales:
10.7% (189)Florida:
2.3% (107,160)
Jamaica Lake Wales:
8.2% (146)Florida:
5.0% (227,319)
Venezuela Lake Wales:
8.1% (143)Florida:
5.7% (262,042)
United Kingdom, excluding England and Scotland Lake Wales:
2.9% (52)Florida:
0.7% (34,227)
Portugal Lake Wales:
2.8% (50)Florida:
0.2% (9,493)
Haiti Lake Wales:
2.7% (48)Florida:
7.5% (342,375)
Nicaragua Lake Wales:
1.8% (31)Florida:
2.3% (105,066)
Place of birth for U.S.-born residents:
This state: 6,698Other state: 7,713Northeast: 3,034Midwest: 2,328South: 2,095West: 191 89.2% of Lake Wales residents lived in the same house 1 years ago.
Out of people who lived in different houses, 35.9% lived in this county.
Out of people who lived in different counties, 37.1% lived in Florida.
Lake Wales:
89.2%State average:
86.3%
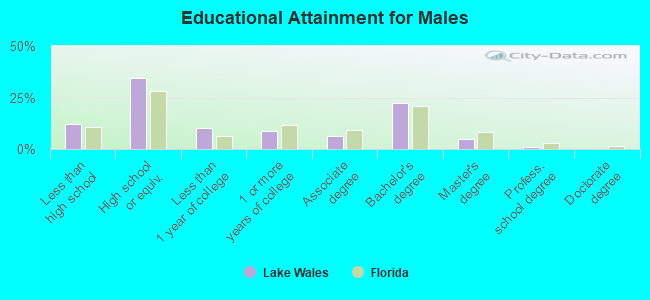
Education attainment for males 25 years and older:
No schooling: 128Nursery to 4th grade: 85th and 6th grade: 1107th and 8th grade: 479th grade: 10010th grade: 16311th grade: 5812th grade, no diploma: 94High school graduate (or equivalency): 2,029Less than 1 year of college: 594Some college more than 1 year, no degree: 520Associate degree: 369Bachelor's degree: 1,318Master's degree: 278Professional school degree: 64Doctorate degree: 0
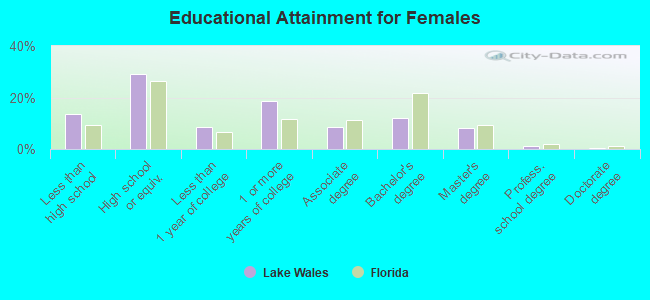
Education attainment for females 25 years and older:
No schooling: 147Nursery to 4th grade: 825th and 6th grade: 1167th and 8th grade: 869th grade: 10910th grade: 4411th grade: 28212th grade, no diploma: 66High school graduate (or equivalency): 2,022Less than 1 year of college: 577Some college more than 1 year, no degree: 1,294Associate degree: 592Bachelor's degree: 819Master's degree: 574Professional school degree: 74Doctorate degree: 21
Housing units in structures:
One, detached: 5,810One, attached: 167Two: 5033 or 4: 5595 to 9: 61610 to 19: 27520 to 49: 19450 or more: 182Mobile homes: 401Median worth of mobile homes: $68,518
Housing units lacking complete plumbing facilities in 2022: 0.4%Housing units lacking complete kitchen facilities in 2022: 1.6%House/condo owner moved in on average 6 years ago
Renter moved in on average 1 years ago
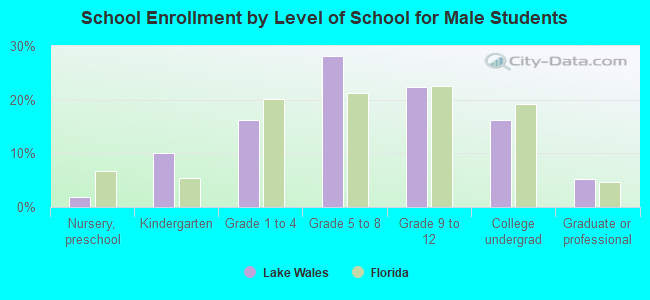
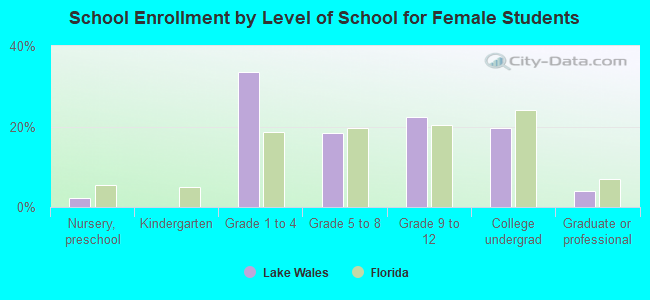
Private vs. public school enrollment:
Students in private schools in grades 1 to 8 (elementary and middle school): 125 Students in private schools in grades 9 to 12 (high school): 131 Students in private undergraduate colleges: 146