Lansdale, PA (Pennsylvania) Houses and Residents
| Lansdale: | $314,877 |
| Pennsylvania: | $245,500 |
Mean price in 2022:
Detached houses: $389,430
Here: $389,430 State: $317,202 Townhouses or other attached units: $297,930
Here: $297,930 State: $254,369 In 2-unit structures: $593,506
Here: $593,506 State: $249,182 In 3-to-4-unit structures: $319,206
Here: $319,206 State: $297,446 In 5-or-more-unit structures: $431,128
Here: $431,128 State: $320,068
Total population: 16,487 (Urban population: 16,071, Rural population: 0)
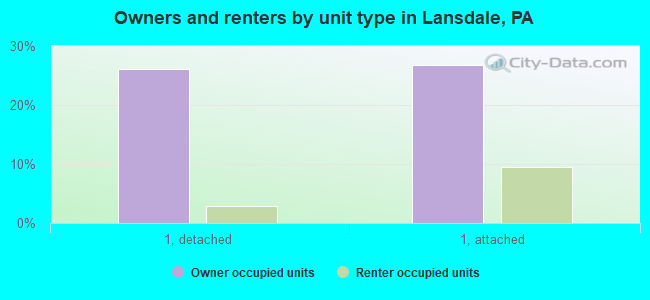
Houses: 7,470 (7,207 occupied: 4,116 owner occupied, 3,137 renter occupied)
| % of renters here: | 43% |
| State: | 31% |
Housing density: 2,438 houses/condos per square mile
Median price asked for vacant for-sale houses and condos in 2022: $255,144.
Median contract rent in 2022: $1,225 (lower quartile is $949, upper quartile is $1,517)
Median rent asked for vacant for-rent units in 2022: $1,408
Median gross rent in Lansdale, PA in 2022: $1,413
Housing units in Lansdale with a mortgage: 2,797 (373 second mortgage, 9 home equity loan, 296 both second mortgage and home equity loan)
Houses without a mortgage: 135
Median household income for houses/condos with a mortgage: $121,589
Median household income for apartments without a mortgage: $65,199
Median monthly housing costs: $1,430
Compare current foreclosures in Lansdale, PA:
| Photo | Address | Area | Beds / Baths | Price | Details |
|---|---|---|---|---|---|

|
#1
State St
Lansdale, PA 19446
|
1,260 sq. feet
|
1 baths 3 beds |
show details | |

|
#2
Birch St
Lansdale, PA 19446
|
1,352 sq. feet
|
1 baths 3 beds |
show details | |

|
#3
E 7th St
Lansdale, PA 19446
|
2,000 sq. feet
|
2 baths 4 beds |
show details | |

|
#4
W Mount Vernon St
Lansdale, PA 19446
|
1,824 sq. feet
|
1 baths 3 beds |
show details | |

|
#5
Supplee Rd
Lansdale, PA 19446
|
2,288 sq. feet
|
2 baths 4 beds |
show details | |

|
#6
Hill Rd
Lansdale, PA 19446
|
1,673 sq. feet
|
2 baths 3 beds |
show details | |

|
#7
Pheasant Hill Rd
Lansdale, PA 19446
|
2,205 sq. feet
|
2 baths 4 beds |
show details | |

|
#8
Wedgewood Dr
Lansdale, PA 19446
|
1,322 sq. feet
|
1 baths 3 beds |
show details | |

|
#9
Cherry St
Lansdale, PA 19446
|
1,430 sq. feet
|
1 baths 3 beds |
show details | |

|
#10
Forrest Ave
Lansdale, PA 19446
|
1,704 sq. feet
|
2 baths 4 beds |
show details |
| Photo | Address | Area | Beds / Baths | Price | Details |
|---|---|---|---|---|---|

|
#11
S Broad St
Lansdale, PA 19446
|
2,328 sq. feet
|
2 baths 4 beds |
show details | |

|
#12
Saint Andrews Way
Lansdale, PA 19446
|
1,746 sq. feet
|
1 baths 4 beds |
show details | |

|
#13
Christopher Ct
Lansdale, PA 19446
|
1,400 sq. feet
|
1 baths 3 beds |
show details | |

|
#14
Beechwood Dr
Lansdale, PA 19446
|
1,444 sq. feet
|
1 baths 3 beds |
show details | |

|
#15
Lansdale Ave
Lansdale, PA 19446
|
3,241 sq. feet
|
3 baths 4 beds |
show details | |

|
#16
Flintlock Cir
Lansdale, PA 19446
|
1,955 sq. feet
|
2 baths 4 beds |
show details | |

|
#17
Deep Meadow Ln
Lansdale, PA 19446
|
4,967 sq. feet
|
2 baths 4 beds |
show details | |

|
#18
Crescent Ave
Lansdale, PA 19446
|
1,032 sq. feet
|
1 baths 2 beds |
show details | |

|
#19
W Lawn Ave
Lansdale, PA 19446
|
1,986 sq. feet
|
2 baths 4 beds |
show details | |

|
#20
Columbia Ave
Lansdale, PA 19446
|
1,904 sq. feet
|
1 baths 3 beds |
show details |
| Photo | Address | Area | Beds / Baths | Price | Details |
|---|---|---|---|---|---|

|
#21
Stratford Ct
Lansdale, PA 19446
|
1,180 sq. feet
|
2 baths 2 beds |
show details | |

|
#22
Fulton Ave
Lansdale, PA 19446
|
2,668 sq. feet
|
2 baths 4 beds |
show details | |

|
#23
Parade Field Way
Lansdale, PA 19446
|
- sq. feet
|
- baths - beds |
show details | |

|
#24
Browning Ct
Lansdale, PA 19446
|
- sq. feet
|
- baths - beds |
show details | |

|
#25
W Main St # 409
Lansdale, PA 19446
|
- sq. feet
|
- baths - beds |
show details | |

|
#26
Providence Ln
Lansdale, PA 19446
|
- sq. feet
|
- baths - beds |
show details | |

|
#27
N Madison Ave # C303
Lansdale, PA 19446
|
- sq. feet
|
- baths - beds |
show details | |

|
#28
Deep Meadow Ln
Lansdale, PA 19446
|
- sq. feet
|
- baths - beds |
show details | |

|
#29
Braeburn Ter
Lansdale, PA 19446
|
- sq. feet
|
- baths - beds |
show details | |

|
#30
W 3rd St Apt 5
Lansdale, PA 19446
|
- sq. feet
|
- baths - beds |
show details |
| Photo | Address | Area | Beds / Baths | Price | Details |
|---|---|---|---|---|---|

|
#31
Crosshill Ct
Lansdale, PA 19446
|
- sq. feet
|
- baths - beds |
show details | |

|
#32
N Line St
Lansdale, PA 19446
|
- sq. feet
|
- baths - beds |
show details | |

|
#33
Snyder Rd Apt C27
Lansdale, PA 19446
|
- sq. feet
|
- baths - beds |
show details | |

|
#34
Cricklewood Cir
Lansdale, PA 19446
|
- sq. feet
|
- baths - beds |
show details | |

|
#35
W Main St
Lansdale, PA 19446
|
- sq. feet
|
- baths - beds |
show details | |

|
Check over 1 million property listings on Foreclosure.com!
|
browse all offers | |||

Latest news about housing in Lansdale, PA collected exclusively by city-data.com from local newspapers, TV, and radio stations


Median year apartment built: 1963
Household type by relationship:
Households: 18,908- Male householders: 4,030 (1,026 living alone), Female householders: 3,172 (796 living alone)
3,448 spouses (3,440 opposite-sex spouses), 699 unmarried partners, (656 opposite-sex unmarried partners), 5,428 children (5,137 natural, 98 adopted, 191 stepchildren), 165 grandchildren, 249 brothers or sisters, 391 parents, 71 foster children, 437 other relatives, 405 non-relatives
- In group quarters: 407
Size of family households: 2,054 2-persons, 1,035 3-persons, 1,009 4-persons, 386 5-persons, 106 6-persons, 167 7-or-more-persons.
Size of nonfamily households: 1,877 1-person, 637 2-persons, 10 3-persons.
2,509 married couples with children.
1,120 single-parent households (309 men, 811 women).
75.6% of residents of Lansdale speak English at home.
4.4% of residents speak Spanish at home (27% speak English very well, 10% speak English well, 27% speak English not well, 36% don't speak English at all).
12.5% of residents speak other Indo-European language at home (59% speak English very well, 27% speak English well, 11% speak English not well, 2% don't speak English at all).
5.0% of residents speak Asian or Pacific Island language at home (27% speak English very well, 29% speak English well, 26% speak English not well, 18% don't speak English at all).
1.9% of residents speak other language at home (38% speak English very well, 34% speak English well, 28% speak English not well).
Foreign born population: 3,468 (18.3%)
(52.0% of them are naturalized citizens)
| Here: | 6.7 |
| State: | 6.8 |
| Here: | 3.9 |
| State: | 4.3 |
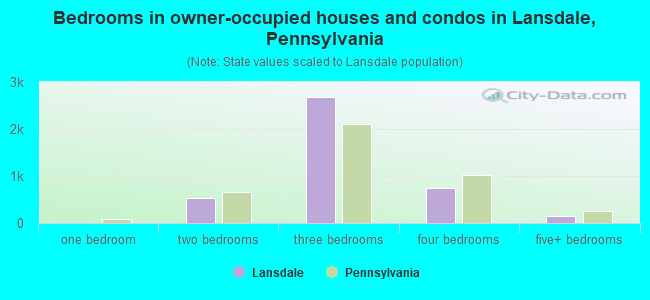
- Bedrooms in owner-occupied houses and condos in Lansdale, Pennsylvania
- 0no bedroom
- 01 bedroom
- 5282 bedrooms
- 2,6853 bedrooms
- 7544 bedrooms
- 1485+ bedrooms
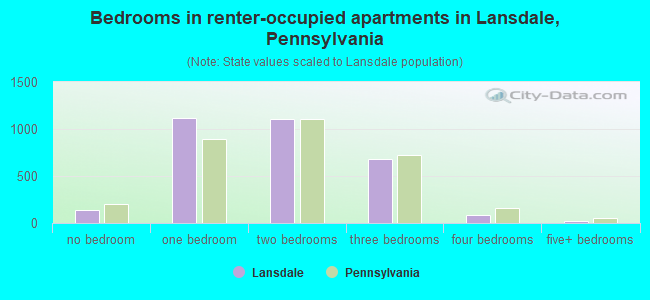
- Bedrooms in renter-occupied apartments in Lansdale, Pennsylvania
- 134no bedroom
- 1,1151 bedroom
- 1,1022 bedrooms
- 6793 bedrooms
- 894 bedrooms
- 175+ bedrooms
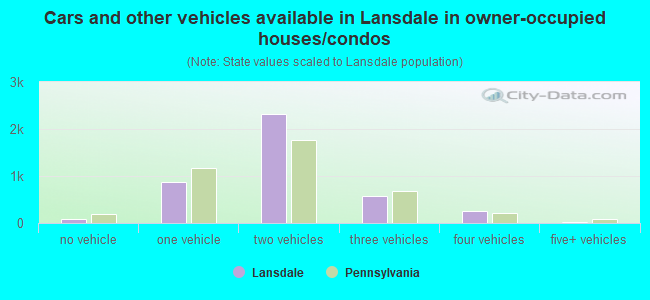
- Cars and other vehicles available in Lansdale in owner-occupied houses/condos
- 76no vehicle
- 8731 vehicle
- 2,3192 vehicles
- 5683 vehicles
- 2524 vehicles
- 265+ vehicles
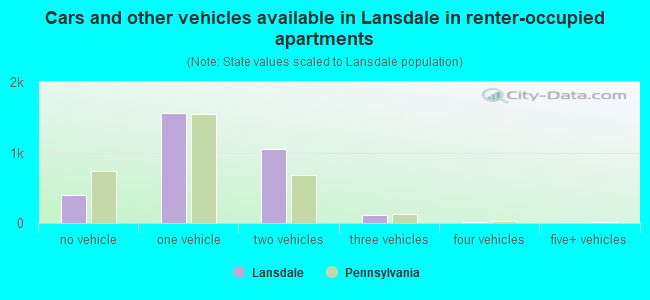
- Cars and other vehicles available in Lansdale in renter-occupied apartments
- 391no vehicle
- 1,5671 vehicle
- 1,0562 vehicles
- 1123 vehicles
- 114 vehicles
- 05+ vehicles
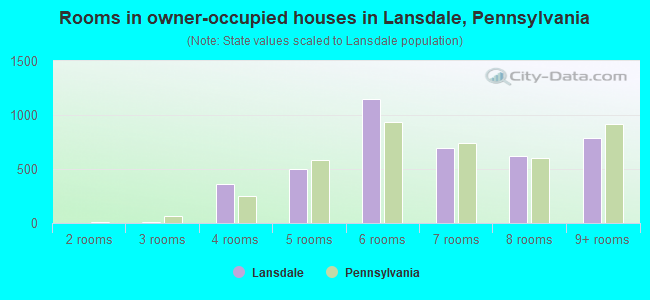
- Rooms in owner-occupied houses in Lansdale, Pennsylvania
- 01 room
- 02 rooms
- 133 rooms
- 3574 rooms
- 5025 rooms
- 1,1506 rooms
- 6927 rooms
- 6168 rooms
- 7859+ rooms
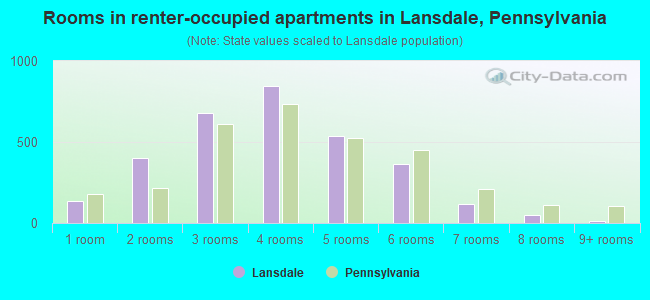
- Rooms in renter-occupied apartments in Lansdale, Pennsylvania
- 1341 room
- 4012 rooms
- 6773 rooms
- 8454 rooms
- 5405 rooms
- 3646 rooms
- 1177 rooms
- 508 rooms
- 109+ rooms
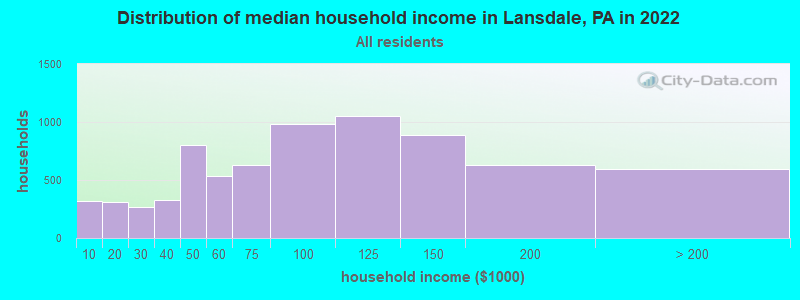
Lansdale, PA household income distribution

- 322Less than $10,000
- 307$10,000 to $19,999
- 268$20,000 to $29,999
- 331$30,000 to $39,999
- 805$40,000 to $49,999
- 534$50,000 to $59,999
- 626$60,000 to $74,999
- 981$75,000 to $99,999
- 1,048$100,000 to $124,999
- 885$125,000 to $149,999
- 626$150,000 to $199,999
- 595$200,000 or more
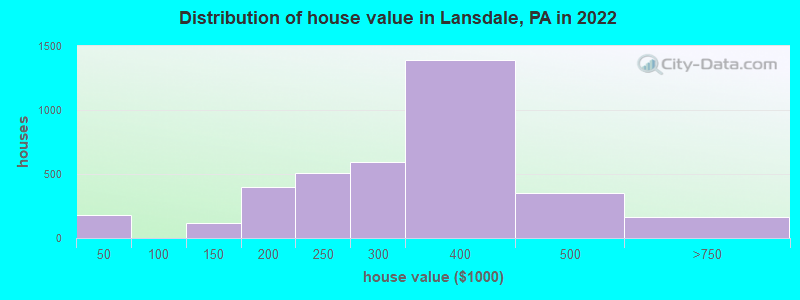
Home value of owner - occupied houses in 2022 in Lansdale, PA
-
- 45Less than $10,000
- 17$15,000 to $19,999
- 27$20,000 to $24,999
- 42$25,000 to $29,999
- 49$30,000 to $34,999
- 73$100,000 to $124,999
- 40$125,000 to $149,999
- 230$150,000 to $174,999
- 171$175,000 to $199,999
- 508$200,000 to $249,999
- 590$250,000 to $299,999
- 1,388$300,000 to $399,999
- 350$400,000 to $499,999
- 153$500,000 to $749,999
- 4$750,000 to $999,999
- 2$1,000,000 to $1,499,999
- 5$1,500,000 to $1,999,999
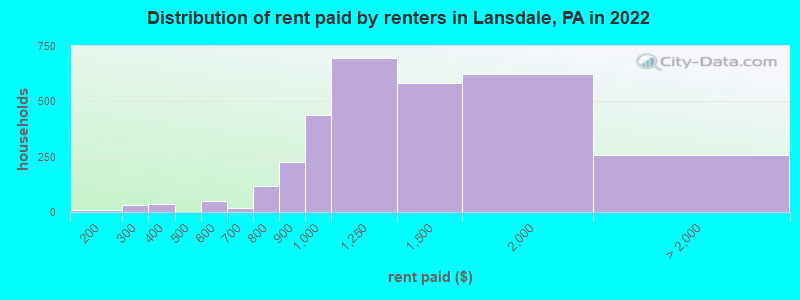
Rent paid by renters in 2022 in Lansdale, PA
-
- 8$150 to $199
- 18$200 to $249
- 11$250 to $299
- 20$300 to $349
- 12$350 to $399
- 45$500 to $549
- 5$550 to $599
- 9$600 to $649
- 10$650 to $699
- 20$700 to $749
- 98$750 to $799
- 225$800 to $899
- 436$900 to $999
- 694$1,000 to $1,249
- 583$1,250 to $1,499
- 625$1,500 to $1,999
- 128$2,000 to $2,499
- 33$2,500 to $2,999
- 93No cash rent
Percentage of workers working in this county: 81.3%
Number of people working at home: 1,703 (16.7% of all workers)
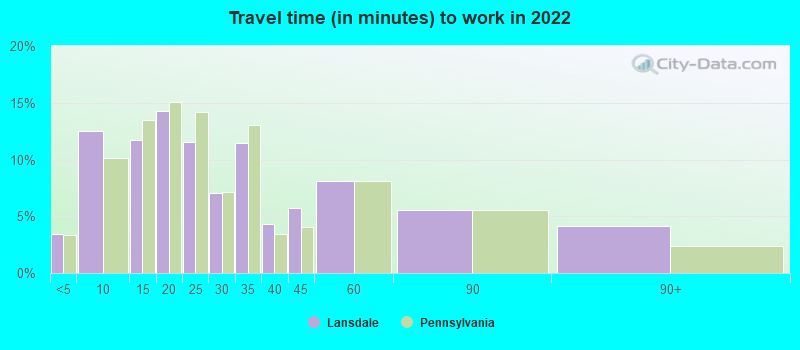
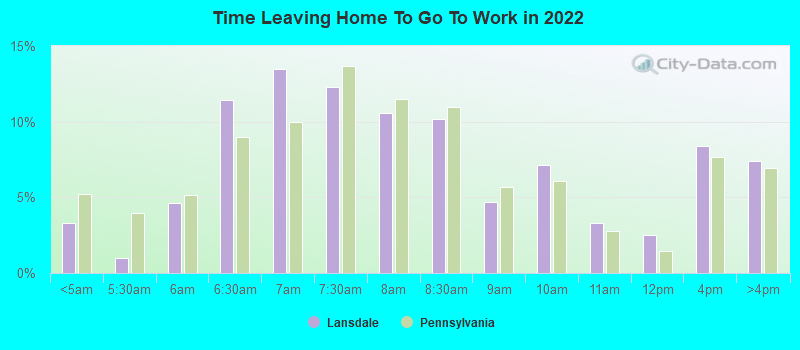
Travel time to work (commute)
- Less than 5 minutes: 437
- 5 to 9 minutes: 970
- 10 to 14 minutes: 1,140
- 15 to 19 minutes: 1,350
- 20 to 24 minutes: 863
- 25 to 29 minutes: 851
- 30 to 34 minutes: 773
- 35 to 39 minutes: 212
- 40 to 44 minutes: 461
- 45 to 59 minutes: 659
- 60 to 89 minutes: 453
- 90 or more minutes: 195
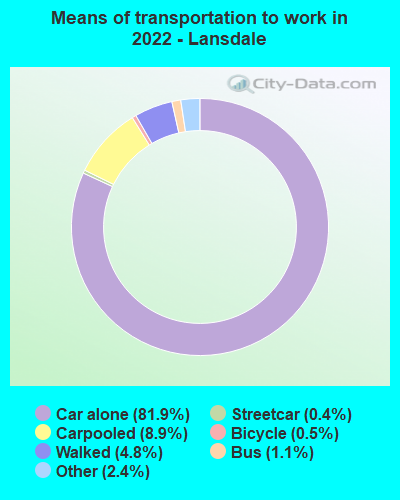
Means of transportation to work:
- Drove a car alone: 6,173 (66.5%)
- Carpooled: 701 (7.6%)
- Bus: 50 (0.5%)
- Subway or elevated rail: 25 (0.3%)
- Taxi: 233 (2.5%)
- Bicycle: 30 (0.3%)
- Walked: 372 (4.0%)
- Worked at home: 1,703 (18.4%)
- Unemployment by race in 2022
- Unemployment rate for White non-Hispanic residents
- 1.7%Males
- 4.8%Females
- Unemployment rate for Black residents
- 0.4%Males
- Unemployment rate for Asian residents
- 1.4%Females
- Unemployment rate for other race residents
- 7.1%Females
- Unemployment rate for two or more race residents
- 7.0%Males
- Unemployment rate for Hispanic or Latino residents
- 3.5%Females
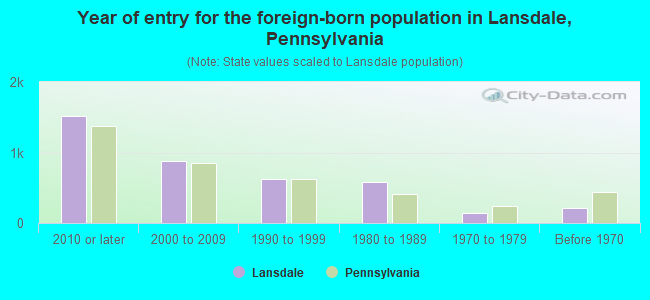
- Year of entry for the foreign-born population in Lansdale, Pennsylvania
- 1,5132010 or later
- 8762000 to 2009
- 6301990 to 1999
- 5801980 to 1989
- 1371970 to 1979
- 207Before 1970
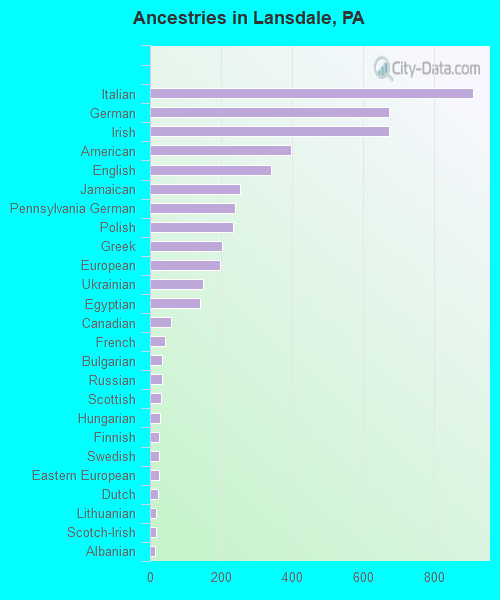
First ancestries reported:
- Italian: 909 (10.4%)
- German: 674 (7.7%)
- Irish: 673 (7.7%)
- American: 396 (4.5%)
- English: 341 (3.9%)
- Jamaican: 253 (2.9%)
- Pennsylvania German: 238 (2.7%)
- Polish: 233 (2.7%)
- Greek: 203 (2.3%)
- European: 198 (2.3%)
- Ukrainian: 150 (1.7%)
- Egyptian: 140 (1.6%)
- Canadian: 58 (0.7%)
- French: 41 (0.5%)
- Bulgarian: 35 (0.4%)
- Russian: 33 (0.4%)
- Scottish: 31 (0.4%)
- Hungarian: 27 (0.3%)
- Finnish: 26 (0.3%)
- Swedish: 25 (0.3%)
- Eastern European: 24 (0.3%)
- Dutch: 22 (0.3%)
- Lithuanian: 18 (0.2%)
- Scotch-Irish: 18 (0.2%)
- Albanian: 15 (0.2%)
- Iranian: 14 (0.2%)
- African: 13 (0.1%)
- Haitian: 13 (0.1%)
- Yugoslavian: 12 (0.1%)
- Portuguese: 8 (0.09%)
- Slovene: 7 (0.08%)
- Northern European: 6 (0.07%)
- Slovak: 4 (0.05%)
- French Canadian: 4 (0.05%)
- British: 3 (0.03%)
Most common places of birth for foreign-born residents (%):
| Lansdale: | 36.9% (1,332) |
| Pennsylvania: | 0.9% (8,772) |
| Lansdale: | 8.7% (314) |
| Pennsylvania: | 0.3% (2,427) |
| Lansdale: | 6.8% (247) |
| Pennsylvania: | 1.0% (9,386) |
| Lansdale: | 6.8% (244) |
| Pennsylvania: | 3.3% (31,542) |
| Lansdale: | 6.4% (232) |
| Pennsylvania: | 1.4% (13,268) |
| Lansdale: | 5.7% (206) |
| Pennsylvania: | 2.9% (27,433) |
| Lansdale: | 5.0% (182) |
| Pennsylvania: | 10.7% (100,596) |
| Lansdale: | 4.8% (173) |
| Pennsylvania: | 2.4% (22,612) |
| Lansdale: | 3.0% (108) |
| Pennsylvania: | 0.6% (5,438) |
| Lansdale: | 2.4% (88) |
| Pennsylvania: | 1.8% (17,032) |
| Lansdale: | 2.4% (87) |
| Pennsylvania: | 0.9% (8,463) |
| Lansdale: | 2.4% (86) |
| Pennsylvania: | 0.8% (7,272) |
| Lansdale: | 2.0% (72) |
| Pennsylvania: | 2.1% (19,841) |
| Lansdale: | 1.6% (59) |
| Pennsylvania: | 0.4% (4,068) |
Place of birth for U.S.-born residents:
- This state: 12,266
- Other state: 2,924
- Northeast: 1,219
- Midwest: 546
- South: 798
- West: 366
90.8% of Lansdale residents lived in the same house 1 years ago.
Out of people who lived in different houses, 30.8% lived in this county.
Out of people who lived in different counties, 61.5% lived in Pennsylvania.
| Lansdale: | 90.8% |
| State average: | 89.3% |
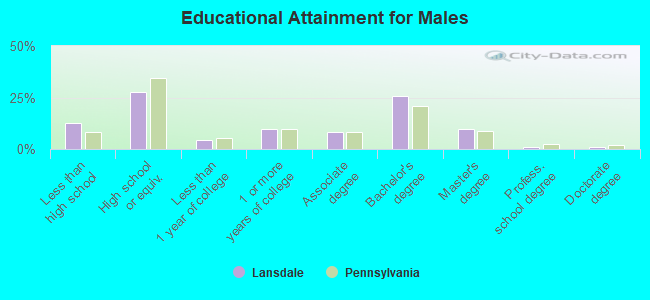
Education attainment for males 25 years and older:
- No schooling: 306
- Nursery to 4th grade: 37
- 5th and 6th grade: 14
- 7th and 8th grade: 21
- 9th grade: 73
- 10th grade: 74
- 11th grade: 59
- 12th grade, no diploma: 245
- High school graduate (or equivalency): 1,817
- Less than 1 year of college: 300
- Some college more than 1 year, no degree: 641
- Associate degree: 535
- Bachelor's degree: 1,666
- Master's degree: 617
- Professional school degree: 58
- Doctorate degree: 50
Education attainment for females 25 years and older:
- No schooling: 339
- Nursery to 4th grade: 50
- 5th and 6th grade: 42
- 7th and 8th grade: 127
- 9th grade: 111
- 10th grade: 53
- 11th grade: 40
- 12th grade, no diploma: 127
- High school graduate (or equivalency): 1,619
- Less than 1 year of college: 482
- Some college more than 1 year, no degree: 565
- Associate degree: 600
- Bachelor's degree: 1,543
- Master's degree: 799
- Professional school degree: 65
- Doctorate degree: 153


Housing units in structures:
- One, detached: 1,977
- One, attached: 2,516
- Two: 726
- 3 or 4: 454
- 5 to 9: 217
- 10 to 19: 571
- 20 to 49: 345
- 50 or more: 661
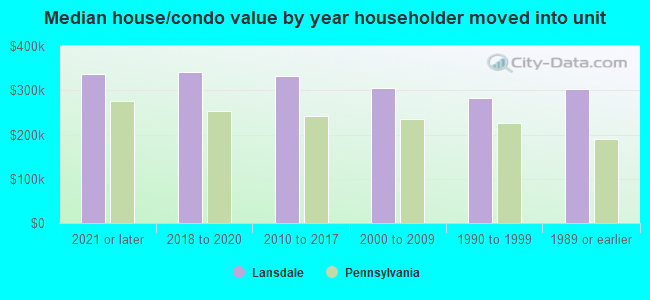
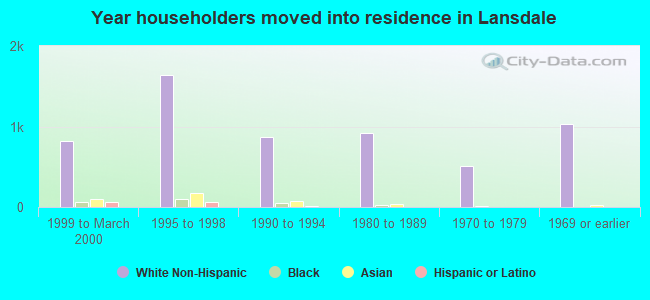
House/condo owner moved in on average 11 years ago
Renter moved in on average 5 years ago
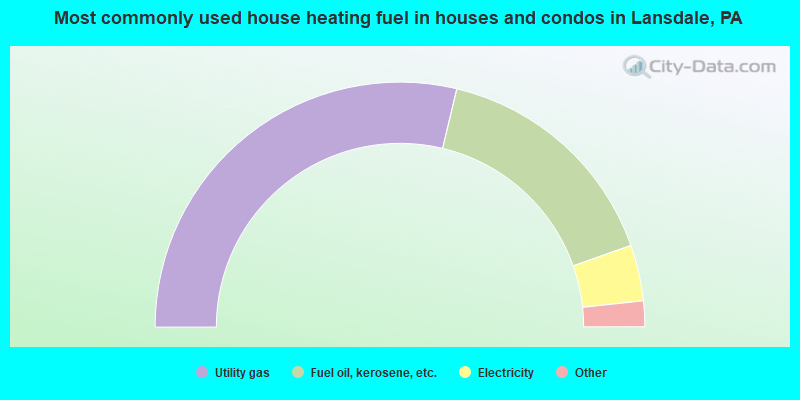
- 57.6%Utility gas
- 31.8%Fuel oil, kerosene, etc.
- 7.4%Electricity
- 2.1%Bottled, tank, or LP gas
- 0.8%Wood
- 0.4%Other fuel
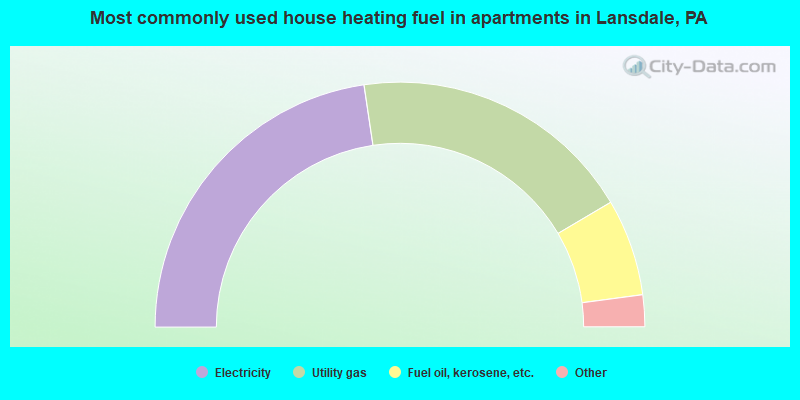
- 45.3%Electricity
- 37.7%Utility gas
- 12.8%Fuel oil, kerosene, etc.
- 1.8%No fuel used
- 1.4%Bottled, tank, or LP gas
- 0.6%Other fuel
- 0.4%Solar energy
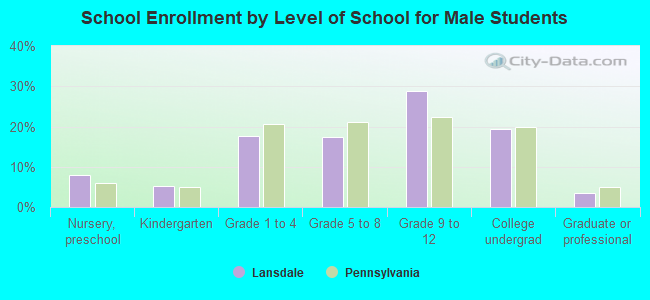
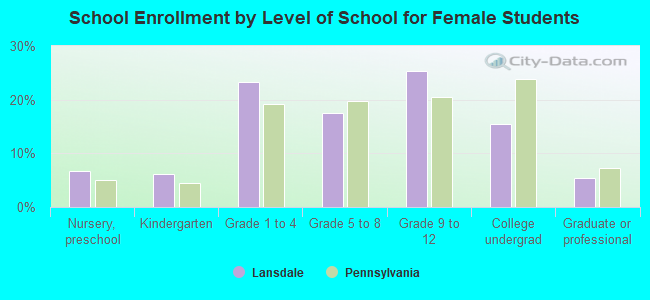
Private vs. public school enrollment:
| Here: | 2.4% |
| Pennsylvania: | 15.7% |
| Here: | 7.5% |
| Pennsylvania: | 13.4% |
| Here: | 14.1% |
| Pennsylvania: | 39.8% |