Las Cruces, NM (New Mexico) Houses and Residents
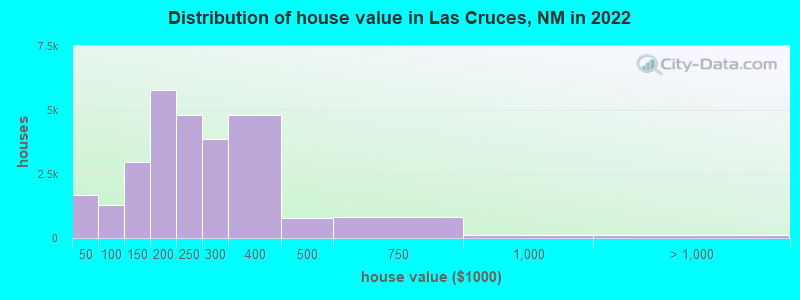
Estimated median house or condo value in 2022: $224,300 (it was $83,700 in 2000 )
Las Cruces:
$224,300New Mexico:
$243,100
Lower value quartile - upper value quartile: $155,900 - $304,000Mean price in 2022: Detached houses: $247,560 Here:
$247,560State:
$322,045
Townhouses or other attached units: $176,691 Here:
$176,691State:
$284,053
In 2-unit structures: $257,275 Here:
$257,275State:
$354,971
In 3-to-4-unit structures: $187,307 Here:
$187,307State:
$235,720
In 5-or-more-unit structures: $228,930 Here:
$228,930State:
$217,304
Mobile homes: $290,799 Here:
$290,799State:
$117,675
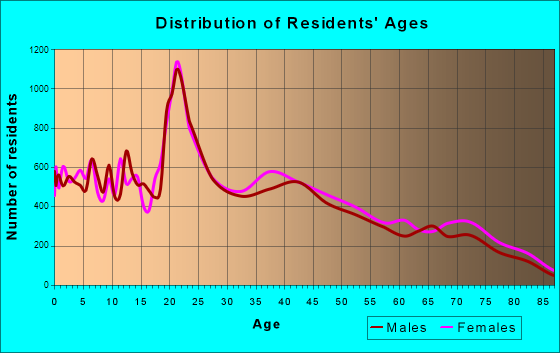
Total population: 101,408 (Urban population: 74,187, Rural population: 296 (all nonfarm) )
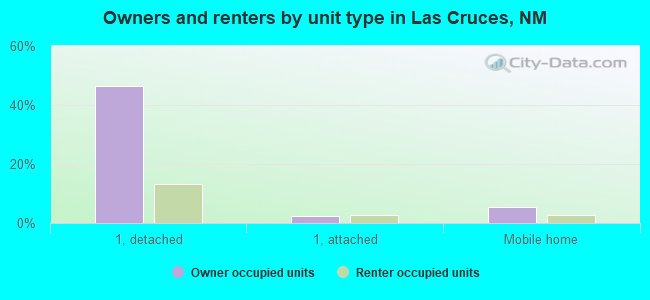
Houses: 50,454 (47,379 occupied: 26,682 owner occupied, 20,697 renter occupied )
% of renters here:
44%State:
29%
Housing density: 969 houses/condos per square mile
Median price asked for vacant for-sale houses and condos in 2022: $406,094.
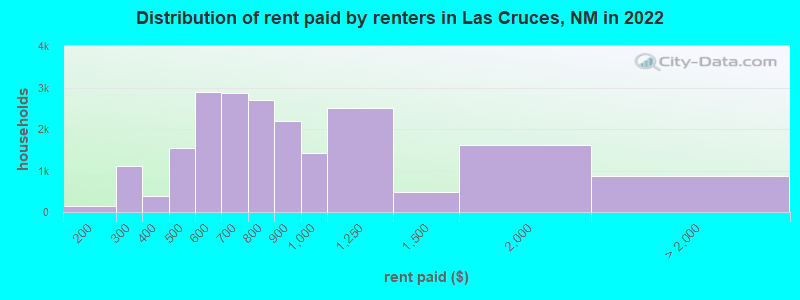
Median contract rent in 2022: $731 (lower quartile is $555, upper quartile is $974)
Median rent asked for vacant for-rent units in 2022: $828
Median gross rent in Las Cruces, NM in 2022: $888
Housing units in Las Cruces with a mortgage: 16,350 (909 second mortgage, 44 home equity loan, 503 both second mortgage and home equity loan )Houses without a mortgage: 240
Median household income for houses/condos with a mortgage: $81,060
Median household income for apartments without a mortgage: $61,192
Median monthly housing costs: $915
Data:
Median house or condo value ($)
Median house or condo value ($ change since 2000)
Median house or condo value ($) - White
Median house or condo value ($) - Black or African American
Median house or condo value ($) - Asian
Median house or condo value ($) - Hispanic or Latino
Median house or condo value ($) - American Indian and Alaska Native
Median house or condo value ($) - Multirace
Median house or condo value ($) - Other Race
Median price asked for mobile homes ($)
Household density (households per square mile)
Mean house or condo value by units in structure - 1, detached ($)
Mean house or condo value by units in structure - 1, attached ($)
Mean house or condo value by units in structure - 2 ($)
Mean house or condo value by units in structure by units in structure - 3 or 4 ($)
Mean house or condo value by units in structure - 5 or more ($)
Mean house or condo value by units in structure - Boat, RV, van, etc. ($)
Mean house or condo value by units in structure - Mobile home ($)
Median contract rent ($)
Median contract rent - Lower quartile ($)
Median contract rent - Upper quartile ($)
Median gross rent ($)
Urban houses (%)
Rural houses (%)
Houses occupied (%)
Houses occupied (% change since 2000)
Houses owner occupied (%)
Houses owner occupied (% change since 2000)
Houses renter occupied (%)
Houses renter occupied (% change since 2000)
Vacant housing units - For rent (%)
Vacant housing units - For rent (% change since 2000)
Vacant housing units - For sale only (%)
Vacant housing units - For sale only (% change since 2000)
Vacant housing units - Rented or sold, not occupied (%)
Vacant housing units - Rented or sold, not occupied (% change since 2000)
Vacant housing units - For seasonal, recreational, or occasional use (%)
Vacant housing units - For seasonal, recreational, or occasional use (% change since 2000)
Vacant housing units - For migrant workers (%)
Vacant housing units - For migrant workers (% change since 2000)
Vacant housing units - Other vacant (%)
Vacant housing units - Other vacant (% change since 2000)
Median monthly housing costs ($)
Median household income for houses/condos with a mortgage ($)
Median household income for houses/condos without a mortgage ($)
Median household income ($)
Median household income ($) - White
Median household income ($) - Black or African American
Median household income ($) - Asian
Median household income ($) - Hispanic or Latino
Median household income ($) - American Indian and Alaska Native
Median household income ($) - Multirace
Median household income ($) - Other Race
Mortgage status - with mortgage (%)
Mortgage status - with second mortgage (%)
Mortgage status - with home equity loan (%)
Mortgage status - with both second mortgage and home equity loan (%)
Mortgage status - without a mortgage (%)
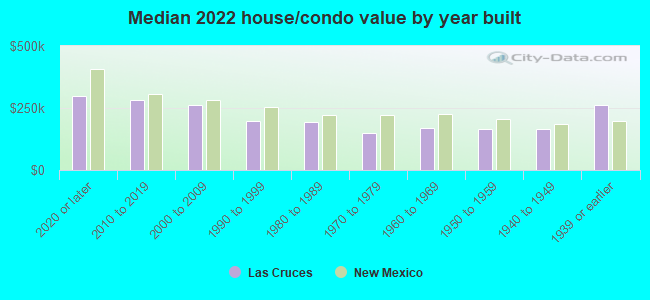
Median year house/condo built
Median year apartment built
Household type by relationship - Male householder living alone (%)
Household type by relationship - Male householder not living alone (%)
Household type by relationship - Female householder living alone (%)
Household type by relationship - Female householder not living alone (%)
Household type by relationship - Opposite-Sex spouse (%)
Household type by relationship - Same-Sex spouse (%)
Household type by relationship - Opposite-Sex unmarried partner (%)
Household type by relationship - Same-Sex unmarried partner (%)
Household type by relationship - In group quarters (%)
Size of family households - 2-person household (%)
Size of family households - 3-person household (%)
Size of family households - 4-person household (%)
Size of family households - 5-person household (%)
Size of family households - 6-person household (%)
Size of family households - 7-or-more-person household (%)
Size of nonfamily households - 1-person household (%)
Size of nonfamily households - 2-person household (%)
Size of nonfamily households - 3-person household (%)
Size of nonfamily households - 4-person household (%)
Size of nonfamily households - 5-person household (%)
Size of nonfamily households - 6-person household (%)
Size of nonfamily households - 7-or-moreperson household (%)
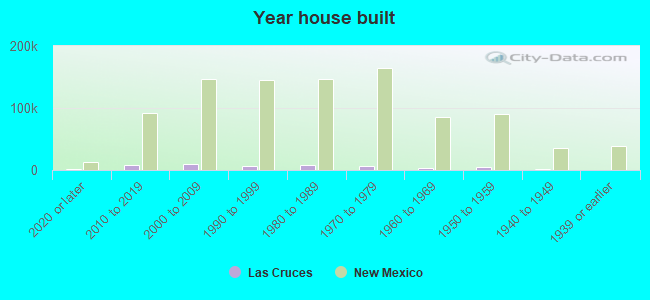
Year house built - Built 2010 or later (%)
Year house built - Built 2000 to 2009 (%)
Year house built - Built 1990 to 1999 (%)
Year house built - Built 1980 to 1989 (%)
Year house built - Built 1970 to 1979 (%)
Year house built - Built 1960 to 1969 (%)
Year house built - Built 1950 to 1959 (%)
Year house built - Built 1940 to 1949 (%)
Year house built - Built 1939 or earlier (%)
Median number of rooms in houses and condos
Median number of rooms in apartments
Median number of bedrooms in owner occupied houses
Mean number of bedrooms in owner occupied houses
Median number of bedrooms in renter occupied houses
Mean number of bedrooms in renter occupied houses
Median number of vehichles in owner occupied houses
Mean number of vehichles in owner occupied houses
Median number of vehichles in renter occupied houses
Mean number of vehichles in renter occupied houses
Rooms in owner-occupied houses - 1 room (%)
Rooms in owner-occupied houses - 2 rooms (%)
Rooms in owner-occupied houses - 3 rooms (%)
Rooms in owner-occupied houses - 4 rooms (%)
Rooms in owner-occupied houses - 5 rooms (%)
Rooms in owner-occupied houses - 6 rooms (%)
Rooms in owner-occupied houses - 7 rooms (%)
Rooms in owner-occupied houses - 8 rooms (%)
Rooms in owner-occupied houses - 9+ rooms (%)
Rooms in renter-occupied houses - 1 room (%)
Rooms in renter-occupied houses - 2 rooms (%)
Rooms in renter-occupied houses - 3 rooms (%)
Rooms in renter-occupied houses - 4 rooms (%)
Rooms in renter-occupied houses - 5 rooms (%)
Rooms in renter-occupied houses - 6 rooms (%)
Rooms in renter-occupied houses - 7 rooms (%)
Rooms in renter-occupied houses - 8 rooms (%)
Rooms in renter-occupied houses - 9+ rooms (%)
Bedrooms in owner-occupied houses - no bedrooms (%)
Bedrooms in owner-occupied houses - 1 bedroom (%)
Bedrooms in owner-occupied houses - 2 bedrooms (%)
Bedrooms in owner-occupied houses - 3 bedrooms (%)
Bedrooms in owner-occupied houses - 4 bedrooms (%)
Bedrooms in owner-occupied houses - 5+ bedrooms (%)
Bedrooms in renter-occupied houses - no bedrooms (%)
Bedrooms in renter-occupied houses - 1 bedroom (%)
Bedrooms in renter-occupied houses - 2 bedrooms (%)
Bedrooms in renter-occupied houses - 3 bedrooms (%)
Bedrooms in renter-occupied houses - 4 bedrooms (%)
Bedrooms in renter-occupied houses - 5+ bedrooms (%)
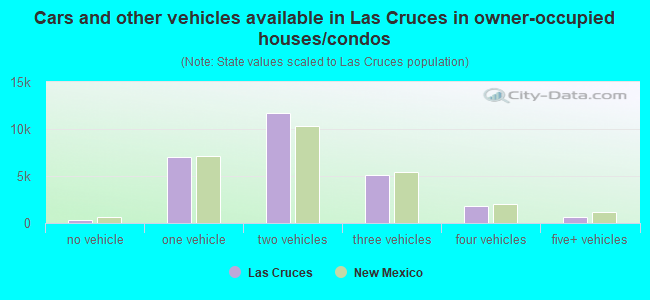
Vehicles available in owner-occupied houses - no vehicle available (%)
Vehicles available in owner-occupied houses - 1 vehicle available(%)
Vehicles available in owner-occupied houses - 2 Vehicles available (%)
Vehicles available in owner-occupied houses - 3 Vehicles available (%)
Vehicles available in owner-occupied houses - 4 Vehicles available (%)
Vehicles available in owner-occupied houses - 5+ Vehicles available (%)
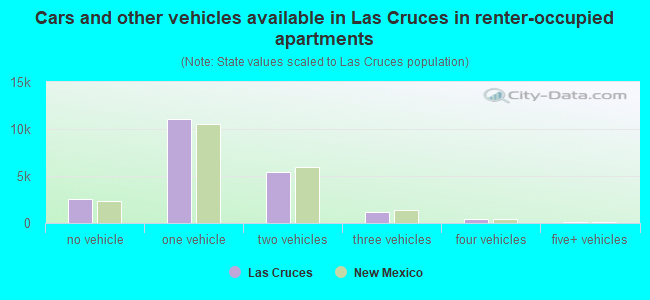
Vehicles available in renter-occupied houses - no vehicle available (%)
Vehicles available in renter-occupied houses - 1 vehicle available (%)
Vehicles available in renter-occupied houses - 2 Vehicles available (%)
Vehicles available in renter-occupied houses - 3 Vehicles available (%)
Vehicles available in renter-occupied houses - 4 Vehicles available (%)
Vehicles available in renter-occupied houses - 5+ Vehicles available (%)
Housing units in structures - 1, detached (%)
Housing units in structures - 1, attached (%)
Housing units in structures - 2 (%)
Housing units in structures - 3 or 4 (%)
Housing units in structures - 5 to 9 (%)
Housing units in structures - 10 to 19 (%)
Housing units in structures - 20 to 49 (%)
Housing units in structures - 50 or more (%)
Housing units in structures - Mobile home (%)
Housing units in structures - Boat, RV, van, etc. (%)
Housing units in structures - Owners - 1, detached (%)
Housing units in structures - Owners - 1, attached (%)
Housing units in structures - Owners - 2 (%)
Housing units in structures - Owners - 3 or 4 (%)
Housing units in structures - Owners - 5 to 9 (%)
Housing units in structures - Owners - 10 to 19 (%)
Housing units in structures - Owners - 20 to 49 (%)
Housing units in structures - Owners - 50 or more (%)
Housing units in structures - Owners - Mobile home (%)
Housing units in structures - Owners - Boat, RV, van, etc. (%)
Housing units in structures - Renters - 1, detached (%)
Housing units in structures - Renters - 1, attached (%)
Housing units in structures - Renters - 2 (%)
Housing units in structures - Renters - 3 or 4 (%)
Housing units in structures - Renters - 5 to 9 (%)
Housing units in structures - Renters - 10 to 19 (%)
Housing units in structures - Renters - 20 to 49 (%)
Housing units in structures - Renters - 50 or more (%)
Housing units in structures - Renters - Mobile home (%)
Housing units in structures - Renters - Boat, RV, van, etc. (%)
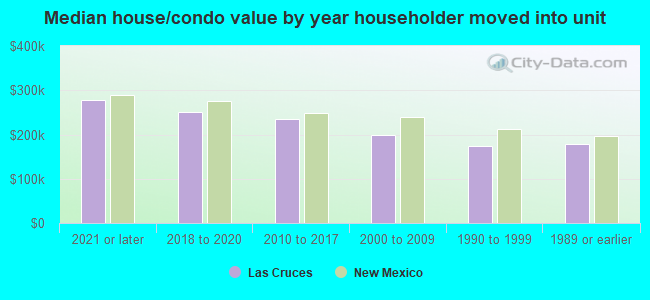
House/condo owner moved in on average (years ago)
Renter moved in on average (years ago)
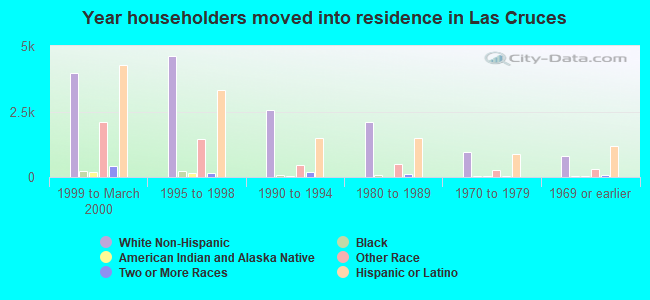
Year householder moved into unit - Moved in 1999 to March 2000 (%)
Year householder moved into unit - Moved in 1999 to March 2000 (%) - White
Year householder moved into unit - Moved in 1999 to March 2000 (%) - Black or African American
Year householder moved into unit - Moved in 1999 to March 2000 (%) - Asian
Year householder moved into unit - Moved in 1999 to March 2000 (%) - Hispanic or Latino
Year householder moved into unit - Moved in 1999 to March 2000 (%) - American Indian and Alaska Native
Year householder moved into unit - Moved in 1999 to March 2000 (%) - Multirace
Year householder moved into unit - Moved in 1999 to March 2000 (%) - Other Race
Year householder moved into unit - Moved in 1995 to 1998 (%)
Year householder moved into unit - Moved in 1995 to 1998 (%) - White
Year householder moved into unit - Moved in 1995 to 1998 (%) - Black or African American
Year householder moved into unit - Moved in 1995 to 1998 (%) - Asian
Year householder moved into unit - Moved in 1995 to 1998 (%) - Hispanic or Latino
Year householder moved into unit - Moved in 1995 to 1998 (%) - American Indian and Alaska Native
Year householder moved into unit - Moved in 1995 to 1998 (%) - Multirace
Year householder moved into unit - Moved in 1995 to 1998 (%) - Other Race
Year householder moved into unit - Moved in 1990 to 1994 (%)
Year householder moved into unit - Moved in 1990 to 1994 (%) - White
Year householder moved into unit - Moved in 1990 to 1994 (%) - Black or African American
Year householder moved into unit - Moved in 1990 to 1994 (%) - Asian
Year householder moved into unit - Moved in 1990 to 1994 (%) - Hispanic or Latino
Year householder moved into unit - Moved in 1990 to 1994 (%) - American Indian and Alaska Native
Year householder moved into unit - Moved in 1990 to 1994 (%) - Multirace
Year householder moved into unit - Moved in 1990 to 1994 (%) - Other Race
Year householder moved into unit - Moved in 1980 to 1989 (%)
Year householder moved into unit - Moved in 1980 to 1989 (%) - White
Year householder moved into unit - Moved in 1980 to 1989 (%) - Black or African American
Year householder moved into unit - Moved in 1980 to 1989 (%) - Asian
Year householder moved into unit - Moved in 1980 to 1989 (%) - Hispanic or Latino
Year householder moved into unit - Moved in 1980 to 1989 (%) - American Indian and Alaska Native
Year householder moved into unit - Moved in 1980 to 1989 (%) - Multirace
Year householder moved into unit - Moved in 1980 to 1989 (%) - Other Race
Year householder moved into unit - Moved in 1970 to 1979 (%)
Year householder moved into unit - Moved in 1970 to 1979 (%) - White
Year householder moved into unit - Moved in 1970 to 1979 (%) - Black or African American
Year householder moved into unit - Moved in 1970 to 1979 (%) - Asian
Year householder moved into unit - Moved in 1970 to 1979 (%) - Hispanic or Latino
Year householder moved into unit - Moved in 1970 to 1979 (%) - American Indian and Alaska Native
Year householder moved into unit - Moved in 1970 to 1979 (%) - Multirace
Year householder moved into unit - Moved in 1970 to 1979 (%) - Other Race
Year householder moved into unit - Moved in 1969 or earlier (%)
Year householder moved into unit - Moved in 1969 or earlier (%) - White
Year householder moved into unit - Moved in 1969 or earlier (%) - Black or African American
Year householder moved into unit - Moved in 1969 or earlier (%) - Asian
Year householder moved into unit - Moved in 1969 or earlier (%) - Hispanic or Latino
Year householder moved into unit - Moved in 1969 or earlier (%) - American Indian and Alaska Native
Year householder moved into unit - Moved in 1969 or earlier (%) - Multirace
Year householder moved into unit - Moved in 1969 or earlier (%) - Other Race
Housing units lacking complete plumbing facilities (%)
Housing units lacking complete kitchen facilities (%)
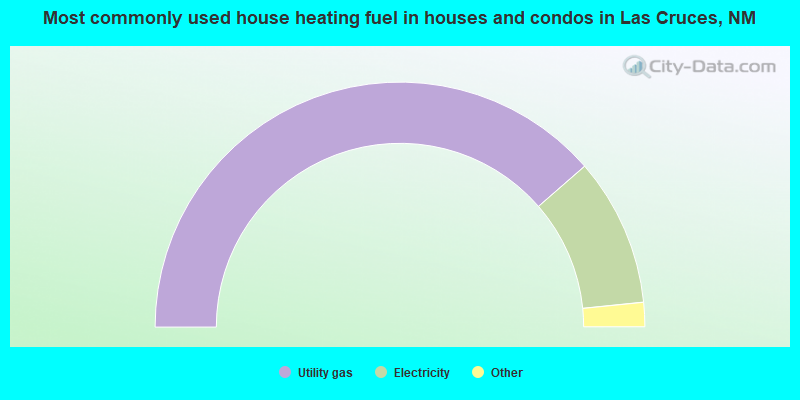
House heating fuel used in houses and condos - Utility gas (%)
House heating fuel used in houses and condos - Bottled, tank, or LP gas (%)
House heating fuel used in houses and condos - Electricity (%)
House heating fuel used in houses and condos - Fuel oil, kerosene, etc. (%)
House heating fuel used in houses and condos - Coal or coke (%)
House heating fuel used in houses and condos - Wood (%)
House heating fuel used in houses and condos - Solar energy (%)
House heating fuel used in houses and condos - Other fuel (%)
House heating fuel used in houses and condos - No fuel used (%)
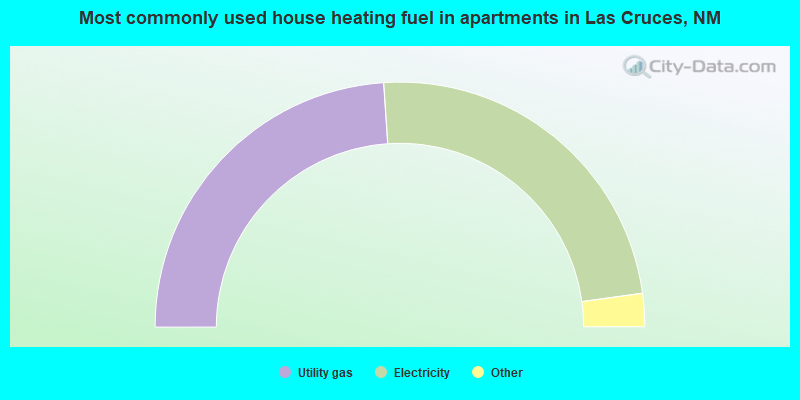
House heating fuel used in apartments - Utility gas (%)
House heating fuel used in apartments - Bottled, tank, or LP gas (%)
House heating fuel used in apartments - Electricity (%)
House heating fuel used in apartments - Fuel oil, kerosene, etc. (%)
House heating fuel used in apartments - Coal or coke (%)
House heating fuel used in apartments - Wood (%)
House heating fuel used in apartments - Solar energy (%)
House heating fuel used in apartments - Other fuel (%)
House heating fuel used in apartments - No fuel used (%)
Median year house/condo built: 1997Median year apartment built: 1984Household type by relationship:
Households: 113,881
Male householders: 21,327 (6,399 living alone ), Female householders: 26,052 (9,245 living alone )15,538 spouses (15,104 opposite-sex spouses ), 5,940 unmarried partners , (5,498 opposite-sex unmarried partners ), 32,714 children (30,847 natural , 54 adopted , 1,813 stepchildren ), 2,744 grandchildren , 993 brothers or sisters , 729 parents , 0 foster children , 1,755 other relatives , 5,372 non-relatives In group quarters: 717
Size of family households: 12,474 2-persons , 4,091 3-persons , 4,981 4-persons , 2,374 5-persons , 1,090 6-persons , 415 7-or-more-persons .
Size of nonfamily households: 15,644 1-person , 5,318 2-persons , 524 3-persons , 387 4-persons , 81 5-persons .
11,619 married couples with children. single-parent households (2,668 men , 7,757 women ).
65.2% of residents of Las Cruces speak English at home. of residents speak Spanish at home (75% speak English very well , 15% speak English well , 7% speak English not well , 3% don't speak English at all ).of residents speak other Indo-European language at home (60% speak English very well , 24% speak English well , 16% speak English not well ).of residents speak Asian or Pacific Island language at home (74% speak English very well , 23% speak English well , 4% speak English not well ).of residents speak other language at home (54% speak English very well , 46% speak English well ).
Foreign born population: 13,226 (11.6%)of them are naturalized citizens )
Median number of rooms in houses and condos:
Median number of rooms in apartments
Owner-occupied Renter-occupied
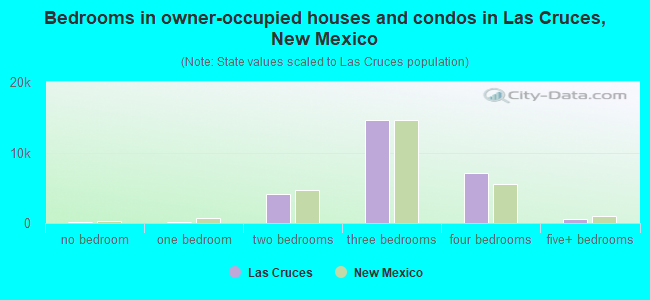
Bedrooms in owner-occupied houses and condos in Las Cruces, New Mexico
142 no bedroom 168 1 bedroom 4,091 2 bedrooms 14,551 3 bedrooms 7,130 4 bedrooms 600 5+ bedrooms
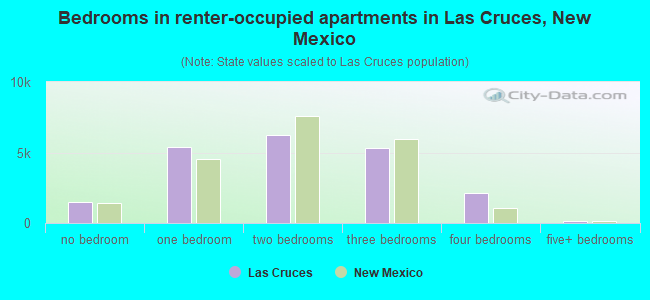
Bedrooms in renter-occupied apartments in Las Cruces, New Mexico
1,509 no bedroom 5,415 1 bedroom 6,214 2 bedrooms 5,301 3 bedrooms 2,128 4 bedrooms 130 5+ bedrooms
Owner-occupied Renter-occupied
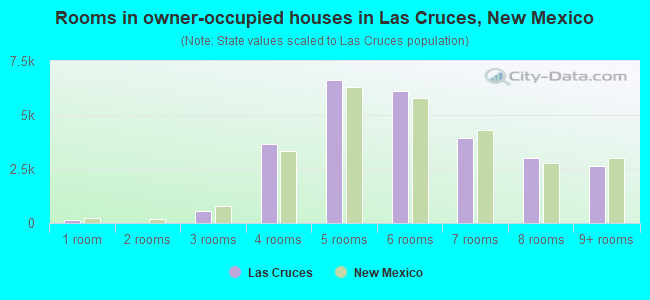
Rooms in owner-occupied houses in Las Cruces, New Mexico
142 1 room 0 2 rooms 556 3 rooms 3,659 4 rooms 6,606 5 rooms 6,120 6 rooms 3,945 7 rooms 2,994 8 rooms 2,660 9+ rooms
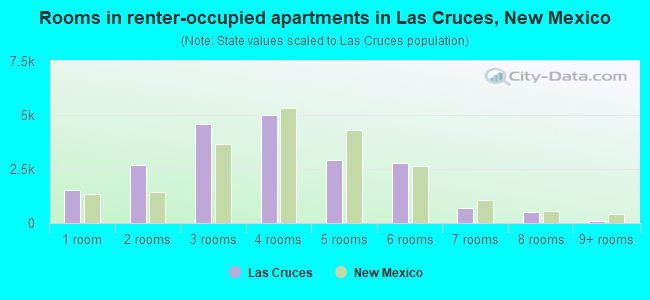
Rooms in renter-occupied apartments in Las Cruces, New Mexico
1,509 1 room 2,682 2 rooms 4,563 3 rooms 4,983 4 rooms 2,899 5 rooms 2,766 6 rooms 695 7 rooms 527 8 rooms 73 9+ rooms
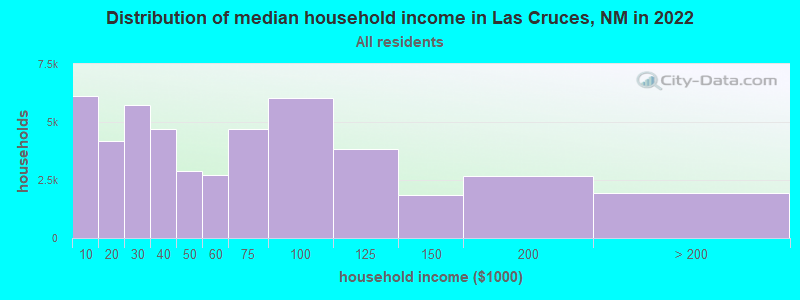
Las Cruces, NM household income distribution 6,112 Less than $10,0004,176 $10,000 to $19,9995,740 $20,000 to $29,9994,677 $30,000 to $39,9992,891 $40,000 to $49,9992,729 $50,000 to $59,9994,678 $60,000 to $74,9996,015 $75,000 to $99,9993,855 $100,000 to $124,9991,873 $125,000 to $149,9992,678 $150,000 to $199,9991,955 $200,000 or more
Home value of owner - occupied houses in 2022 in Las Cruces, NM 583 Less than $10,000216 $10,000 to $14,999161 $15,000 to $19,99983 $20,000 to $24,99999 $25,000 to $29,999193 $30,000 to $34,999100 $35,000 to $39,999252 $40,000 to $49,999280 $50,000 to $59,99944 $60,000 to $69,999256 $70,000 to $79,999260 $80,000 to $89,999205 $90,000 to $99,9991,583 $100,000 to $124,9991,403 $125,000 to $149,9993,394 $150,000 to $174,9992,375 $175,000 to $199,9994,816 $200,000 to $249,9993,871 $250,000 to $299,9994,809 $300,000 to $399,999782 $400,000 to $499,999811 $500,000 to $749,999127 $750,000 to $999,99998 $1,000,000 to $1,499,99911 $1,500,000 to $1,999,99917 $2,000,000 or moreRent paid by renters in 2022 in Las Cruces, NM 57 $100 to $14999 $150 to $199911 $200 to $249191 $250 to $299125 $300 to $349271 $350 to $399553 $400 to $449999 $450 to $4991,637 $500 to $5491,264 $550 to $5992,182 $600 to $649676 $650 to $6991,539 $700 to $7491,149 $750 to $7992,181 $800 to $8991,415 $900 to $9992,500 $1,000 to $1,249475 $1,250 to $1,4991,616 $1,500 to $1,999857 No cash rent
Percentage of workers working in this county: 91.0%Number of people working at home: 4,370 (8.7% of all workers )
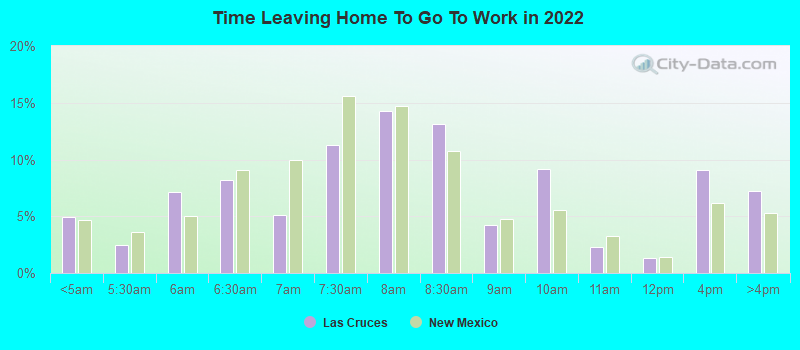
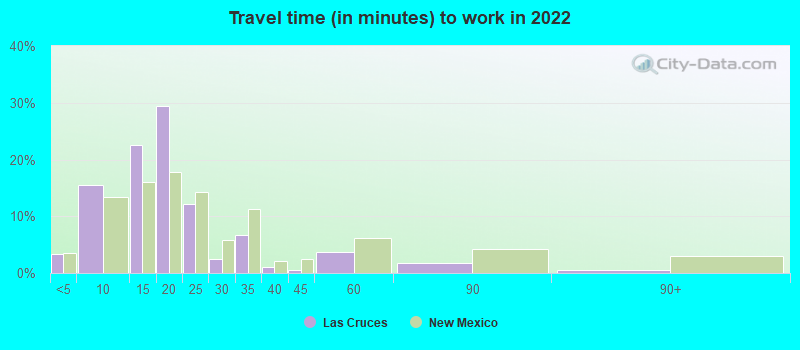
Travel time to work (commute)
Less than 5 minutes: 2,0155 to 9 minutes: 7,23310 to 14 minutes: 9,11015 to 19 minutes: 12,78420 to 24 minutes: 5,47425 to 29 minutes: 79830 to 34 minutes: 3,46235 to 39 minutes: 1,40940 to 44 minutes: 52545 to 59 minutes: 2,04460 to 89 minutes: 74690 or more minutes: 1,089
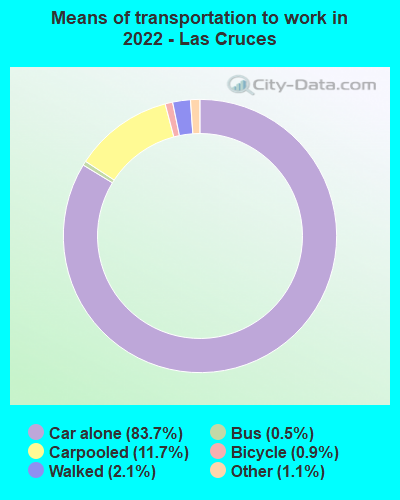
Means of transportation to work:
Drove a car alone: 43,867 (77.0%)Carpooled: 5,967 (10.5%)Bus : 299 (0.5%)Taxi: 610 (1.1%)Bicycle: 268 (0.5%)Walked: 1,358 (2.4%)Worked at home: 4,370 (7.7%)
Unemployment by race in 2022
Unemployment rate for White non-Hispanic residents 7.0% Males12.5% FemalesUnemployment rate for Black residents 12.4% Males10.9% FemalesUnemployment rate for American Indian and Alaska Native residents 18.9% Males3.8% FemalesUnemployment rate for Asian residents 8.9% MalesUnemployment rate for other race residents 8.4% Males4.9% FemalesUnemployment rate for two or more race residents 2.6% Males4.7% FemalesUnemployment rate for Hispanic or Latino residents 6.5% Males3.1% Females
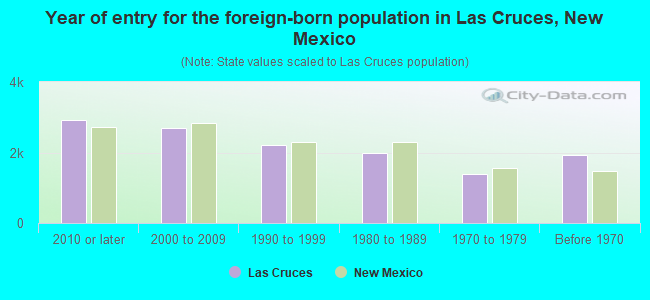
Year of entry for the foreign-born population in Las Cruces, New Mexico
2,935 2010 or later 2,700 2000 to 2009 2,225 1990 to 1999 1,977 1980 to 1989 1,399 1970 to 1979 1,927 Before 1970
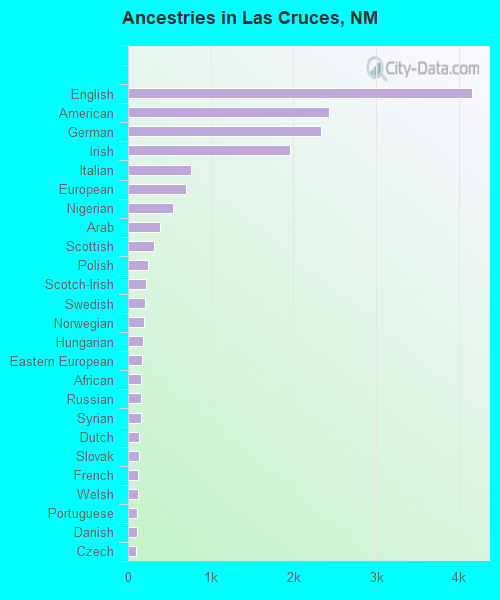
First ancestries reported:
English: 4,155 (6.0%)
American: 2,426 (3.5%)
German: 2,331 (3.4%)
Irish: 1,961 (2.8%)
Italian: 757 (1.1%)
European: 697 (1.0%)
Nigerian: 541 (0.8%)
Arab: 389 (0.6%)
Scottish: 309 (0.4%)
Polish: 245 (0.4%)
Scotch-Irish: 220 (0.3%)
Swedish: 205 (0.3%)
Norwegian: 197 (0.3%)
Hungarian: 182 (0.3%)
Eastern European: 171 (0.2%)
African: 158 (0.2%)
Russian: 158 (0.2%)
Syrian: 153 (0.2%)
Dutch: 132 (0.2%)
Slovak: 131 (0.2%)
French: 125 (0.2%)
Welsh: 125 (0.2%)
Portuguese: 110 (0.2%)
Danish: 103 (0.1%)
Czech: 100 (0.1%)
Belgian: 90 (0.1%)
Scandinavian: 81 (0.1%)
Greek: 80 (0.1%)
Northern European: 77 (0.1%)
French Canadian: 68 (0.10%)
Romanian: 66 (0.10%)
Jamaican: 66 (0.10%)
Iranian: 64 (0.09%)
Austrian: 51 (0.07%)
Czechoslovakian: 31 (0.04%)
British: 31 (0.04%)
Lithuanian: 29 (0.04%)
Canadian: 23 (0.03%)
Estonian: 17 (0.02%)
Ukrainian: 17 (0.02%)
Lebanese: 14 (0.02%)
Belizean: 8 (0.01%) Most common places of birth for foreign-born residents (%): Mexico Las Cruces:
65.8% (7,977)New Mexico:
66.5% (129,316)
Kuwait Las Cruces:
4.4% (529)New Mexico:
0.2% (463)
Philippines Las Cruces:
3.9% (475)New Mexico:
3.2% (6,181)
Nigeria Las Cruces:
2.9% (348)New Mexico:
0.7% (1,297)
Germany Las Cruces:
2.1% (257)New Mexico:
1.9% (3,753)
Korea Las Cruces:
2.0% (248)New Mexico:
0.8% (1,632)
India Las Cruces:
1.6% (200)New Mexico:
1.5% (3,002)
Bangladesh Las Cruces:
1.6% (197)New Mexico:
0.2% (477)
Place of birth for U.S.-born residents:
This state: 57,513Other state: 41,928Northeast: 4,139Midwest: 8,781South: 15,332West: 13,676 86.1% of Las Cruces residents lived in the same house 1 years ago.
Out of people who lived in different houses, 35.6% lived in this county.
Out of people who lived in different counties, 34.1% lived in New Mexico.
Las Cruces:
86.1%State average:
88.2%
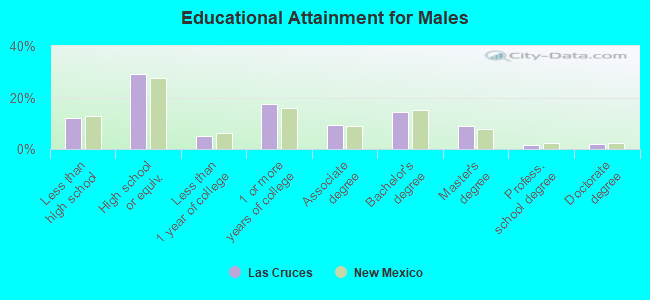
Education attainment for males 25 years and older:
No schooling: 372Nursery to 4th grade: 2415th and 6th grade: 5227th and 8th grade: 6209th grade: 75210th grade: 83711th grade: 22312th grade, no diploma: 604High school graduate (or equivalency): 9,968Less than 1 year of college: 1,769Some college more than 1 year, no degree: 5,984Associate degree: 3,250Bachelor's degree: 4,976Master's degree: 3,078Professional school degree: 480Doctorate degree: 697
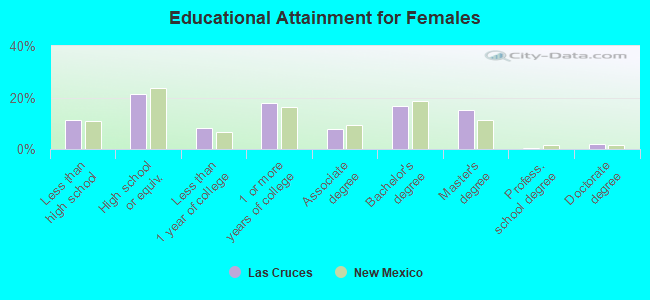
Education attainment for females 25 years and older:
No schooling: 344Nursery to 4th grade: 1835th and 6th grade: 1,0047th and 8th grade: 4909th grade: 54610th grade: 35811th grade: 81512th grade, no diploma: 326High school graduate (or equivalency): 7,825Less than 1 year of college: 2,925Some college more than 1 year, no degree: 6,480Associate degree: 2,893Bachelor's degree: 6,049Master's degree: 5,534Professional school degree: 121Doctorate degree: 644
Housing units in structures:
One, detached: 31,488One, attached: 1,454Two: 8203 or 4: 3,3495 to 9: 3,83310 to 19: 2,39620 to 49: 86150 or more: 1,660Mobile homes: 4,593Median worth of mobile homes: $47,000
Housing units lacking complete plumbing facilities in 2022: 1.1%Housing units lacking complete kitchen facilities in 2022: 0.7%House/condo owner moved in on average 8 years ago
Renter moved in on average 2 years ago
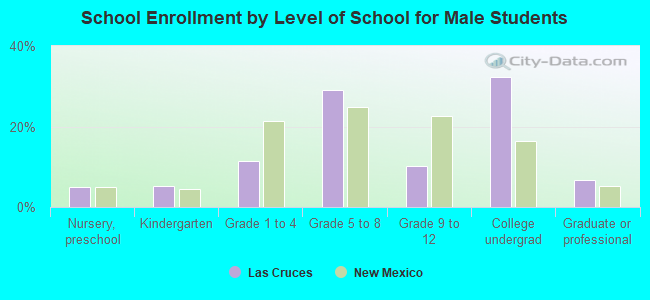
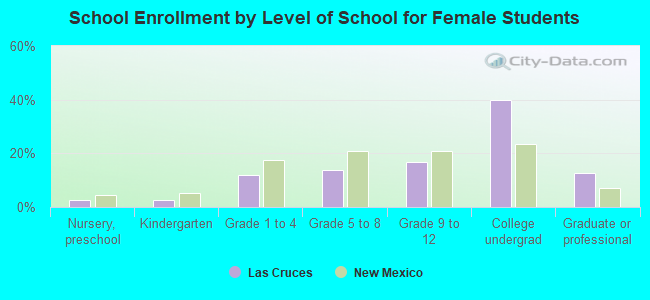
Private vs. public school enrollment:
Students in private schools in grades 1 to 8 (elementary and middle school): 298 Here:
2.6%New Mexico:
10.2%
Students in private schools in grades 9 to 12 (high school): 133 Here:
2.7%New Mexico:
10.0%
Students in private undergraduate colleges: 2,293 Here:
17.7%New Mexico:
12.3%