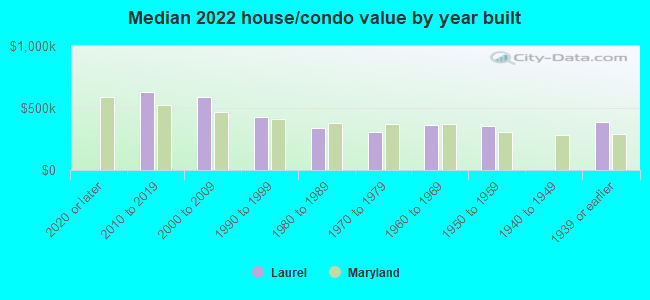
Laurel, MD (Maryland) Houses and Residents
| Laurel: | $382,622 |
| Maryland: | $398,100 |
Mean price in 2022:
Detached houses: $513,264
Here: $513,264 State: $526,819 Townhouses or other attached units: $331,849
Here: $331,849 State: $328,305 In 3-to-4-unit structures: $300,208
Here: $300,208 State: $295,378 In 5-or-more-unit structures: $236,544
Here: $236,544 State: $350,378
Total population: 26,160 (Urban population: 20,054, Rural population: 0)
Houses: 12,668 (11,671 occupied: 5,199 owner occupied, 6,525 renter occupied)
| % of renters here: | 56% |
| State: | 32% |
Housing density: 3,351 houses/condos per square mile
Median price asked for vacant for-sale houses and condos in 2022: $394,969.
Median contract rent in 2022: $1,635 (lower quartile is $1,320, upper quartile is over $2,000)
Median rent asked for vacant for-rent units in 2022: $2,710
Median gross rent in Laurel, MD in 2022: $1,760
Housing units in Laurel with a mortgage: 4,201 (452 second mortgage, 36 home equity loan, 413 both second mortgage and home equity loan)
Houses without a mortgage: 99
Median household income for houses/condos with a mortgage: $113,068
Median household income for apartments without a mortgage: $99,517
Median monthly housing costs: $1,737
Compare current foreclosures in Laurel, MD:
| Photo | Address | Area | Beds / Baths | Price | Details |
|---|---|---|---|---|---|

|
#1
Jerald Rd
Laurel, MD 20707
|
2,388 sq. feet
|
2 baths 4 beds |
show details | |

|
#2
S Arbory Ln
Laurel, MD 20707
|
1,283 sq. feet
|
3 baths 3 beds |
show details | |

|
#3
Brock Bridge Rd
Laurel, MD 20724
|
1,428 sq. feet
|
1 baths 4 beds |
show details | |

|
#4
Killbarron Dr
Laurel, MD 20707
|
4,004 sq. feet
|
4 baths 5 beds |
show details | |

|
#5
Overlook Way
Laurel, MD 20707
|
- sq. feet
|
3 baths 3 beds |
show details | |

|
#6
Cherry Blossom Xing
Laurel, MD 20724
|
1,852 sq. feet
|
2 baths - beds |
show details | |

|
#7
Shannon Ave
Laurel, MD 20707
|
2,050 sq. feet
|
2 baths - beds |
show details | |

|
#8
Ironbridge Ln
Laurel, MD 20707
|
3,988 sq. feet
|
4 baths - beds |
show details | |

|
#9
Joshua Ct
Laurel, MD 20708
|
1,038 sq. feet
|
2 baths - beds |
show details | |

|
#10
All Saints Rd
Laurel, MD 20723
|
2,126 sq. feet
|
3 baths - beds |
show details |
| Photo | Address | Area | Beds / Baths | Price | Details |
|---|---|---|---|---|---|

|
#11
Dameron S
Laurel, MD 20724
|
1,662 sq. feet
|
2 baths - beds |
show details | |

|
#12
Magnolia St
Laurel, MD 20707
|
1,272 sq. feet
|
2 baths - beds |
show details | |

|
#13
Golden Oak Dr
Laurel, MD 20708
|
2,052 sq. feet
|
2 baths - beds |
show details | |

|
#14
Otter Creek Rd
Laurel, MD 20724
|
2,260 sq. feet
|
2 baths - beds |
show details | |

|
#15
Cambridge Cir
Laurel, MD 20707
|
1,360 sq. feet
|
2 baths - beds |
show details | |

|
#16
Mayfair Ter
Laurel, MD 20707
|
2,070 sq. feet
|
2 baths - beds |
show details | |

|
#17
Bryant Ave
Laurel, MD 20723
|
1,320 sq. feet
|
2 baths - beds |
show details | |

|
#18
Snowden Loop Ct
Laurel, MD 20708
|
2,156 sq. feet
|
2 baths - beds |
show details | |

|
#19
Tilghman Dr
Laurel, MD 20707
|
4,296 sq. feet
|
3 baths - beds |
show details | |

|
#20
Westmeath Dr
Laurel, MD 20707
|
2,752 sq. feet
|
2 baths - beds |
show details |
| Photo | Address | Area | Beds / Baths | Price | Details |
|---|---|---|---|---|---|

|
#21
Courtland Pl
Laurel, MD 20707
|
1,372 sq. feet
|
2 baths - beds |
show details | |

|
#22
Westmeath Dr
Laurel, MD 20707
|
3,416 sq. feet
|
2 baths - beds |
show details | |

|
#23
Kerr Rd
Laurel, MD 20707
|
1,180 sq. feet
|
2 baths - beds |
show details | |

|
#24
5th St
Laurel, MD 20707
|
1,528 sq. feet
|
2 baths - beds |
show details | |

|
#25
Haines Ct
Laurel, MD 20707
|
1,364 sq. feet
|
1 baths - beds |
show details | |

|
#26
Cambridge Cir
Laurel, MD 20707
|
1,360 sq. feet
|
2 baths - beds |
show details | |

|
#27
Pamela Way # 100
Laurel, MD 20723
|
2,332 sq. feet
|
2 baths - beds |
show details | |

|
#28
Jerald Rd
Laurel, MD 20707
|
2,729 sq. feet
|
2 baths - beds |
show details | |

|
#29
Westmeath Dr
Laurel, MD 20707
|
3,210 sq. feet
|
3 baths - beds |
show details | |

|
#30
Early Bud Way
Laurel, MD 20723
|
3,700 sq. feet
|
4 baths - beds |
show details |
| Photo | Address | Area | Beds / Baths | Price | Details |
|---|---|---|---|---|---|

|
#31
Pennington Dr
Laurel, MD 20724
|
1,552 sq. feet
|
3 baths - beds |
show details | |

|
#32
Madison Ave
Laurel, MD 20723
|
1,484 sq. feet
|
1 baths - beds |
show details | |

|
#33
Laurel Ave
Laurel, MD 20707
|
1,384 sq. feet
|
2 baths - beds |
show details | |

|
#34
Old Line Ave
Laurel, MD 20724
|
1,928 sq. feet
|
1 baths - beds |
show details | |

|
#35
Snowden Loop
Laurel, MD 20708
|
1,182 sq. feet
|
2 baths - beds |
show details | |

|
#36
Bayou Bend Blvd
Laurel, MD 20724
|
2,044 sq. feet
|
2 baths - beds |
show details | |

|
#37
Falcon Point St
Laurel, MD 20708
|
1,080 sq. feet
|
3 baths - beds |
show details | |

|
#38
Mayflower Ct
Laurel, MD 20723
|
1,428 sq. feet
|
2 baths - beds |
show details | |

|
#39
Chapel Cove Dr
Laurel, MD 20707
|
1,908 sq. feet
|
2 baths - beds |
show details | |

|
#40
Old Line Ave
Laurel, MD 20724
|
1,662 sq. feet
|
2 baths - beds |
show details |
| Photo | Address | Area | Beds / Baths | Price | Details |
|---|---|---|---|---|---|

|
#41
Chippenham Dr
Laurel, MD 20723
|
1,520 sq. feet
|
1 baths - beds |
show details | |

|
#42
June Flowers Way
Laurel, MD 20723
|
2,700 sq. feet
|
2 baths - beds |
show details | |

|
#43
June Flowers Way
Laurel, MD 20723
|
2,700 sq. feet
|
2 baths - beds |
show details | |

|
#44
Crumpton S
Laurel, MD 20724
|
1,872 sq. feet
|
2 baths - beds |
show details | |

|
#45
Carland Pl
Laurel, MD 20708
|
1,968 sq. feet
|
2 baths - beds |
show details | |

|
#46
Galaxy Way
Laurel, MD 20724
|
2,240 sq. feet
|
2 baths - beds |
show details | |

|
#47
Madison Ave # B
Laurel, MD 20723
|
1,575 sq. feet
|
1 baths - beds |
show details | |

|
#48
Kings Grant Rd
Laurel, MD 20723
|
1,962 sq. feet
|
2 baths - beds |
show details | |

|
#49
Murphy Rd
Laurel, MD 20723
|
1,296 sq. feet
|
3 baths - beds |
show details | |

|
Check over 1 million property listings on Foreclosure.com!
|
browse all offers | |||

Latest news about housing in Laurel, MD collected exclusively by city-data.com from local newspapers, TV, and radio stations

 | Advice on commuting from Laurel into DC (5 replies) |
| Apartments near Laurel for young people? (5 replies) |
| Condo Location (?) Suburban Maryland - Laurel, Greenbelt, Beltsville or Hyattsville (50 replies) |
| North Laurel new developments (3 replies) |
| 'Affordable' ($300K-$400K) NEW TH/SF homes in Montgomery County ? (10 replies) |
| Lennar Homes in Severn? (0 replies) |
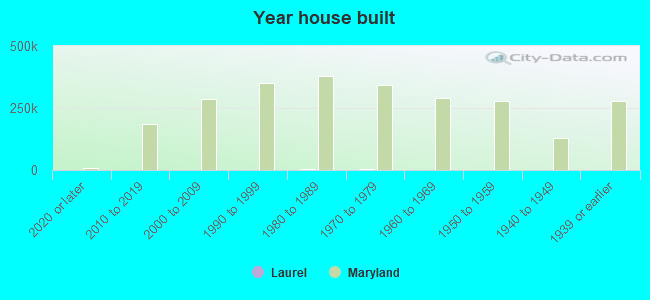
Median year apartment built: 1985
Household type by relationship:
Households: 29,265- Male householders: 4,582 (1,680 living alone), Female householders: 6,811 (2,397 living alone)
4,109 spouses (4,041 opposite-sex spouses), 637 unmarried partners, (616 opposite-sex unmarried partners), 8,990 children (8,664 natural, 84 adopted, 242 stepchildren), 414 grandchildren, 707 brothers or sisters, 1,135 parents, 0 foster children, 744 other relatives, 934 non-relatives
- In group quarters: 195
Size of family households: 2,402 2-persons, 1,551 3-persons, 1,519 4-persons, 905 5-persons, 338 6-persons, 149 7-or-more-persons.
Size of nonfamily households: 4,013 1-person, 626 2-persons, 105 3-persons, 35 4-persons, 16 5-persons.
3,763 married couples with children.
2,275 single-parent households (100 men, 2,175 women).
64.0% of residents of Laurel speak English at home.
16.8% of residents speak Spanish at home (48% speak English very well, 27% speak English well, 19% speak English not well, 7% don't speak English at all).
5.3% of residents speak other Indo-European language at home (69% speak English very well, 17% speak English well, 14% speak English not well).
5.7% of residents speak Asian or Pacific Island language at home (58% speak English very well, 9% speak English well, 16% speak English not well, 17% don't speak English at all).
8.5% of residents speak other language at home (89% speak English very well, 5% speak English well, 6% speak English not well).
Foreign born population: 9,260 (31.6%)
(60.2% of them are naturalized citizens)
| Here: | 6.1 |
| State: | 7.3 |
| Here: | 4.0 |
| State: | 4.2 |
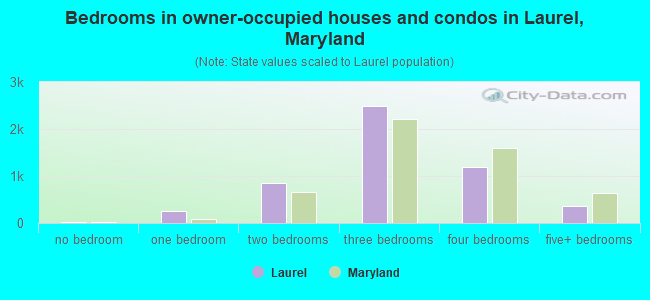
- Bedrooms in owner-occupied houses and condos in Laurel, Maryland
- 29no bedroom
- 2631 bedroom
- 8602 bedrooms
- 2,4963 bedrooms
- 1,1894 bedrooms
- 3625+ bedrooms
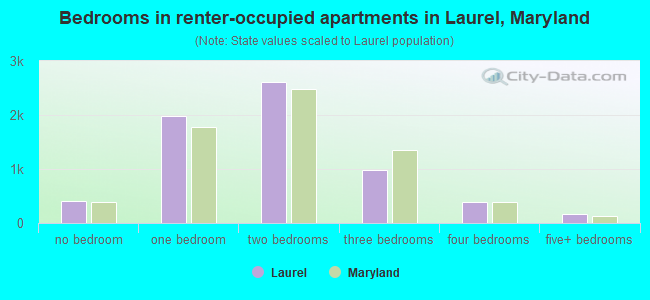
- Bedrooms in renter-occupied apartments in Laurel, Maryland
- 405no bedroom
- 1,9741 bedroom
- 2,6062 bedrooms
- 9753 bedrooms
- 3974 bedrooms
- 1685+ bedrooms
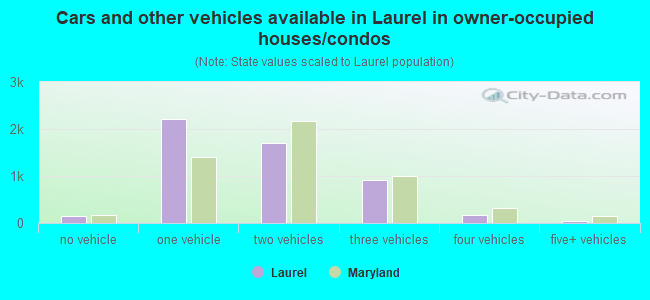
- Cars and other vehicles available in Laurel in owner-occupied houses/condos
- 152no vehicle
- 2,2151 vehicle
- 1,7112 vehicles
- 9053 vehicles
- 1654 vehicles
- 515+ vehicles
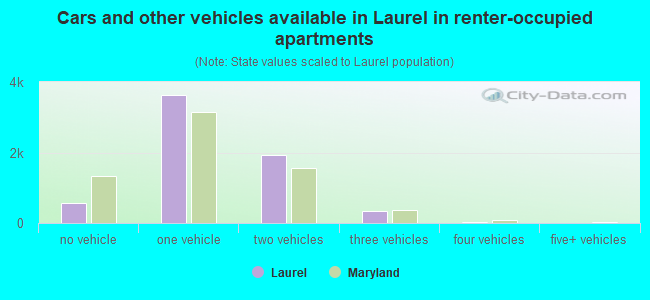
- Cars and other vehicles available in Laurel in renter-occupied apartments
- 575no vehicle
- 3,6261 vehicle
- 1,9332 vehicles
- 3453 vehicles
- 374 vehicles
- 95+ vehicles
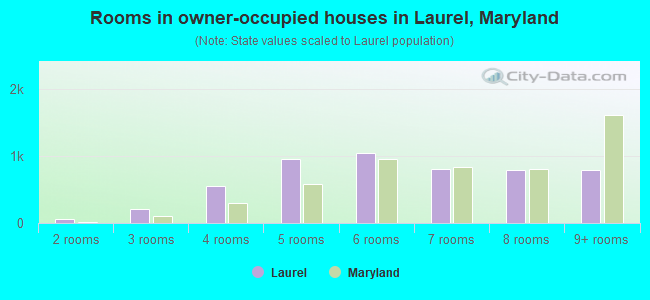
- Rooms in owner-occupied houses in Laurel, Maryland
- 01 room
- 642 rooms
- 2043 rooms
- 5534 rooms
- 9535 rooms
- 1,0406 rooms
- 8027 rooms
- 7948 rooms
- 7899+ rooms
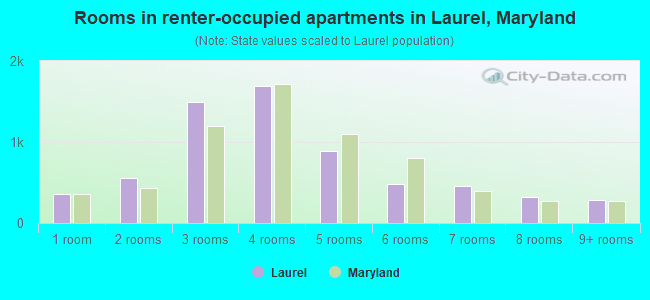
- Rooms in renter-occupied apartments in Laurel, Maryland
- 3641 room
- 5522 rooms
- 1,4913 rooms
- 1,6924 rooms
- 8845 rooms
- 4866 rooms
- 4527 rooms
- 3248 rooms
- 2819+ rooms
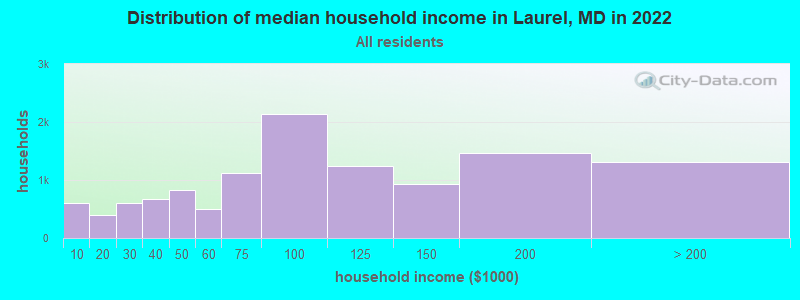
Laurel, MD household income distribution

- 607Less than $10,000
- 389$10,000 to $19,999
- 600$20,000 to $29,999
- 680$30,000 to $39,999
- 831$40,000 to $49,999
- 503$50,000 to $59,999
- 1,125$60,000 to $74,999
- 2,145$75,000 to $99,999
- 1,244$100,000 to $124,999
- 934$125,000 to $149,999
- 1,470$150,000 to $199,999
- 1,309$200,000 or more
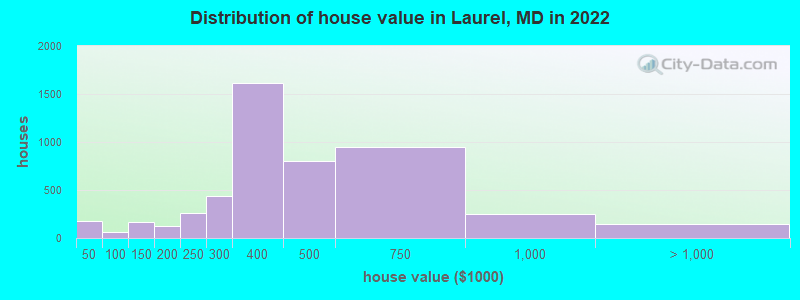
Home value of owner - occupied houses in 2022 in Laurel, MD
-
- 20Less than $10,000
- 9$15,000 to $19,999
- 6$20,000 to $24,999
- 121$25,000 to $29,999
- 23$35,000 to $39,999
- 15$70,000 to $79,999
- 34$80,000 to $89,999
- 15$90,000 to $99,999
- 130$100,000 to $124,999
- 39$125,000 to $149,999
- 36$150,000 to $174,999
- 93$175,000 to $199,999
- 258$200,000 to $249,999
- 439$250,000 to $299,999
- 1,618$300,000 to $399,999
- 800$400,000 to $499,999
- 948$500,000 to $749,999
- 252$750,000 to $999,999
- 55$1,000,000 to $1,499,999
- 92$2,000,000 or more
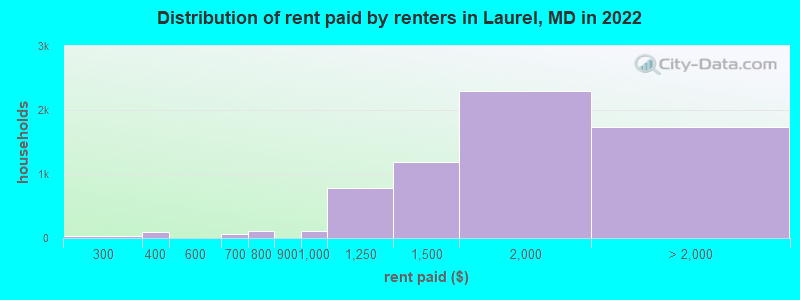
Rent paid by renters in 2022 in Laurel, MD
-
- 28$200 to $249
- 90$300 to $349
- 26$600 to $649
- 38$650 to $699
- 85$700 to $749
- 16$750 to $799
- 5$800 to $899
- 116$900 to $999
- 783$1,000 to $1,249
- 1,189$1,250 to $1,499
- 2,302$1,500 to $1,999
- 1,451$2,000 to $2,499
- 96$2,500 to $2,999
- 63$3,000 to $3,499
- 38$3,500 or more
- 78No cash rent
Percentage of workers working in this county: 52.4%
Number of people working at home: 2,812 (17.2% of all workers)
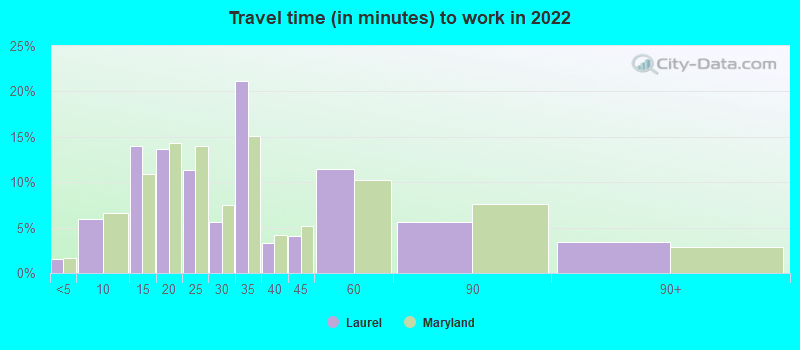
Travel time to work (commute)
- Less than 5 minutes: 195
- 5 to 9 minutes: 871
- 10 to 14 minutes: 1,364
- 15 to 19 minutes: 1,510
- 20 to 24 minutes: 1,473
- 25 to 29 minutes: 944
- 30 to 34 minutes: 1,936
- 35 to 39 minutes: 865
- 40 to 44 minutes: 545
- 45 to 59 minutes: 2,240
- 60 to 89 minutes: 1,173
- 90 or more minutes: 567
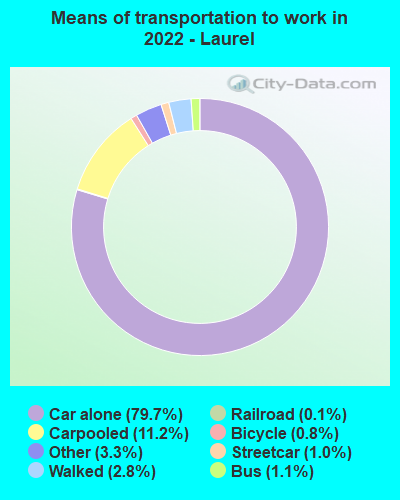
Means of transportation to work:
- Drove a car alone: 11,389 (66.2%)
- Carpooled: 1,456 (8.5%)
- Bus: 114 (0.7%)
- Subway or elevated rail: 95 (0.6%)
- Light rail, streetcar or trolley: 16 (0.1%)
- Taxi: 609 (3.5%)
- Bicycle: 116 (0.7%)
- Walked: 395 (2.3%)
- Worked at home: 2,812 (16.4%)
- Unemployment by race in 2022
- Unemployment rate for White non-Hispanic residents
- 2.6%Males
- 3.6%Females
- Unemployment rate for Black residents
- 5.0%Males
- 4.7%Females
- Unemployment rate for American Indian and Alaska Native residents
- 33.1%Males
- Unemployment rate for Asian residents
- 4.2%Males
- 1.3%Females
- Unemployment rate for other race residents
- 1.1%Males
- 3.8%Females
- Unemployment rate for two or more race residents
- 6.7%Males
- 17.3%Females
- Unemployment rate for Hispanic or Latino residents
- 2.5%Males
- 6.0%Females
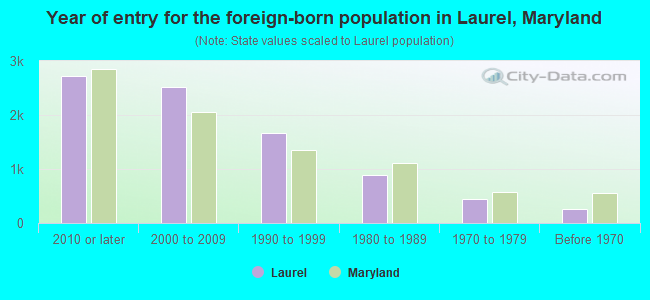
- Year of entry for the foreign-born population in Laurel, Maryland
- 2,7172010 or later
- 2,5262000 to 2009
- 1,6751990 to 1999
- 8821980 to 1989
- 4421970 to 1979
- 258Before 1970
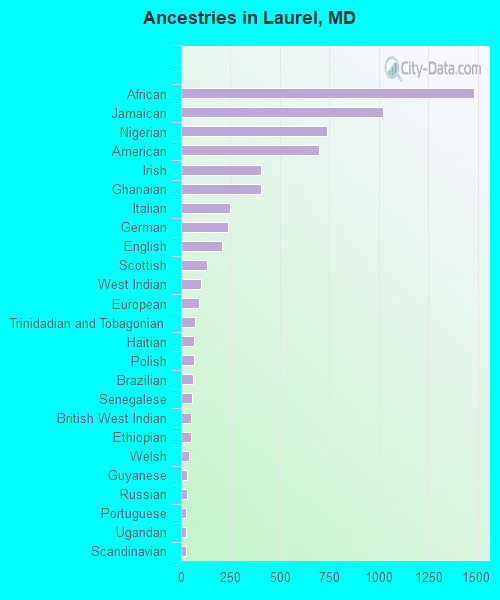
First ancestries reported:
- African: 1,482 (7.7%)
- Jamaican: 1,023 (5.3%)
- Nigerian: 737 (3.8%)
- American: 699 (3.6%)
- Irish: 405 (2.1%)
- Ghanaian: 402 (2.1%)
- Italian: 248 (1.3%)
- German: 238 (1.2%)
- English: 208 (1.1%)
- Scottish: 132 (0.7%)
- West Indian: 99 (0.5%)
- European: 89 (0.5%)
- Trinidadian and Tobagonian: 69 (0.4%)
- Haitian: 68 (0.4%)
- Polish: 65 (0.3%)
- Brazilian: 61 (0.3%)
- Senegalese: 54 (0.3%)
- British West Indian: 53 (0.3%)
- Ethiopian: 51 (0.3%)
- Welsh: 41 (0.2%)
- Guyanese: 31 (0.2%)
- Russian: 28 (0.1%)
- Portuguese: 27 (0.1%)
- Ugandan: 24 (0.1%)
- Scandinavian: 23 (0.1%)
- Greek: 23 (0.1%)
- Syrian: 22 (0.1%)
- Scotch-Irish: 18 (0.09%)
- Canadian: 16 (0.08%)
- Turkish: 15 (0.08%)
- Norwegian: 12 (0.06%)
- British: 7 (0.04%)
- Barbadian: 7 (0.04%)
- Jordanian: 5 (0.03%)
- Dutch: 4 (0.02%)
- Swiss: 4 (0.02%)
- Cajun: 3 (0.02%)
- French: 3 (0.02%)
- Kenyan: 1 (0.01%)
Most common places of birth for foreign-born residents (%):
| Laurel: | 17.6% (1,607) |
| Maryland: | 12.0% (115,412) |
| Laurel: | 13.2% (1,204) |
| Maryland: | 4.6% (44,825) |
| Laurel: | 11.4% (1,040) |
| Maryland: | 2.8% (27,444) |
| Laurel: | 10.9% (997) |
| Maryland: | 1.8% (17,774) |
| Laurel: | 7.5% (689) |
| Maryland: | 3.4% (32,635) |
| Laurel: | 5.6% (509) |
| Maryland: | 3.5% (34,065) |
| Laurel: | 5.1% (465) |
| Maryland: | 6.4% (61,725) |
| Laurel: | 3.9% (358) |
| Maryland: | 4.4% (42,350) |
| Laurel: | 3.3% (302) |
| Maryland: | 3.8% (36,698) |
| Laurel: | 2.8% (252) |
| Maryland: | 2.5% (24,026) |
| Laurel: | 1.5% (139) |
| Maryland: | 1.8% (17,037) |
Place of birth for U.S.-born residents:
- This state: 10,117
- Other state: 9,840
- Northeast: 2,581
- Midwest: 1,217
- South: 5,492
- West: 838
83.3% of Laurel residents lived in the same house 1 years ago.
Out of people who lived in different houses, 36.7% lived in this county.
Out of people who lived in different counties, 74.0% lived in Maryland.
| Laurel: | 83.3% |
| State average: | 88.5% |
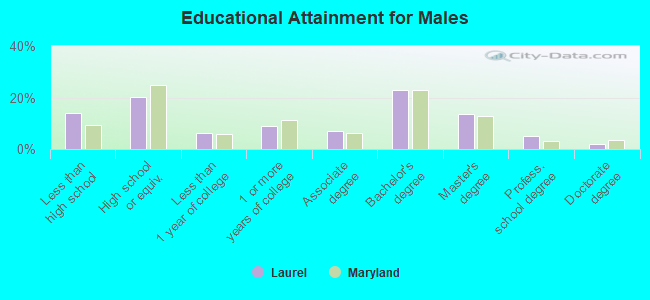
Education attainment for males 25 years and older:
- No schooling: 194
- Nursery to 4th grade: 56
- 5th and 6th grade: 227
- 7th and 8th grade: 103
- 9th grade: 98
- 10th grade: 39
- 11th grade: 50
- 12th grade, no diploma: 508
- High school graduate (or equivalency): 1,823
- Less than 1 year of college: 551
- Some college more than 1 year, no degree: 815
- Associate degree: 629
- Bachelor's degree: 2,072
- Master's degree: 1,224
- Professional school degree: 449
- Doctorate degree: 179
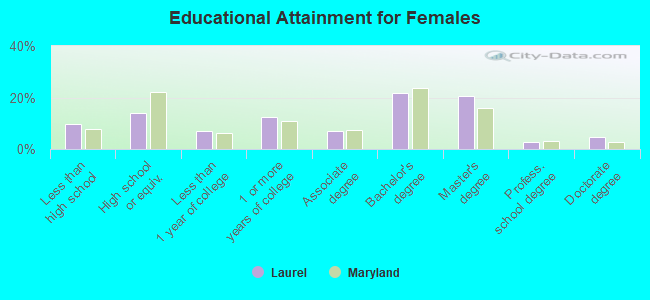
Education attainment for females 25 years and older:
- No schooling: 368
- Nursery to 4th grade: 98
- 5th and 6th grade: 67
- 7th and 8th grade: 125
- 9th grade: 74
- 10th grade: 37
- 11th grade: 45
- 12th grade, no diploma: 260
- High school graduate (or equivalency): 1,573
- Less than 1 year of college: 788
- Some college more than 1 year, no degree: 1,371
- Associate degree: 784
- Bachelor's degree: 2,415
- Master's degree: 2,276
- Professional school degree: 320
- Doctorate degree: 512
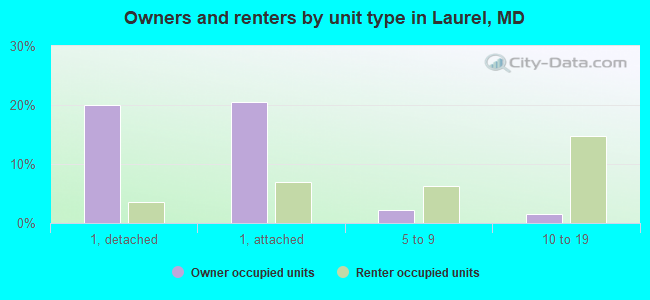
Housing units in structures:
- One, detached: 3,042
- One, attached: 3,705
- Two: 181
- 3 or 4: 399
- 5 to 9: 1,105
- 10 to 19: 1,505
- 20 to 49: 651
- 50 or more: 2,076
Housing units lacking complete kitchen facilities in 2022: 1.0%
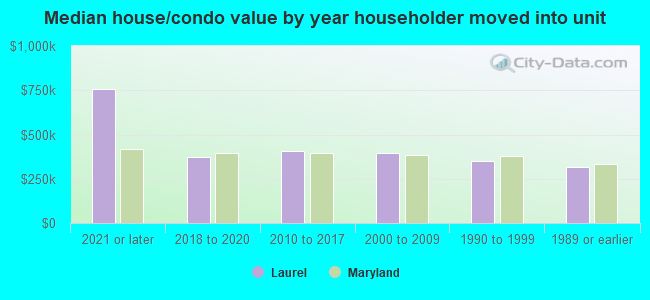
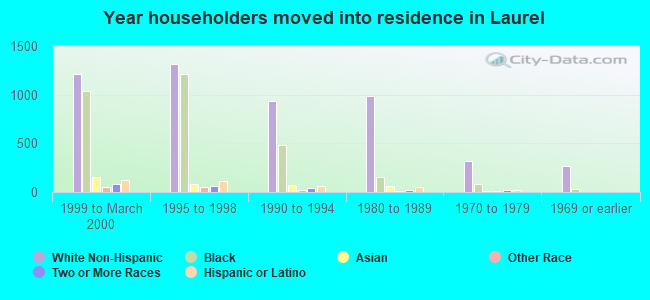
House/condo owner moved in on average 10 years ago
Renter moved in on average 2 years ago
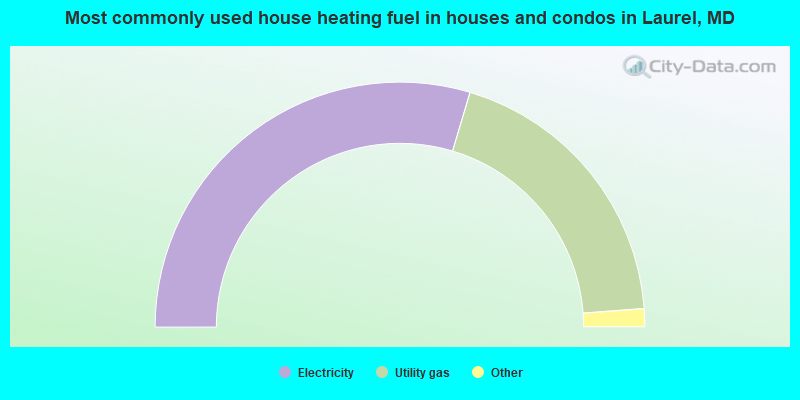
- 59.3%Electricity
- 38.4%Utility gas
- 1.0%Bottled, tank, or LP gas
- 0.7%Fuel oil, kerosene, etc.
- 0.4%Solar energy
- 0.3%No fuel used
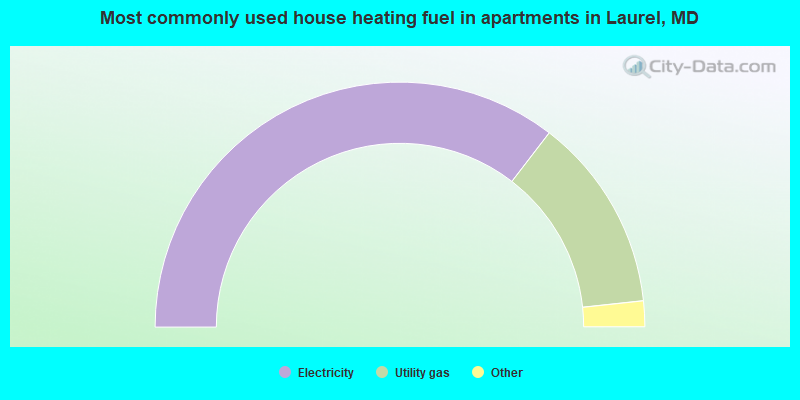
- 70.8%Electricity
- 25.7%Utility gas
- 1.5%No fuel used
- 1.1%Fuel oil, kerosene, etc.
- 0.6%Bottled, tank, or LP gas
- 0.2%Other fuel
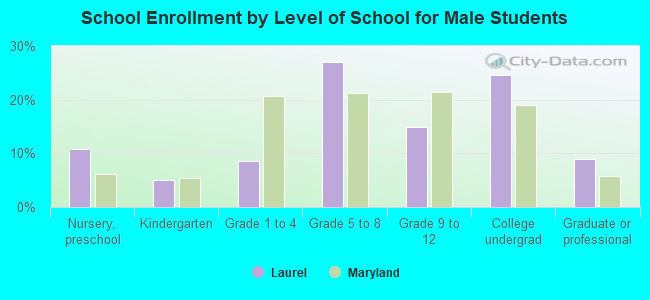
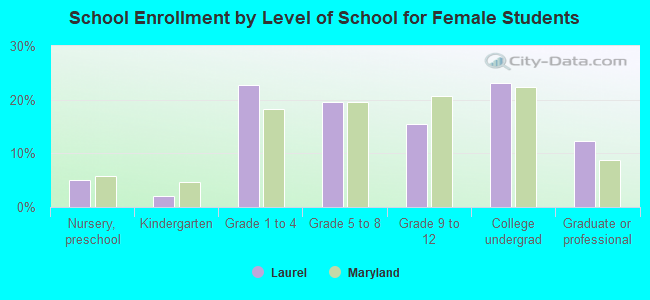
Private vs. public school enrollment:
| Here: | 12.9% |
| Maryland: | 15.2% |
| Here: | 17.0% |
| Maryland: | 14.4% |
| Here: | 16.3% |
| Maryland: | 20.2% |