Lincoln Park, NJ (New Jersey) Houses and Residents
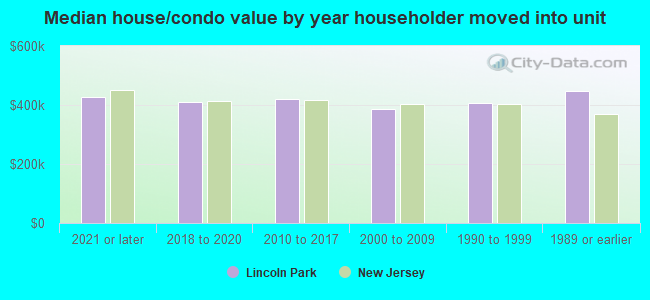
| Lincoln Park: | $419,046 |
| New Jersey: | $428,900 |
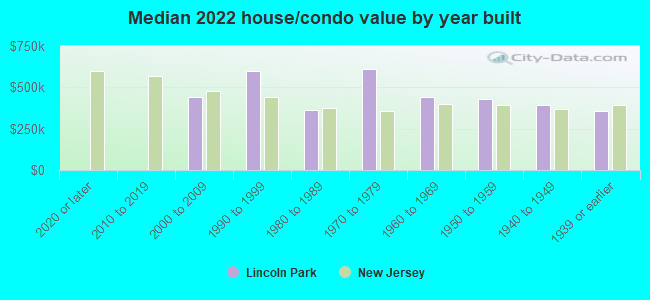
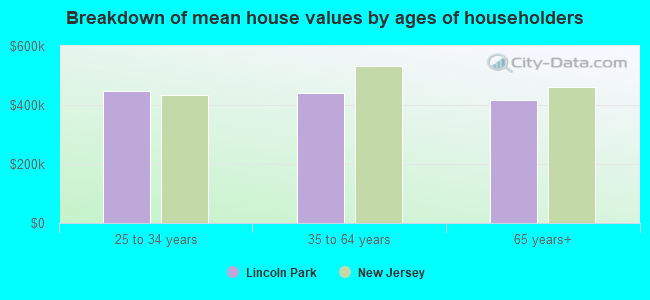
Mean price in 2022:
Detached houses: $569,131
Here: $569,131 State: $537,591 Townhouses or other attached units: $551,659
Here: $551,659 State: $381,113 In 2-unit structures: $497,024
Here: $497,024 State: $444,476 In 3-to-4-unit structures: $466,853
Here: $466,853 State: $457,463 In 5-or-more-unit structures: $274,182
Here: $274,182 State: $368,745
Total population: 10,482 (All urban)
Houses: 4,275 (4,146 occupied: 3,265 owner occupied, 950 renter occupied)
| % of renters here: | 23% |
| State: | 35% |
Housing density: 635 houses/condos per square mile
Median price asked for vacant for-sale houses and condos in 2022 in this county: $423,360.
Median contract rent in 2022: $1,481 (lower quartile is $1,284, upper quartile is $1,795)
Median rent asked for vacant for-rent units in 2022: $1,409
Median gross rent in Lincoln Park, NJ in 2022: $1,610
Housing units in Lincoln Park with a mortgage: 2,235 (211 second mortgage, 0 home equity loan, 231 both second mortgage and home equity loan)
Houses without a mortgage: 40
Median household income for houses/condos with a mortgage: $140,134
Median household income for apartments without a mortgage: $92,020
Median monthly housing costs: $2,074
Compare current foreclosures near Lincoln Park, NJ:
| Photo | Address | Area | Beds / Baths | Price | Details |
|---|---|---|---|---|---|

|
#1
Stonyridge Dr
Lincoln Park, NJ 07035
|
782 sq. feet
|
- baths 2 beds |
show details | |

|
#2
Stonyridge Dr # 4
Lincoln Park, NJ 07035
|
613 sq. feet
|
- baths 1 beds |
show details | |

|
#3
Bristol Ct
Lincoln Park, NJ 07035
|
1,548 sq. feet
|
- baths 2 beds |
show details | |

|
#4
Boonton Tpke
Lincoln Park, NJ 07035
|
1,480 sq. feet
|
- baths - beds |
show details | |

|
#5
Alder St
Lincoln Park, NJ 07035
|
1,536 sq. feet
|
- baths - beds |
show details | |

|
#6
Harvest Ln
Lincoln Park, NJ 07035
|
1,271 sq. feet
|
- baths - beds |
show details | |

|
#7
Kirschner Ave
Lincoln Park, NJ 07035
|
2,209 sq. feet
|
- baths - beds |
show details | |

|
#8
Alpine Dr # Bb
Lincoln Park, NJ 07035
|
1,395 sq. feet
|
- baths - beds |
show details | |

|
#9
Main St
Lincoln Park, NJ 07035
|
1,010 sq. feet
|
- baths - beds |
show details | |

|
#10
Beaverbrook Rd
Lincoln Park, NJ 07035
|
- sq. feet
|
- baths - beds |
show details |
| Photo | Address | Area | Beds / Baths | Price | Details |
|---|---|---|---|---|---|

|
#11
Hillview Rd
Lincoln Park, NJ 07035
|
3,540 sq. feet
|
- baths - beds |
show details | |

|
#12
Pine Brook Rd
Lincoln Park, NJ 07035
|
1,544 sq. feet
|
- baths - beds |
show details | |

|
#13
Riveredge Rd
Lincoln Park, NJ 07035
|
640 sq. feet
|
- baths - beds |
show details | |

|
#14
Hillvew Rd And 2 Hillview Rd
Lincoln Park, NJ 07035
|
- sq. feet
|
- baths - beds |
show details | |

|
#15
Alpine Dr
Lincoln Park, NJ 07035
|
1,395 sq. feet
|
- baths - beds |
show details | |

|
#16
Valley Rd
Lincoln Park, NJ 07035
|
1,078 sq. feet
|
- baths - beds |
show details | |

|
#17
Orchard Ave
Lincoln Park, NJ 07035
|
1,450 sq. feet
|
- baths - beds |
show details | |

|
#18
Hemlock Ave
Lincoln Park, NJ 07035
|
1,382 sq. feet
|
- baths - beds |
show details | |

|
#19
John St
Lincoln Park, NJ 07035
|
1,404 sq. feet
|
- baths - beds |
show details | |

|
#20
Riveredge Rd
Lincoln Park, NJ 07035
|
640 sq. feet
|
- baths - beds |
show details |
| Photo | Address | Area | Beds / Baths | Price | Details |
|---|---|---|---|---|---|

|
#21
Oak St
Lincoln Park, NJ 07035
|
1,228 sq. feet
|
- baths - beds |
show details | |

|
#22
Kirschner Ave
Lincoln Park, NJ 07035
|
1,608 sq. feet
|
- baths - beds |
show details | |

|
#23
Main St
Lincoln Park, NJ 07035
|
4,385 sq. feet
|
- baths - beds |
show details | |

|
#24
Mountain Heights Ave
Lincoln Park, NJ 07035
|
1,512 sq. feet
|
- baths - beds |
show details | |

|
#25
Pine Brook Rd
Lincoln Park, NJ 07035
|
1,544 sq. feet
|
- baths - beds |
show details | |

|
#26
Alpine Dr # 21
Lincoln Park, NJ 07035
|
1,395 sq. feet
|
- baths - beds |
show details | |

|
#27
Oakdale Mnr Apt A6d
Suffern, NY 10901
|
750 sq. feet
|
1 baths 1 beds |
$99,900
|
show details |

|
#28
Bloomfield Ave
Caldwell, NJ 07006
|
1,216 sq. feet
|
2 baths 2 beds |
$400,000
|
show details |

|
#29
S Orange Ave
Newark, NJ 07103
|
989 sq. feet
|
1 baths 2 beds |
$289,900
|
show details |

|
#30
Beverly Rd
Oradell, NJ 07649
|
1,200 sq. feet
|
1 baths 3 beds |
$569,900
|
show details |
| Photo | Address | Area | Beds / Baths | Price | Details |
|---|---|---|---|---|---|

|
#31
Maple Ave
Stockholm, NJ 07460
|
1,305 sq. feet
|
1 baths 3 beds |
$364,900
|
show details |

|
#32
Passaic St
Hackensack, NJ 07601
|
2,211 sq. feet
|
1 baths 5 beds |
$619,900
|
show details |

|
#33
Wales Ave
River Edge, NJ 07661
|
4,223 sq. feet
|
2 baths 4 beds |
$624,000
|
show details |

|
#34
S Beverwyck Rd
Parsippany, NJ 07054
|
895 sq. feet
|
1 baths 3 beds |
$306,800
|
show details |

|
#35
Summer St Apt 5e
Passaic, NJ 07055
|
1,125 sq. feet
|
1 baths 2 beds |
$345,000
|
show details |

|
#36
Forest Ave
Paramus, NJ 07652
|
2,428 sq. feet
|
3 baths 5 beds |
$749,900
|
show details |

|
#37
Ashland Ave
East Orange, NJ 07017
|
2,254 sq. feet
|
1 baths 5 beds |
$272,000
|
show details |

|
#38
Alpine 175
Lincoln Park, NJ 07035
|
- sq. feet
|
- baths - beds |
show details | |

|
#39
Glannon Rd
Livingston, NJ 07039
|
- sq. feet
|
1 baths 3 beds |
$535,600
|
show details |

|
#40
Fifth Street
Hillburn, NY 10931
|
- sq. feet
|
1 baths 3 beds |
$462,800
|
show details |
| Photo | Address | Area | Beds / Baths | Price | Details |
|---|---|---|---|---|---|

|
#41
6th St
Hillburn, NY 10931
|
2,469 sq. feet
|
3 baths 5 beds |
show details | |

|
#42
19th Ave
Irvington, NJ 07111
|
2,412 sq. feet
|
2 baths 6 beds |
show details | |

|
#43
Sherman Ave
Paterson, NJ 07502
|
2,288 sq. feet
|
2 baths 5 beds |
show details | |

|
#44
Alder Ave
Wayne, NJ 07470
|
3,093 sq. feet
|
2 baths 4 beds |
show details | |

|
#45
Rhode Island Ave
East Orange, NJ 07018
|
3,698 sq. feet
|
2 baths 8 beds |
show details | |

|
#46
Prospect Ave
North Arlington, NJ 07031
|
1,480 sq. feet
|
2 baths 3 beds |
show details | |

|
#47
Midland Ave
East Orange, NJ 07017
|
1,558 sq. feet
|
1 baths 3 beds |
show details | |

|
#48
Grace Ave
Garfield, NJ 07026
|
1,042 sq. feet
|
1 baths 3 beds |
show details | |

|
#49
Juniper St
Dumont, NJ 07628
|
1,550 sq. feet
|
2 baths 3 beds |
show details | |

|
Check over 1 million property listings on Foreclosure.com!
|
browse all offers | |||


 | Looking at houses in Jefferson Twp. (22 replies) |
| Is it good place to live? (Jersey City, Lincoln Park: apartment, rent) (10 replies) |
| Looking for a house in NJ (23 replies) |
| nj condo with 50% arrears (28 replies) |
| Express buses to Manhattan from - Wayne, Oakland, Montville, Parsipanny, Denville, .... (18 replies) |
| North eastern Morris County school quality by town (1 reply) |

Median year apartment built: 1971
Household type by relationship:
Households: 10,933- Male householders: 2,257 (664 living alone), Female householders: 1,878 (543 living alone)
2,093 spouses (2,077 opposite-sex spouses), 152 unmarried partners, (152 opposite-sex unmarried partners), 3,045 children (2,968 natural, 53 adopted, 24 stepchildren), 140 grandchildren, 103 brothers or sisters, 243 parents, 0 foster children, 139 other relatives, 201 non-relatives
- In group quarters: 677
Size of family households: 1,254 2-persons, 624 3-persons, 680 4-persons, 138 5-persons, 84 6-persons, 50 7-or-more-persons.
Size of nonfamily households: 1,167 1-person, 219 2-persons, 7 4-persons.
1,240 married couples with children.
171 single-parent households (17 men, 154 women).
73.5% of residents of Lincoln Park speak English at home.
9.9% of residents speak Spanish at home (66% speak English very well, 18% speak English well, 16% speak English not well).
13.1% of residents speak other Indo-European language at home (59% speak English very well, 21% speak English well, 16% speak English not well, 4% don't speak English at all).
2.4% of residents speak Asian or Pacific Island language at home (66% speak English very well, 11% speak English well, 20% speak English not well, 4% don't speak English at all).
1.9% of residents speak other language at home (77% speak English very well, 23% speak English well).
Foreign born population: 1,855 (17.0%)
(75.7% of them are naturalized citizens)
| Here: | 6.2 |
| State: | 6.8 |
| Here: | 3.5 |
| State: | 3.9 |
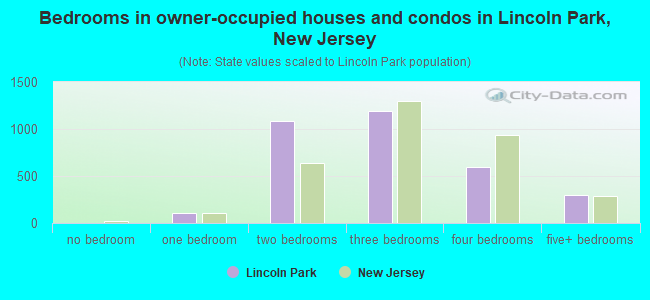
- Bedrooms in owner-occupied houses and condos in Lincoln Park, New Jersey
- 0no bedroom
- 1031 bedroom
- 1,0882 bedrooms
- 1,1873 bedrooms
- 5944 bedrooms
- 2935+ bedrooms
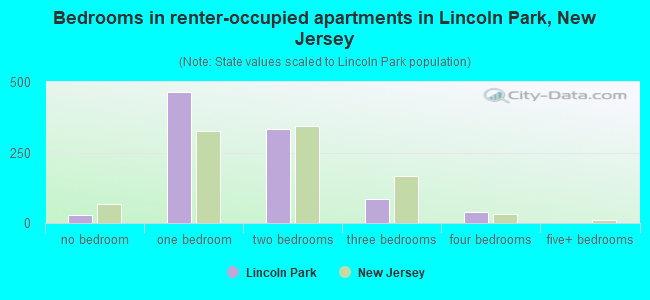
- Bedrooms in renter-occupied apartments in Lincoln Park, New Jersey
- 27no bedroom
- 4661 bedroom
- 3352 bedrooms
- 843 bedrooms
- 394 bedrooms
- 05+ bedrooms
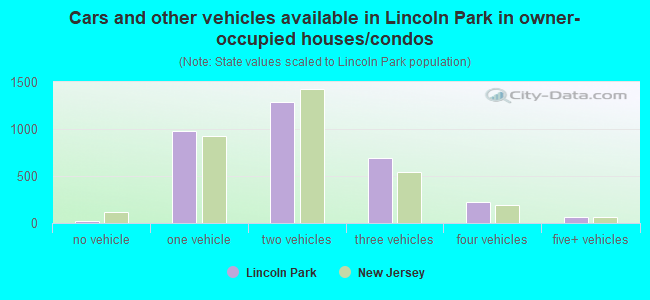
- Cars and other vehicles available in Lincoln Park in owner-occupied houses/condos
- 18no vehicle
- 9781 vehicle
- 1,2902 vehicles
- 6923 vehicles
- 2224 vehicles
- 655+ vehicles
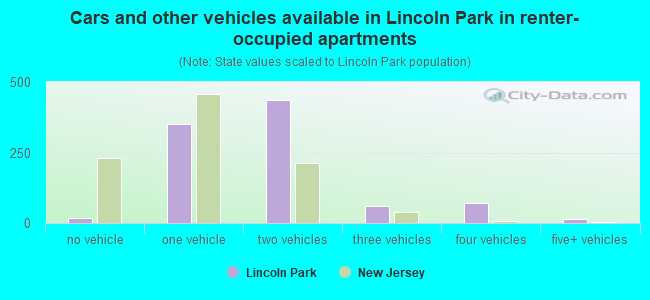
- Cars and other vehicles available in Lincoln Park in renter-occupied apartments
- 16no vehicle
- 3521 vehicle
- 4372 vehicles
- 603 vehicles
- 714 vehicles
- 135+ vehicles
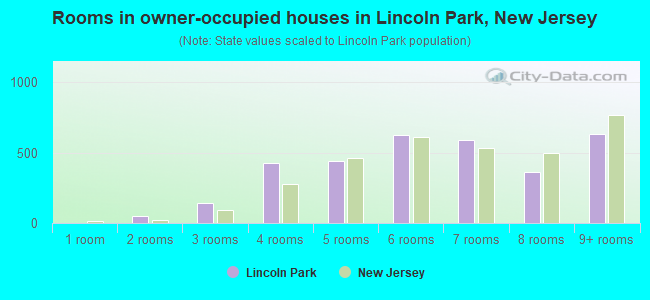
- Rooms in owner-occupied houses in Lincoln Park, New Jersey
- 01 room
- 512 rooms
- 1413 rooms
- 4274 rooms
- 4385 rooms
- 6256 rooms
- 5867 rooms
- 3638 rooms
- 6349+ rooms
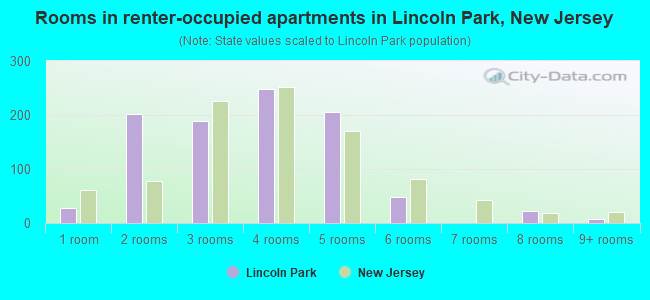
- Rooms in renter-occupied apartments in Lincoln Park, New Jersey
- 271 room
- 2022 rooms
- 1893 rooms
- 2494 rooms
- 2055 rooms
- 486 rooms
- 07 rooms
- 238 rooms
- 89+ rooms
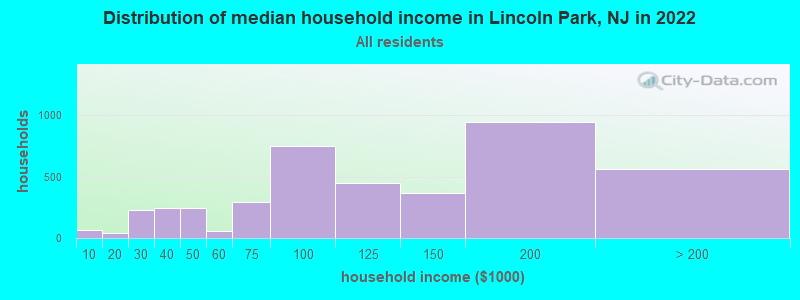
Lincoln Park, NJ household income distribution

- 69Less than $10,000
- 42$10,000 to $19,999
- 228$20,000 to $29,999
- 247$30,000 to $39,999
- 243$40,000 to $49,999
- 54$50,000 to $59,999
- 296$60,000 to $74,999
- 747$75,000 to $99,999
- 451$100,000 to $124,999
- 371$125,000 to $149,999
- 946$150,000 to $199,999
- 559$200,000 or more
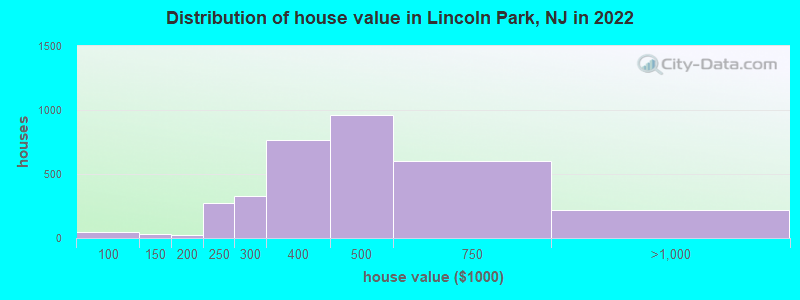
Home value of owner - occupied houses in 2022 in Lincoln Park, NJ
-
- 38$60,000 to $69,999
- 8$70,000 to $79,999
- 27$100,000 to $124,999
- 9$150,000 to $174,999
- 15$175,000 to $199,999
- 271$200,000 to $249,999
- 326$250,000 to $299,999
- 761$300,000 to $399,999
- 963$400,000 to $499,999
- 600$500,000 to $749,999
- 216$750,000 to $999,999
- 3$1,000,000 to $1,499,999
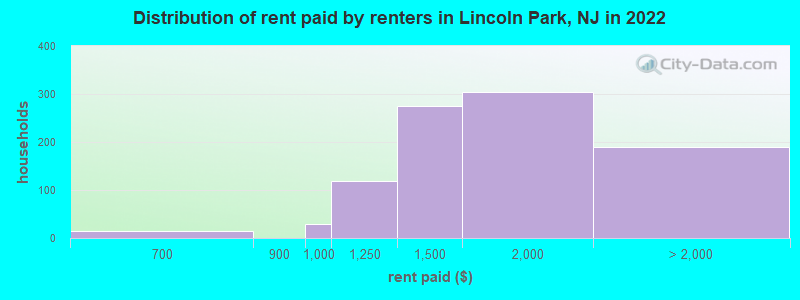
Rent paid by renters in 2022 in Lincoln Park, NJ
-
- 14$650 to $699
- 30$900 to $999
- 118$1,000 to $1,249
- 276$1,250 to $1,499
- 304$1,500 to $1,999
- 120$2,000 to $2,499
- 24$3,000 to $3,499
- 45No cash rent
Percentage of workers working in this county: 43.1%
Number of people working at home: 875 (14.8% of all workers)
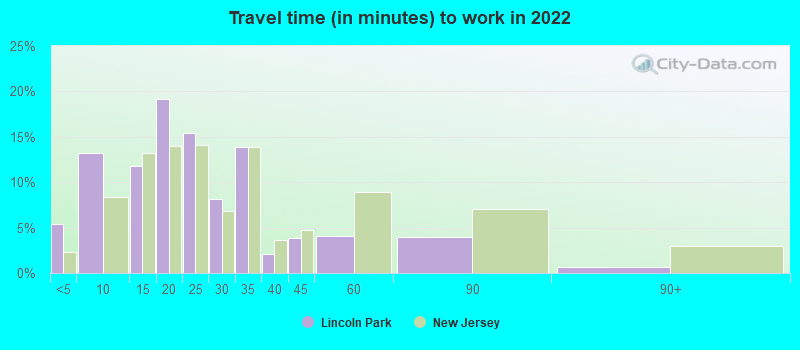
Travel time to work (commute)
- Less than 5 minutes: 180
- 5 to 9 minutes: 267
- 10 to 14 minutes: 612
- 15 to 19 minutes: 593
- 20 to 24 minutes: 756
- 25 to 29 minutes: 291
- 30 to 34 minutes: 707
- 35 to 39 minutes: 152
- 40 to 44 minutes: 308
- 45 to 59 minutes: 311
- 60 to 89 minutes: 575
- 90 or more minutes: 129
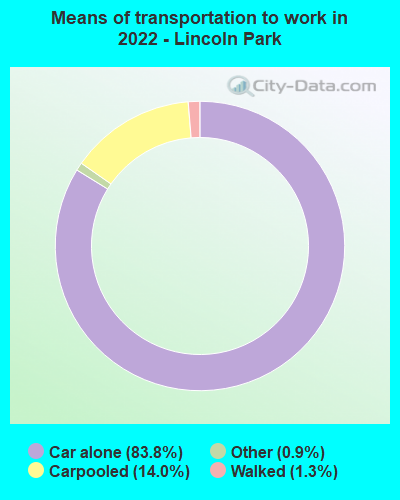
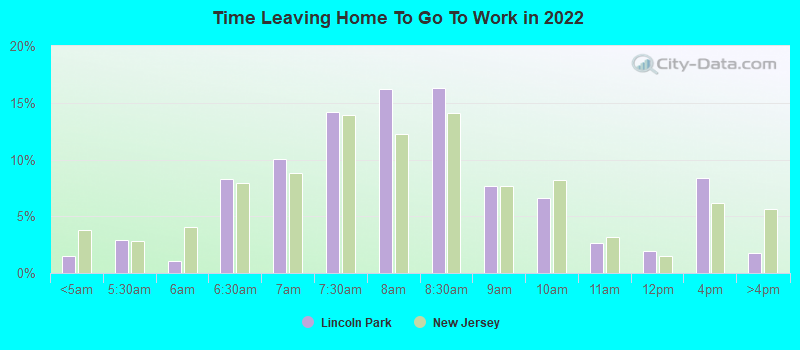
Means of transportation to work:
- Drove a car alone: 1,853 (61.1%)
- Carpooled: 314 (10.4%)
- Taxi: 24 (0.8%)
- Walked: 40 (1.3%)
- Worked at home: 875 (28.8%)
- Unemployment by race in 2022
- Unemployment rate for White non-Hispanic residents
- 8.1%Males
- 5.2%Females
- Unemployment rate for two or more race residents
- 6.3%Males
- 6.6%Females
- Unemployment rate for Hispanic or Latino residents
- 6.0%Males
- 16.0%Females
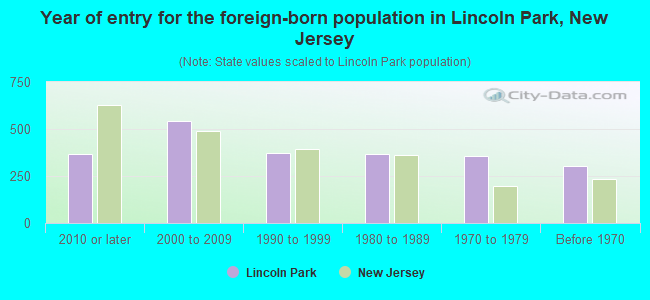
- Year of entry for the foreign-born population in Lincoln Park, New Jersey
- 3652010 or later
- 5402000 to 2009
- 3751990 to 1999
- 3681980 to 1989
- 3551970 to 1979
- 301Before 1970
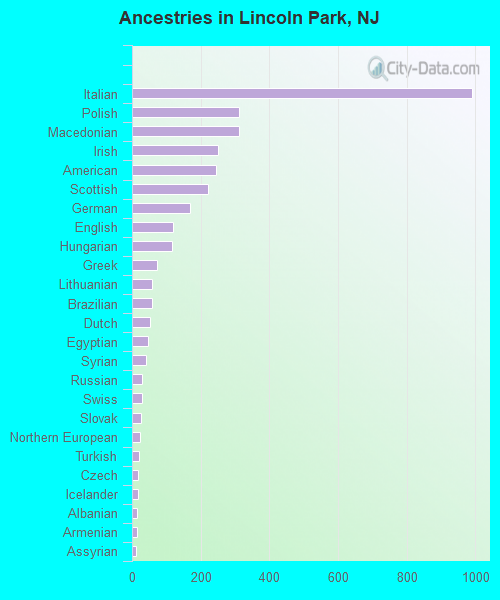
First ancestries reported:
- Italian: 990 (20.2%)
- Polish: 313 (6.4%)
- Macedonian: 312 (6.4%)
- Irish: 250 (5.1%)
- American: 245 (5.0%)
- Scottish: 222 (4.5%)
- German: 170 (3.5%)
- English: 119 (2.4%)
- Hungarian: 116 (2.4%)
- Greek: 73 (1.5%)
- Lithuanian: 59 (1.2%)
- Brazilian: 58 (1.2%)
- Dutch: 53 (1.1%)
- Egyptian: 46 (0.9%)
- Syrian: 42 (0.9%)
- Russian: 28 (0.6%)
- Swiss: 28 (0.6%)
- Slovak: 27 (0.6%)
- Northern European: 23 (0.5%)
- Turkish: 19 (0.4%)
- Czech: 18 (0.4%)
- Icelander: 18 (0.4%)
- Albanian: 15 (0.3%)
- Armenian: 14 (0.3%)
- Assyrian: 12 (0.2%)
- British: 12 (0.2%)
- Scotch-Irish: 12 (0.2%)
- Eastern European: 10 (0.2%)
- Welsh: 7 (0.1%)
- Ukrainian: 4 (0.08%)
- Maltese: 2 (0.04%)
- Jamaican: 2 (0.04%)
Most common places of birth for foreign-born residents (%):
| Lincoln Park: | 18.6% (358) |
| New Jersey: | 0.2% (5,094) |
| Lincoln Park: | 9.4% (181) |
| New Jersey: | 12.8% (274,609) |
| Lincoln Park: | 6.0% (116) |
| New Jersey: | 0.3% (6,972) |
| Lincoln Park: | 5.8% (112) |
| New Jersey: | 2.7% (58,563) |
| Lincoln Park: | 4.7% (90) |
| New Jersey: | 1.5% (33,198) |
| Lincoln Park: | 4.1% (79) |
| New Jersey: | 0.2% (3,968) |
| Lincoln Park: | 4.1% (79) |
| New Jersey: | 2.3% (48,811) |
| Lincoln Park: | 3.2% (61) |
| New Jersey: | 2.1% (45,435) |
| Lincoln Park: | 3.0% (57) |
| New Jersey: | 4.4% (95,275) |
| Lincoln Park: | 2.8% (54) |
| New Jersey: | 0.5% (10,886) |
| Lincoln Park: | 2.8% (54) |
| New Jersey: | 1.3% (27,580) |
| Lincoln Park: | 2.7% (51) |
| New Jersey: | 4.0% (85,934) |
| Lincoln Park: | 2.5% (49) |
| New Jersey: | 0.2% (3,369) |
| Lincoln Park: | 2.2% (42) |
| New Jersey: | 0.3% (7,501) |
| Lincoln Park: | 1.7% (33) |
| New Jersey: | 1.7% (37,335) |
| Lincoln Park: | 1.7% (32) |
| New Jersey: | 1.6% (33,678) |
| Lincoln Park: | 1.5% (29) |
| New Jersey: | 0.0% (503) |
| Lincoln Park: | 1.5% (29) |
| New Jersey: | 4.2% (90,817) |
Place of birth for U.S.-born residents:
- This state: 6,963
- Other state: 1,930
- Northeast: 1,630
- Midwest: 168
- South: 70
- West: 74
91.2% of Lincoln Park residents lived in the same house 1 years ago.
Out of people who lived in different houses, 17.5% lived in this county.
Out of people who lived in different counties, 82.4% lived in New Jersey.
| Lincoln Park: | 91.2% |
| State average: | 90.4% |
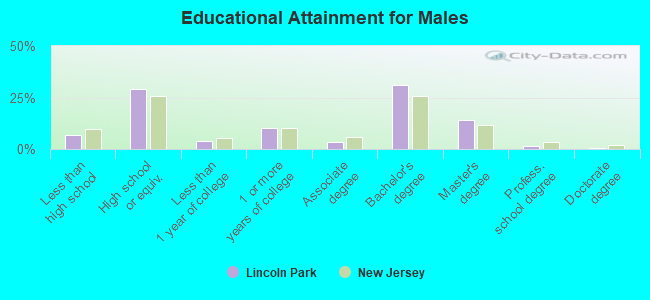
Education attainment for males 25 years and older:
- No schooling: 78
- Nursery to 4th grade: 0
- 5th and 6th grade: 15
- 7th and 8th grade: 21
- 9th grade: 0
- 10th grade: 18
- 11th grade: 8
- 12th grade, no diploma: 141
- High school graduate (or equivalency): 1,207
- Less than 1 year of college: 152
- Some college more than 1 year, no degree: 417
- Associate degree: 138
- Bachelor's degree: 1,280
- Master's degree: 574
- Professional school degree: 66
- Doctorate degree: 19
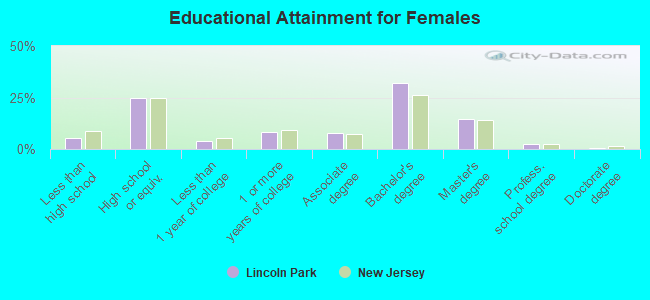
Education attainment for females 25 years and older:
- No schooling: 16
- Nursery to 4th grade: 7
- 5th and 6th grade: 17
- 7th and 8th grade: 73
- 9th grade: 8
- 10th grade: 45
- 11th grade: 28
- 12th grade, no diploma: 31
- High school graduate (or equivalency): 1,061
- Less than 1 year of college: 160
- Some college more than 1 year, no degree: 355
- Associate degree: 340
- Bachelor's degree: 1,376
- Master's degree: 626
- Professional school degree: 100
- Doctorate degree: 29


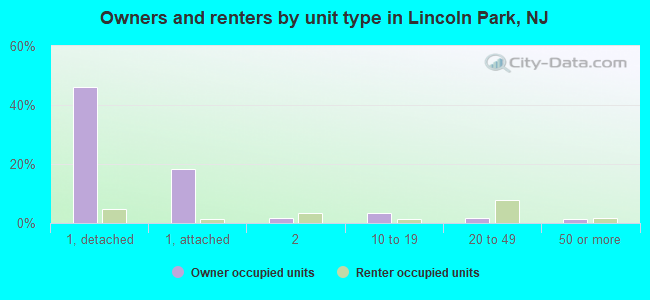
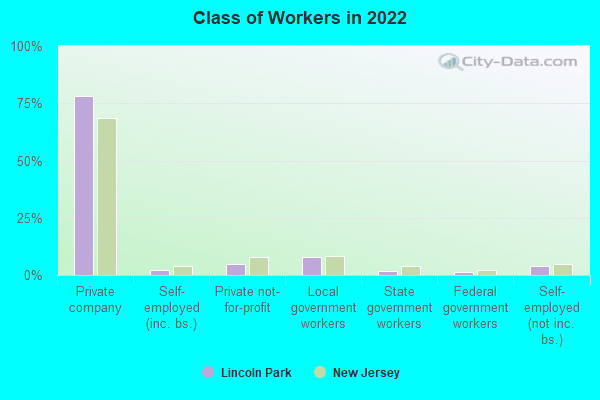
Housing units in structures:
- One, detached: 2,392
- One, attached: 741
- Two: 78
- 3 or 4: 60
- 5 to 9: 128
- 10 to 19: 272
- 20 to 49: 535
- 50 or more: 65
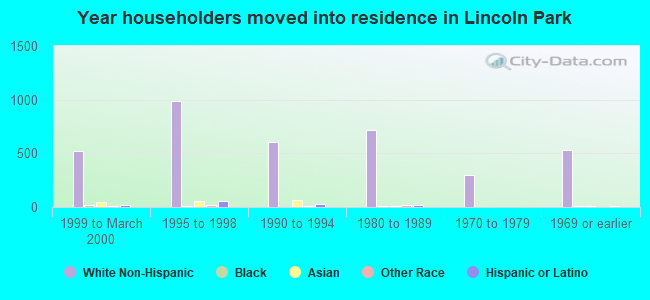
House/condo owner moved in on average 13 years ago
Renter moved in on average 5 years ago
- 90.2%Utility gas
- 7.7%Fuel oil, kerosene, etc.
- 1.4%Bottled, tank, or LP gas
- 0.7%Electricity
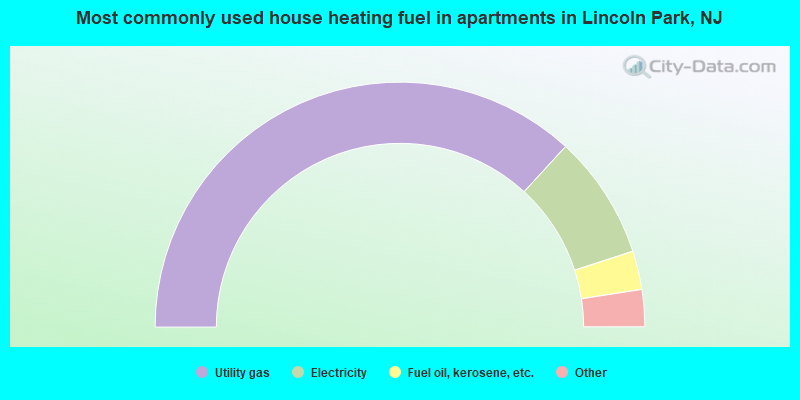
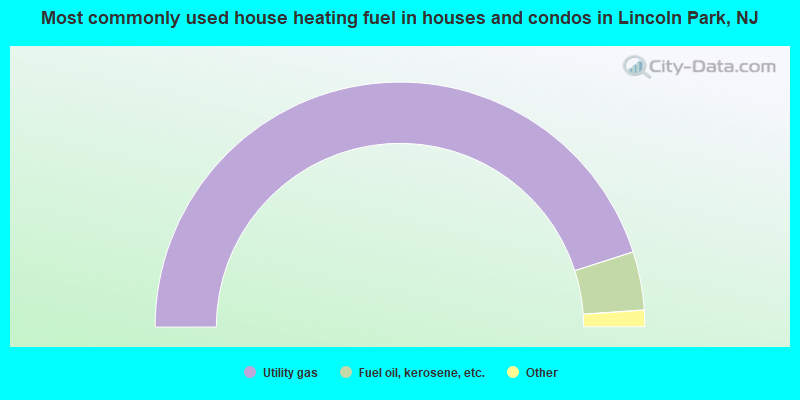
- 73.8%Utility gas
- 16.4%Electricity
- 5.1%Fuel oil, kerosene, etc.
- 2.5%Bottled, tank, or LP gas
- 2.3%Other fuel
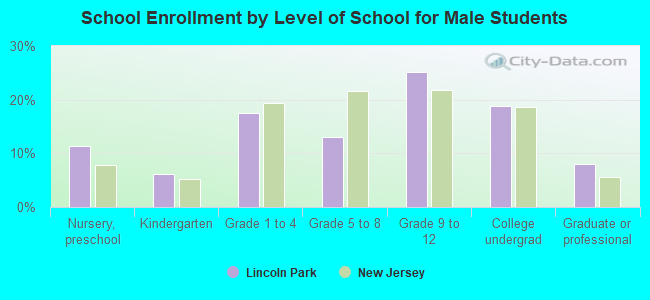
Private vs. public school enrollment:
| Here: | 5.7% |
| New Jersey: | 12.3% |
| Here: | 41.6% |
| New Jersey: | 13.1% |
| Here: | 17.7% |
| New Jersey: | 33.2% |