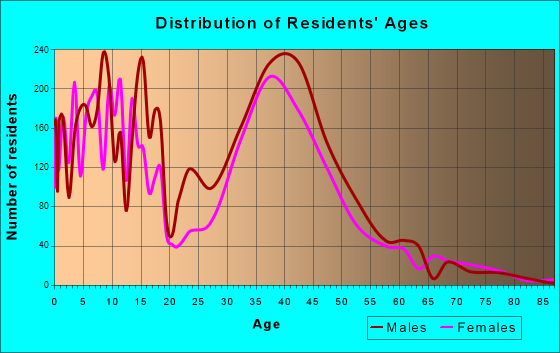
Lino Lakes, MN (Minnesota) Houses and Residents
| Lino Lakes: | $397,368 |
| Minnesota: | $314,600 |
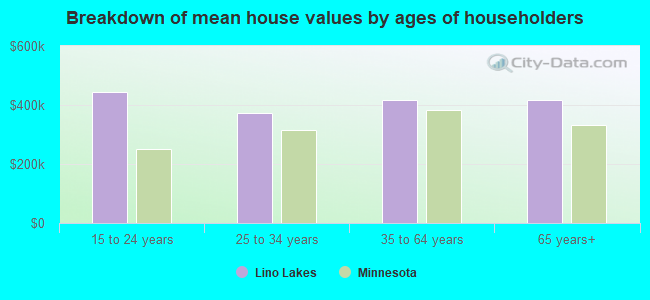
Mean price in 2022:
Detached houses: $431,236
Here: $431,236 State: $374,552 Townhouses or other attached units: $292,220
Here: $292,220 State: $312,049 In 5-or-more-unit structures: $194,271
Here: $194,271 State: $258,516 Mobile homes: $123,236
Here: $123,236 State: $94,605
Total population: 20,948 (Urban population: 15,156, Rural population: 1,614 (24 farm, 1,590 nonfarm))
Houses: 7,706 (7,669 occupied: 7,096 owner occupied, 574 renter occupied)
| % of renters here: | 7% |
| State: | 28% |
Housing density: 273 houses/condos per square mile
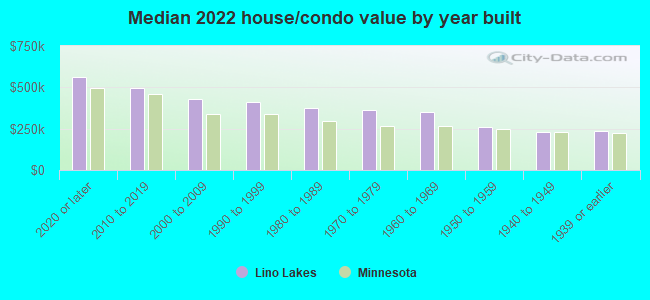
Median price asked for vacant for-sale houses and condos in 2022 in this county: $523,168.
Median contract rent in 2022: $1,446
Median gross rent in Lino Lakes, MN in 2022: $1,751
Housing units in Lino Lakes with a mortgage: 4,657 (385 second mortgage, 0 home equity loan, 306 both second mortgage and home equity loan)
Houses without a mortgage: 114
Median household income for houses/condos with a mortgage: $136,532
Median household income for apartments without a mortgage: $97,929
Median monthly housing costs: $1,628
Compare current foreclosures near Lino Lakes, MN:
| Photo | Address | Area | Beds / Baths | Price | Details |
|---|---|---|---|---|---|

|
#1
Portland Ave # 1412
Minneapolis, MN 55415
|
1,333 sq. feet
|
2 baths 2 beds |
$424,900
|
show details |

|
#2
Saint Croix Ave W
Stillwater, MN 55082
|
2,314 sq. feet
|
2 baths 3 beds |
$344,000
|
show details |

|
#3
Quebec Ave N
Minneapolis, MN 55428
|
1,226 sq. feet
|
1 baths 2 beds |
$334,500
|
show details |

|
#4
Lakeview Point Dr NE
Wyoming, MN 55092
|
2,269 sq. feet
|
2 baths 4 beds |
$379,900
|
show details |

|
#5
Granite St
Saint Paul, MN 55117
|
2,136 sq. feet
|
2 baths 4 beds |
$172,000
|
show details |

|
#6
Groveland Ave Apt 1708
Minneapolis, MN 55403
|
739 sq. feet
|
1 baths 1 beds |
$98,000
|
show details |

|
#7
Wacouta St Unit Unit Gl-D
Saint Paul, MN 55101
|
- sq. feet
|
1 baths 1 beds |
$179,900
|
show details |

|
#8
Timber Way
Stillwater, MN 55082
|
1,635 sq. feet
|
2 baths 3 beds |
show details | |

|
#9
Rice Creek Ter
Saint Paul, MN 55112
|
2,248 sq. feet
|
2 baths 4 beds |
show details | |

|
#10
Jewel Ave N
Forest Lake, MN 55025
|
1,130 sq. feet
|
2 baths 4 beds |
show details |
| Photo | Address | Area | Beds / Baths | Price | Details |
|---|---|---|---|---|---|

|
#11
Oliver Ave N
Minneapolis, MN 55411
|
1,012 sq. feet
|
1 baths 2 beds |
show details | |

|
#12
Gershwin Ct N
Saint Paul, MN 55128
|
2,458 sq. feet
|
2 baths 4 beds |
show details | |

|
#13
Edgewood Dr
Saint Paul, MN 55112
|
1,508 sq. feet
|
2 baths 3 beds |
show details | |

|
#14
7th St N
Saint Paul, MN 55128
|
874 sq. feet
|
1 baths 3 beds |
show details | |

|
#15
Irving Ave N
Minneapolis, MN 55411
|
1,456 sq. feet
|
1 baths 3 beds |
show details | |

|
#16
209th Ct NE
Cedar, MN 55011
|
1,288 sq. feet
|
3 baths 3 beds |
show details | |

|
#17
6th St E
Saint Paul, MN 55106
|
1,292 sq. feet
|
1 baths 4 beds |
show details | |

|
#18
Centennial Dr
Saint Paul, MN 55113
|
1,148 sq. feet
|
2 baths 2 beds |
show details | |

|
#19
Knox Ave N
Minneapolis, MN 55411
|
1,118 sq. feet
|
1 baths 3 beds |
show details | |

|
#20
Colorado Ave N
Minneapolis, MN 55422
|
1,889 sq. feet
|
1 baths 3 beds |
show details |
| Photo | Address | Area | Beds / Baths | Price | Details |
|---|---|---|---|---|---|

|
#21
5th St NE
Minneapolis, MN 55432
|
1,820 sq. feet
|
2 baths 3 beds |
show details | |

|
#22
Goodwin Ave N
Saint Paul, MN 55128
|
938 sq. feet
|
2 baths 2 beds |
show details | |

|
#23
72nd Ln N Apt 202
Minneapolis, MN 55428
|
892 sq. feet
|
1 baths 2 beds |
show details | |

|
#24
Oakmede Ln
Saint Paul, MN 55110
|
1,100 sq. feet
|
3 baths 3 beds |
show details | |

|
#25
102nd Ave NE
Minneapolis, MN 55434
|
1,101 sq. feet
|
2 baths 3 beds |
show details | |

|
#26
Flora St NW
Cedar, MN 55011
|
1,300 sq. feet
|
1 baths 3 beds |
show details | |

|
#27
Belmont Ln W
Saint Paul, MN 55113
|
978 sq. feet
|
2 baths 4 beds |
show details | |

|
#28
Idaho Ave N
Minneapolis, MN 55428
|
1,092 sq. feet
|
2 baths 3 beds |
show details | |

|
#29
Galtier St
Saint Paul, MN 55117
|
816 sq. feet
|
1 baths 2 beds |
show details | |

|
#30
Cope Ave E
Saint Paul, MN 55109
|
2,120 sq. feet
|
3 baths 4 beds |
show details |
| Photo | Address | Area | Beds / Baths | Price | Details |
|---|---|---|---|---|---|

|
#31
Morgan Ave N
Minneapolis, MN 55430
|
1,800 sq. feet
|
2 baths 5 beds |
show details | |

|
#32
160th Ave NW
Andover, MN 55304
|
1,636 sq. feet
|
3 baths 3 beds |
show details | |

|
#33
64th Ave N
Minneapolis, MN 55429
|
1,131 sq. feet
|
1 baths 3 beds |
show details | |

|
#34
64th Ave N
Minneapolis, MN 55429
|
1,130 sq. feet
|
2 baths 3 beds |
show details | |

|
#35
Portland Ave Apt 302
Minneapolis, MN 55404
|
780 sq. feet
|
1 baths 2 beds |
show details | |

|
#36
Dupont Ave N
Minneapolis, MN 55430
|
720 sq. feet
|
1 baths 2 beds |
show details | |

|
#37
Goodrich Ave
Saint Paul, MN 55102
|
1,350 sq. feet
|
1 baths 2 beds |
show details | |

|
#38
Girard Ave N
Minneapolis, MN 55411
|
768 sq. feet
|
1 baths 2 beds |
show details | |

|
#39
Summit Ave
Saint Paul, MN 55105
|
4,019 sq. feet
|
4 baths 7 beds |
show details | |

|
#40
Morgan Ave N
Minneapolis, MN 55444
|
1,009 sq. feet
|
2 baths 4 beds |
show details |
| Photo | Address | Area | Beds / Baths | Price | Details |
|---|---|---|---|---|---|

|
#41
Quebec Ave N
Champlin, MN 55316
|
1,854 sq. feet
|
1 baths 2 beds |
show details | |

|
#42
Girard Ave N
Minneapolis, MN 55430
|
1,058 sq. feet
|
1 baths 2 beds |
show details | |

|
#43
84th Ct N
Minneapolis, MN 55445
|
850 sq. feet
|
1 baths 2 beds |
show details | |

|
#44
Bridlewood Dr
Saint Paul, MN 55119
|
1,385 sq. feet
|
1 baths 3 beds |
show details | |

|
#45
106th Ave N
Osseo, MN 55369
|
1,012 sq. feet
|
2 baths 3 beds |
show details | |

|
#46
Crosstown Blvd NW
Andover, MN 55304
|
1,348 sq. feet
|
1 baths 3 beds |
show details | |

|
#47
Knox Ave N
Minneapolis, MN 55411
|
2,800 sq. feet
|
2 baths 5 beds |
show details | |

|
#48
Hilltop Ct
Saint Paul, MN 55109
|
844 sq. feet
|
1 baths 2 beds |
show details | |

|
#49
Flanders Rd
Saint Paul, MN 55109
|
1,640 sq. feet
|
2 baths 4 beds |
show details | |

|
Check over 1 million property listings on Foreclosure.com!
|
browse all offers | |||


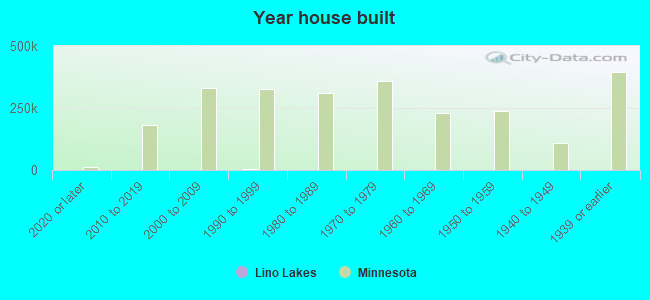
Median year apartment built: 1980
Household type by relationship:
Households: 21,813- Male householders: 3,682 (574 living alone), Female householders: 3,885 (754 living alone)
5,356 spouses (5,347 opposite-sex spouses), 192 unmarried partners, (179 opposite-sex unmarried partners), 6,766 children (6,394 natural, 162 adopted, 209 stepchildren), 318 grandchildren, 93 brothers or sisters, 121 parents, 0 foster children, 175 other relatives, 162 non-relatives
- In group quarters: 1,059
Size of family households: 2,910 2-persons, 1,144 3-persons, 1,161 4-persons, 778 5-persons, 131 6-persons, 31 7-or-more-persons.
Size of nonfamily households: 1,313 1-person, 182 2-persons, 10 3-persons.
3,283 married couples with children.
891 single-parent households (72 men, 819 women).
91.2% of residents of Lino Lakes speak English at home.
1.5% of residents speak Spanish at home (66% speak English very well, 16% speak English well, 8% speak English not well, 10% don't speak English at all).
1.3% of residents speak other Indo-European language at home (75% speak English very well, 3% speak English well, 22% speak English not well).
2.5% of residents speak Asian or Pacific Island language at home (78% speak English very well, 21% speak English well, 1% speak English not well).
1.9% of residents speak other language at home (94% speak English very well, 6% speak English well).
Foreign born population: 1,033 (4.7%)
(83.5% of them are naturalized citizens)
| Here: | 7.7 |
| State: | 7.1 |
| Here: | 4.6 |
| State: | 3.8 |
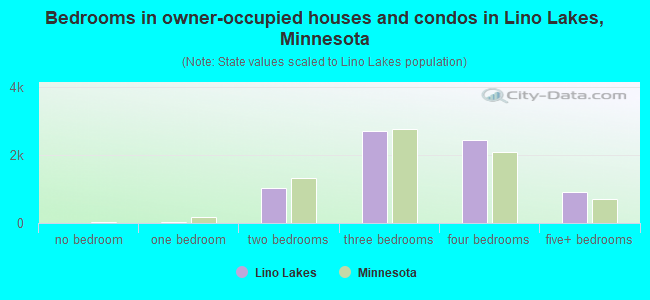
- Bedrooms in owner-occupied houses and condos in Lino Lakes, Minnesota
- 0no bedroom
- 201 bedroom
- 1,0242 bedrooms
- 2,7133 bedrooms
- 2,4284 bedrooms
- 9125+ bedrooms
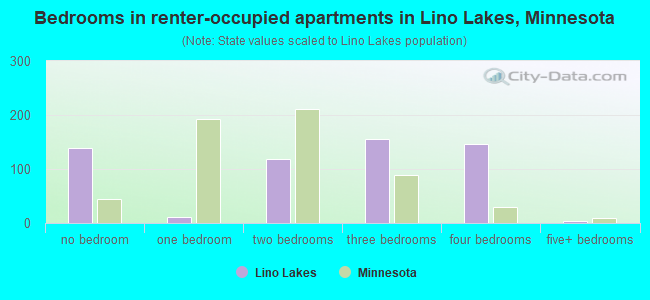
- Bedrooms in renter-occupied apartments in Lino Lakes, Minnesota
- 138no bedroom
- 111 bedroom
- 1192 bedrooms
- 1563 bedrooms
- 1464 bedrooms
- 45+ bedrooms
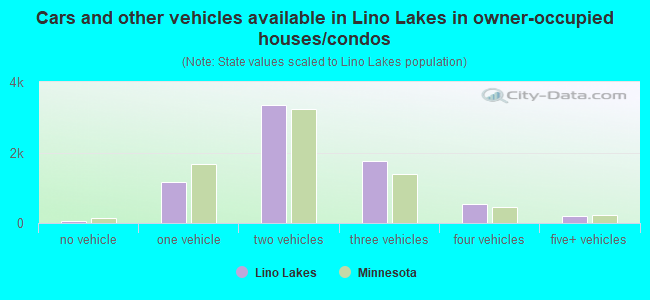
- Cars and other vehicles available in Lino Lakes in owner-occupied houses/condos
- 69no vehicle
- 1,1651 vehicle
- 3,3382 vehicles
- 1,7693 vehicles
- 5454 vehicles
- 2115+ vehicles
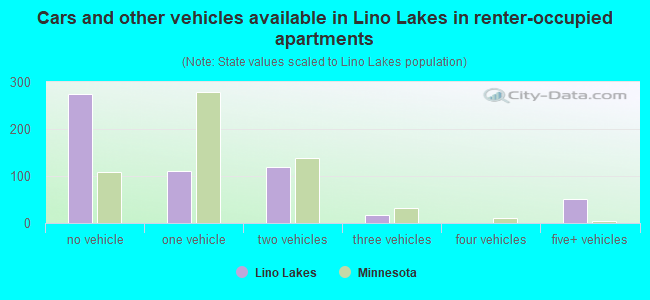
- Cars and other vehicles available in Lino Lakes in renter-occupied apartments
- 275no vehicle
- 1101 vehicle
- 1202 vehicles
- 173 vehicles
- 04 vehicles
- 515+ vehicles
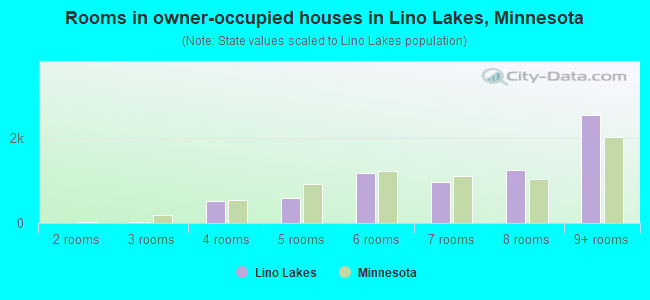
- Rooms in owner-occupied houses in Lino Lakes, Minnesota
- 01 room
- 02 rooms
- 253 rooms
- 5234 rooms
- 5855 rooms
- 1,1726 rooms
- 9797 rooms
- 1,2628 rooms
- 2,5509+ rooms
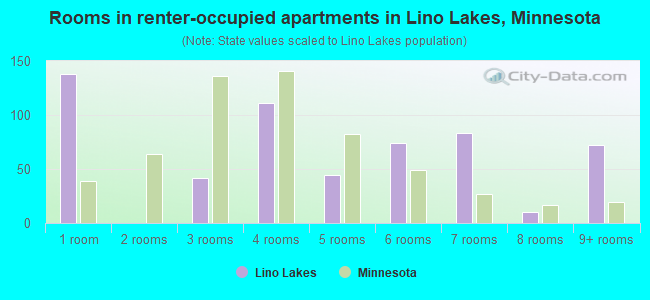
- Rooms in renter-occupied apartments in Lino Lakes, Minnesota
- 1381 room
- 02 rooms
- 423 rooms
- 1114 rooms
- 445 rooms
- 746 rooms
- 837 rooms
- 108 rooms
- 729+ rooms
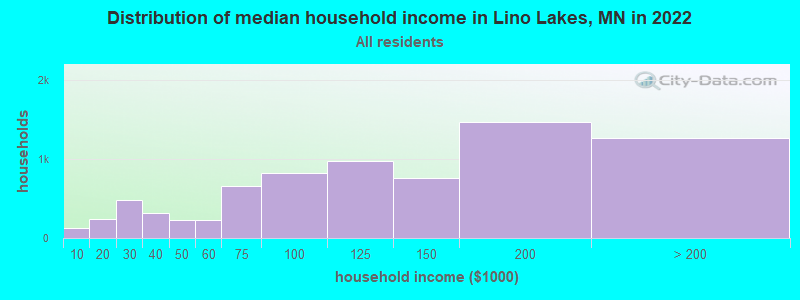
Lino Lakes, MN household income distribution

- 124Less than $10,000
- 242$10,000 to $19,999
- 475$20,000 to $29,999
- 316$30,000 to $39,999
- 231$40,000 to $49,999
- 227$50,000 to $59,999
- 656$60,000 to $74,999
- 827$75,000 to $99,999
- 972$100,000 to $124,999
- 765$125,000 to $149,999
- 1,469$150,000 to $199,999
- 1,271$200,000 or more
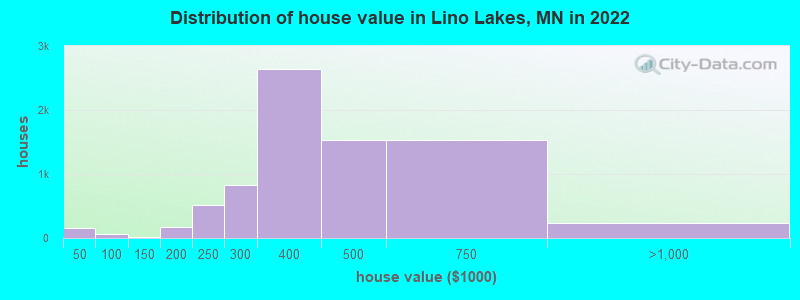
Home value of owner - occupied houses in 2022 in Lino Lakes, MN
-
- 17Less than $10,000
- 3$10,000 to $14,999
- 16$15,000 to $19,999
- 19$20,000 to $24,999
- 6$25,000 to $29,999
- 25$30,000 to $34,999
- 20$35,000 to $39,999
- 53$40,000 to $49,999
- 2$50,000 to $59,999
- 10$70,000 to $79,999
- 22$125,000 to $149,999
- 84$150,000 to $174,999
- 93$175,000 to $199,999
- 516$200,000 to $249,999
- 835$250,000 to $299,999
- 2,633$300,000 to $399,999
- 1,527$400,000 to $499,999
- 1,538$500,000 to $749,999
- 208$750,000 to $999,999
- 7$1,000,000 to $1,499,999
- 25$2,000,000 or more
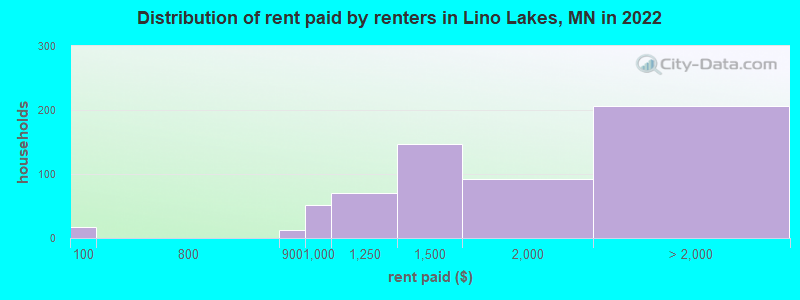
Rent paid by renters in 2022 in Lino Lakes, MN
-
- 17Less than $100
- 13$800 to $899
- 52$900 to $999
- 69$1,000 to $1,249
- 147$1,250 to $1,499
- 91$1,500 to $1,999
- 7$2,000 to $2,499
- 125$3,500 or more
- 72No cash rent
Percentage of workers working in this county: 43.7%
Number of people working at home: 2,549 (23.0% of all workers)
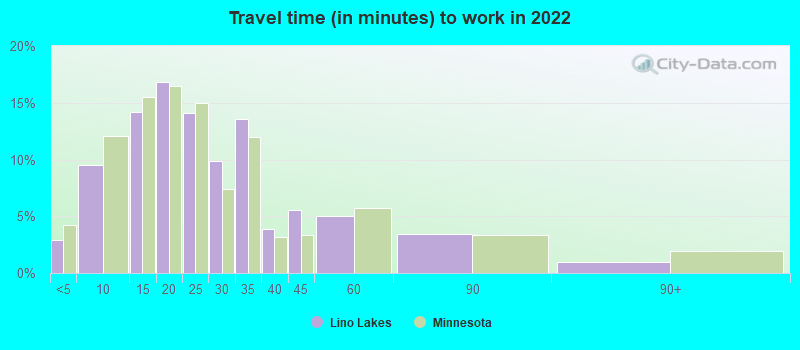
Travel time to work (commute)
- Less than 5 minutes: 109
- 5 to 9 minutes: 549
- 10 to 14 minutes: 919
- 15 to 19 minutes: 871
- 20 to 24 minutes: 1,719
- 25 to 29 minutes: 839
- 30 to 34 minutes: 1,914
- 35 to 39 minutes: 546
- 40 to 44 minutes: 428
- 45 to 59 minutes: 522
- 60 to 89 minutes: 202
- 90 or more minutes: 89
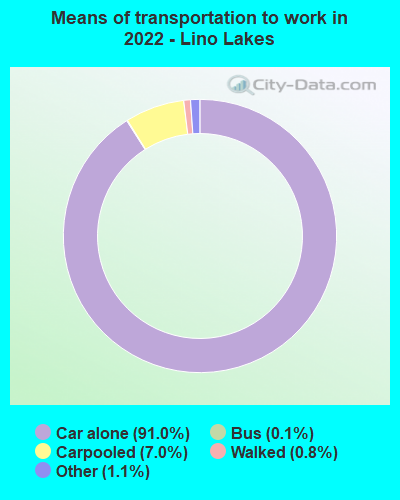
Means of transportation to work:
- Drove a car alone: 4,366 (61.7%)
- Carpooled: 366 (5.2%)
- Bus: 5 (0.1%)
- Taxi: 21 (0.3%)
- Walked: 27 (0.4%)
- Worked at home: 2,549 (36.0%)
- Unemployment by race in 2022
- Unemployment rate for White non-Hispanic residents
- 3.4%Males
- 1.1%Females
- Unemployment rate for Black residents
- 31.5%Females
- Unemployment rate for Asian residents
- 7.3%Males
- 1.5%Females
- Unemployment rate for other race residents
- 14.7%Males
- Unemployment rate for Hispanic or Latino residents
- 4.3%Males
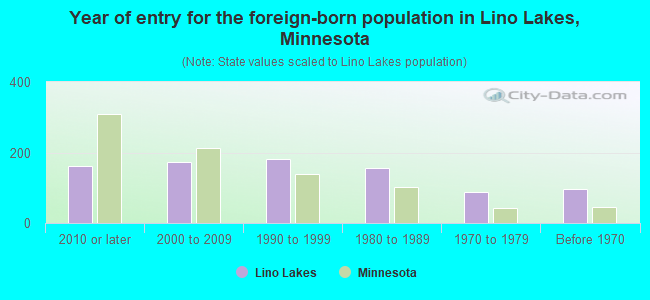
- Year of entry for the foreign-born population in Lino Lakes, Minnesota
- 1632010 or later
- 1722000 to 2009
- 1821990 to 1999
- 1571980 to 1989
- 871970 to 1979
- 96Before 1970
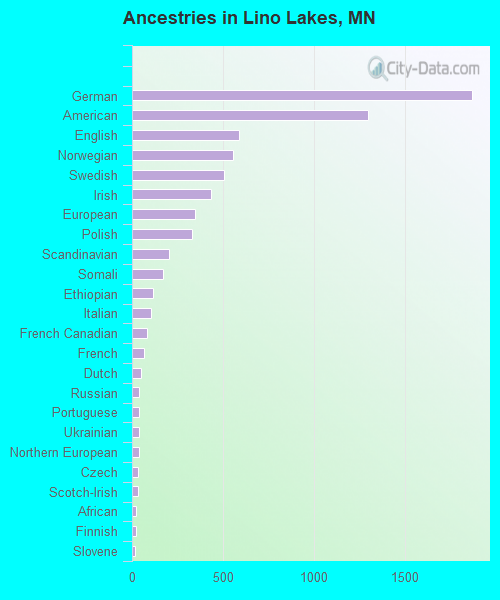
First ancestries reported:
- German: 1,871 (20.7%)
- American: 1,299 (14.4%)
- English: 587 (6.5%)
- Norwegian: 554 (6.1%)
- Swedish: 507 (5.6%)
- Irish: 433 (4.8%)
- European: 344 (3.8%)
- Polish: 329 (3.6%)
- Scandinavian: 202 (2.2%)
- Somali: 168 (1.9%)
- Ethiopian: 118 (1.3%)
- Italian: 105 (1.2%)
- French Canadian: 80 (0.9%)
- French: 66 (0.7%)
- Dutch: 49 (0.5%)
- Russian: 40 (0.4%)
- Portuguese: 40 (0.4%)
- Ukrainian: 38 (0.4%)
- Northern European: 37 (0.4%)
- Czech: 33 (0.4%)
- Scotch-Irish: 31 (0.3%)
- African: 24 (0.3%)
- Finnish: 23 (0.3%)
- Slovene: 18 (0.2%)
- Scottish: 16 (0.2%)
- Danish: 14 (0.2%)
- Hungarian: 11 (0.1%)
- Luxembourger: 10 (0.1%)
- Slovak: 9 (0.10%)
- Canadian: 9 (0.10%)
- Czechoslovakian: 8 (0.09%)
- Icelander: 6 (0.07%)
- Slavic: 6 (0.07%)
Most common places of birth for foreign-born residents (%):
| Lino Lakes: | 13.0% (121) |
| Minnesota: | 5.1% (24,591) |
| Lino Lakes: | 12.3% (114) |
| Minnesota: | 2.4% (11,675) |
| Lino Lakes: | 7.8% (72) |
| Minnesota: | 2.5% (11,939) |
| Lino Lakes: | 6.0% (56) |
| Minnesota: | 5.1% (24,630) |
| Lino Lakes: | 6.0% (56) |
| Minnesota: | 12.1% (58,312) |
| Lino Lakes: | 5.7% (53) |
| Minnesota: | 1.4% (6,670) |
| Lino Lakes: | 5.4% (50) |
| Minnesota: | 1.0% (4,646) |
| Lino Lakes: | 4.2% (39) |
| Minnesota: | 8.0% (38,461) |
| Lino Lakes: | 3.7% (34) |
| Minnesota: | 0.6% (3,038) |
| Lino Lakes: | 3.7% (34) |
| Minnesota: | 0.0% (143) |
| Lino Lakes: | 3.4% (32) |
| Minnesota: | 4.0% (19,333) |
| Lino Lakes: | 3.2% (30) |
| Minnesota: | 0.8% (3,651) |
| Lino Lakes: | 2.8% (26) |
| Minnesota: | 1.3% (6,329) |
| Lino Lakes: | 2.8% (26) |
| Minnesota: | 3.6% (17,119) |
| Lino Lakes: | 2.6% (24) |
| Minnesota: | 3.8% (18,442) |
| Lino Lakes: | 2.5% (23) |
| Minnesota: | 0.4% (2,003) |
| Lino Lakes: | 2.4% (22) |
| Minnesota: | 0.5% (2,552) |
| Lino Lakes: | 1.9% (18) |
| Minnesota: | 0.2% (1,174) |
| Lino Lakes: | 1.6% (15) |
| Minnesota: | 0.3% (1,664) |
Place of birth for U.S.-born residents:
- This state: 16,340
- Other state: 4,149
- Northeast: 463
- Midwest: 2,402
- South: 574
- West: 670
91.9% of Lino Lakes residents lived in the same house 1 years ago.
Out of people who lived in different houses, 16.4% lived in this county.
Out of people who lived in different counties, 86.8% lived in Minnesota.
| Lino Lakes: | 91.9% |
| State average: | 87.4% |
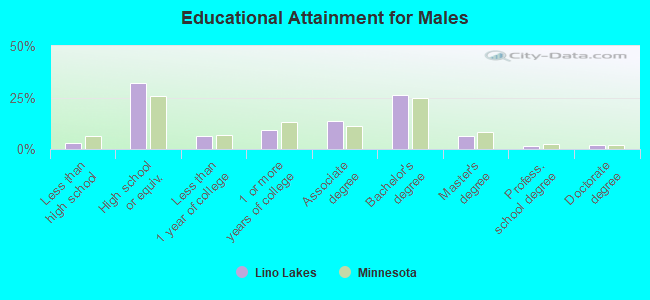
Education attainment for males 25 years and older:
- No schooling: 51
- Nursery to 4th grade: 25
- 5th and 6th grade: 3
- 7th and 8th grade: 3
- 9th grade: 18
- 10th grade: 15
- 11th grade: 65
- 12th grade, no diploma: 50
- High school graduate (or equivalency): 2,624
- Less than 1 year of college: 528
- Some college more than 1 year, no degree: 744
- Associate degree: 1,129
- Bachelor's degree: 2,145
- Master's degree: 504
- Professional school degree: 107
- Doctorate degree: 162
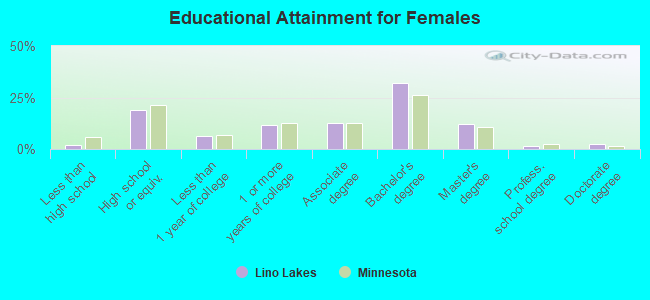
Education attainment for females 25 years and older:
- No schooling: 42
- Nursery to 4th grade: 45
- 5th and 6th grade: 0
- 7th and 8th grade: 27
- 9th grade: 8
- 10th grade: 14
- 11th grade: 0
- 12th grade, no diploma: 11
- High school graduate (or equivalency): 1,403
- Less than 1 year of college: 469
- Some college more than 1 year, no degree: 852
- Associate degree: 941
- Bachelor's degree: 2,357
- Master's degree: 907
- Professional school degree: 117
- Doctorate degree: 176
Housing units in structures:
- One, detached: 6,335
- One, attached: 1,001
- 5 to 9: 16
- 10 to 19: 9
- 20 to 49: 39
- 50 or more: 204
- Mobile homes: 100
Median worth of mobile homes: $33,113
Housing units lacking complete kitchen facilities in 2022: 2.6%
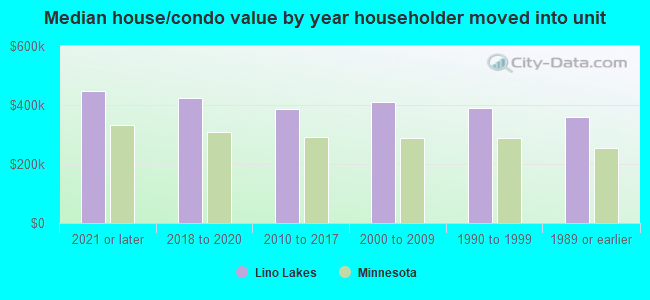
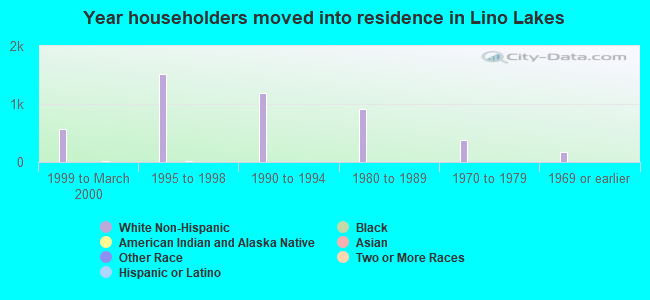
House/condo owner moved in on average 14 years ago
Renter moved in on average 5 years ago
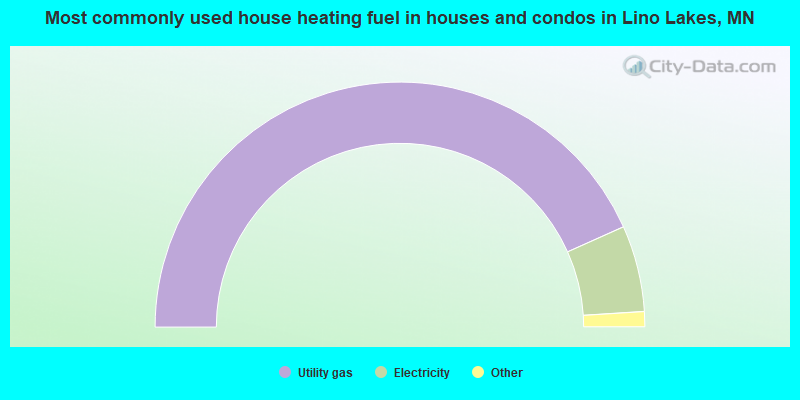
- 86.5%Utility gas
- 11.4%Electricity
- 1.4%Bottled, tank, or LP gas
- 0.4%Wood
- 0.1%No fuel used
- 0.1%Other fuel
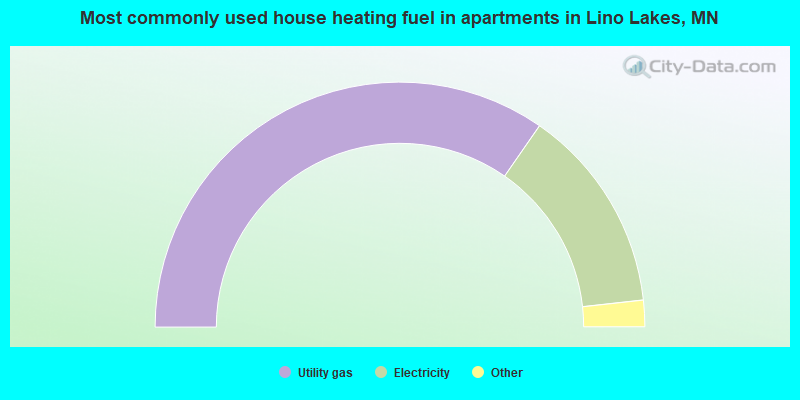
- 69.4%Utility gas
- 27.2%Electricity
- 1.8%Solar energy
- 1.6%Bottled, tank, or LP gas
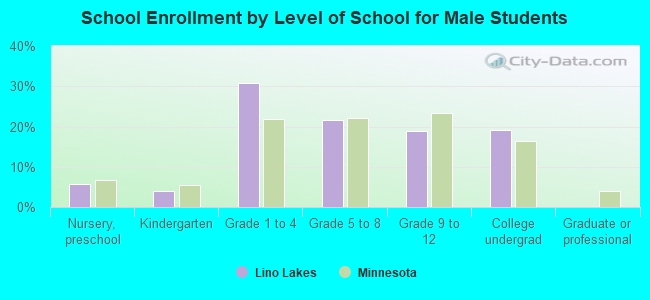
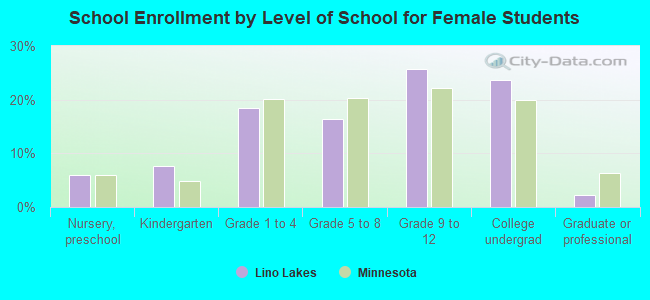
Private vs. public school enrollment:
| Here: | 11.2% |
| Minnesota: | 12.9% |
| Here: | 4.2% |
| Minnesota: | 8.6% |
| Here: | 19.9% |
| Minnesota: | 26.2% |