Litchfield, NH (New Hampshire) Houses and Residents
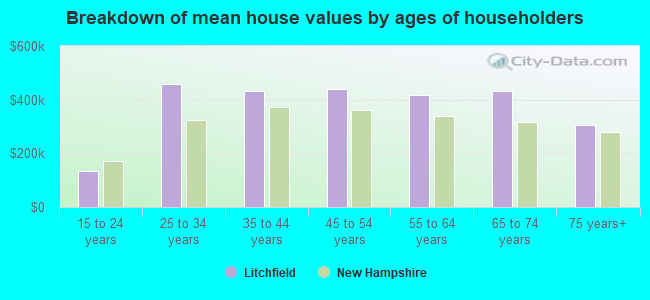
| Litchfield: | $459,528 |
| New Hampshire: | $384,700 |
Total population: 8,271 (Urban population: 4,392, Rural population: 2,968 (17 farm, 2,951 nonfarm))
Houses: 2,389 (2,357 occupied: 2,063 owner occupied, 294 renter occupied)
| % of renters here: | 12% |
| State: | 28% |
Housing density: 158 houses/condos per square mile
Median price asked for vacant for-sale houses and condos in 2022 in this county: $219,786.
Median contract rent in 2022: $1,305 (lower quartile is $1,103, upper quartile is $1,677)
Median rent asked for vacant for-rent units in 2022: $1,550
Median gross rent in Litchfield, NH in 2022: $1,671
Housing units in Litchfield with a mortgage: 1,713 (121 second mortgage, 273 home equity loan, 0 both second mortgage and home equity loan)
Houses without a mortgage: 174
Compare current foreclosures near Litchfield, NH:
| Photo | Address | Area | Beds / Baths | Price | Details |
|---|---|---|---|---|---|

|
#1
Roberts Rd
Litchfield, NH 03052
|
1,426 sq. feet
|
1 baths 3 beds |
show details | |

|
#2
Roberts Rd
Litchfield, NH 03052
|
2,507 sq. feet
|
1 baths 4 beds |
show details | |

|
#3
Charles Bancroft Hwy
Litchfield, NH 03052
|
- sq. feet
|
- baths - beds |
show details | |

|
#4
Shore Dr
Hampstead, NH 03841
|
787 sq. feet
|
1 baths 2 beds |
$529,900
|
show details |

|
#5
Oak Dr
Litchfield, NH 03052
|
- sq. feet
|
- baths - beds |
show details | |

|
#6
Lydston Ln
Litchfield, NH 03052
|
- sq. feet
|
- baths - beds |
show details | |

|
#7
Colonial Dr
Litchfield, NH 03052
|
- sq. feet
|
- baths - beds |
show details | |

|
#8
Louise Dr
Litchfield, NH 03052
|
- sq. feet
|
- baths - beds |
show details | |

|
#9
Nashua St
Milford, NH 03055
|
2,172 sq. feet
|
2 baths 4 beds |
show details | |

|
#10
High St
Derry, NH 03038
|
2,149 sq. feet
|
3 baths 4 beds |
show details |
| Photo | Address | Area | Beds / Baths | Price | Details |
|---|---|---|---|---|---|

|
#11
Fieldstone Dr
Amherst, NH 03031
|
2,280 sq. feet
|
3 baths 3 beds |
show details | |

|
#12
Brook St
Derry, NH 03038
|
1,476 sq. feet
|
2 baths 4 beds |
show details | |

|
#13
Aiken Ave Apt 15
Lowell, MA 01850
|
1,100 sq. feet
|
1 baths 2 beds |
show details | |

|
#14
Hemlock Cir
Sandown, NH 03873
|
1,912 sq. feet
|
2 baths 4 beds |
show details | |

|
#15
Landsdown Dr
Nashua, NH 03062
|
1,860 sq. feet
|
2 baths 3 beds |
show details | |

|
#16
Church St
Goffstown, NH 03045
|
2,115 sq. feet
|
2 baths 4 beds |
show details | |

|
#17
3rd Ave
North Chelmsford, MA 01863
|
- sq. feet
|
1 baths 2 beds |
show details | |

|
#18
Grace Dr
Nashua, NH 03062
|
1,484 sq. feet
|
1 baths 3 beds |
show details | |

|
#19
Amherst St
Amherst, NH 03031
|
- sq. feet
|
4 baths 3 beds |
show details | |

|
#20
S Mammoth Rd
Manchester, NH 03109
|
1,555 sq. feet
|
2 baths 4 beds |
show details |
| Photo | Address | Area | Beds / Baths | Price | Details |
|---|---|---|---|---|---|

|
#21
Florence St
Dracut, MA 01826
|
1,523 sq. feet
|
2 baths 3 beds |
show details | |

|
#22
Willow Creek Dr # 42
Hudson, NH 03051
|
1,120 sq. feet
|
1 baths 2 beds |
show details | |

|
#23
Granite St
Manchester, NH 03102
|
1,905 sq. feet
|
2 baths 4 beds |
show details | |

|
#24
River Rd
Tyngsboro, MA 01879
|
1,863 sq. feet
|
2 baths 2 beds |
show details | |

|
#25
Page St
Manchester, NH 03104
|
4,105 sq. feet
|
3 baths 5 beds |
show details | |

|
#26
Blucher St
Manchester, NH 03102
|
2,448 sq. feet
|
2 baths 3 beds |
show details | |

|
#27
Schaefer Cir
Hudson, NH 03051
|
4,358 sq. feet
|
3 baths 5 beds |
show details | |

|
#28
Grove St
Nashua, NH 03064
|
1,344 sq. feet
|
1 baths 3 beds |
show details | |

|
#29
Pine Ridge Rd
Windham, NH 03087
|
1,746 sq. feet
|
2 baths 4 beds |
show details | |

|
#30
Hobson St
Methuen, MA 01844
|
1,776 sq. feet
|
1 baths 3 beds |
show details |
| Photo | Address | Area | Beds / Baths | Price | Details |
|---|---|---|---|---|---|

|
#31
Elm Rd
Westford, MA 01886
|
1,712 sq. feet
|
2 baths 1 beds |
show details | |

|
#32
Dale St
Methuen, MA 01844
|
1,765 sq. feet
|
1 baths 3 beds |
show details | |

|
#33
Myron St
Dracut, MA 01826
|
1,040 sq. feet
|
2 baths 3 beds |
show details | |

|
#34
Fiddlehead Ln
Chester, NH 03036
|
2,682 sq. feet
|
2 baths 4 beds |
show details | |

|
#35
Florence St
Dracut, MA 01826
|
1,523 sq. feet
|
1 baths 3 beds |
show details | |

|
#36
Washington St
Lowell, MA 01851
|
2,095 sq. feet
|
2 baths 6 beds |
show details | |

|
#37
Coral Ave
Manchester, NH 03104
|
2,464 sq. feet
|
2 baths 3 beds |
show details | |

|
#38
Peyton Way
Haverhill, MA 01832
|
2,724 sq. feet
|
2 baths 4 beds |
show details | |

|
#39
Willowdale Rd
Tyngsboro, MA 01879
|
1,896 sq. feet
|
1 baths 3 beds |
show details | |

|
#40
Olympic Village Dr
Methuen, MA 01844
|
1,811 sq. feet
|
2 baths 5 beds |
show details |
| Photo | Address | Area | Beds / Baths | Price | Details |
|---|---|---|---|---|---|

|
#41
Parkview Ave
Salem, NH 03079
|
1,812 sq. feet
|
1 baths 3 beds |
show details | |

|
#42
Hamilton Ln
Salem, NH 03079
|
2,818 sq. feet
|
2 baths 4 beds |
show details | |

|
#43
Maclarnon Rd
Salem, NH 03079
|
2,020 sq. feet
|
1 baths 3 beds |
show details | |

|
#44
Cannongate Rd Apt 42
Tyngsboro, MA 01879
|
1,436 sq. feet
|
1 baths 2 beds |
show details | |

|
#45
Mammoth Rd
Dracut, MA 01826
|
3,140 sq. feet
|
2 baths 4 beds |
show details | |

|
#46
Glen Ave
Dracut, MA 01826
|
1,500 sq. feet
|
1 baths 3 beds |
show details | |

|
#47
Cluff Crossing Rd
Salem, NH 03079
|
1,120 sq. feet
|
2 baths 2 beds |
show details | |

|
#48
Auburn Rd
Hooksett, NH 03106
|
1,800 sq. feet
|
2 baths 3 beds |
show details | |

|
#49
Cheyenne Rd
Pepperell, MA 01463
|
1,728 sq. feet
|
2 baths 4 beds |
show details | |

|
Check over 1 million property listings on Foreclosure.com!
|
browse all offers | |||
Latest news about housing in Litchfield, NH collected exclusively by city-data.com from local newspapers, TV, and radio stations

 | Rout 3A Litchfield traffice/noise (3 replies) |
| 55+ condos in the Nashua area (1 reply) |
| New Hampshire - Who Puts Voting Ballot in Box ? (25 replies) |
| Thoughts on the Free State Project (82 replies) |
| Londonderry vs Bedford (8 replies) |
| Heating with LP bottle gas 1500-2000sf home (6 replies) |

Household type by relationship:
Households: 392,962- In family households: 326,724 (73,081 male householders, 30,878 female householders)
80,219 spouses, 116,046 children (108,604 natural, 2,355 adopted, 5,087 stepchildren), 5,202 grandchildren, 2,916 brothers or sisters, 3,400 parents, foster children, 2,901 other relatives, 9,588 non-relatives
- In nonfamily households: 66,238 (25,502 male householders (18,551 living alone)), 26,005 female householders (20,836 living alone)), 14,731 nonrelatives
- In group quarters: 7,759 (3,560 institutionalized population)
74,304 married couples with children.
19,641 single-parent households (5,030 men, 14,611 women).
94.1% of residents of Litchfield speak English at home.
1.2% of residents speak Spanish at home (52% speak English very well, 36% speak English well, 12% speak English not well).
4.0% of residents speak other Indo-European language at home (73% speak English very well, 23% speak English well, 4% speak English not well).
0.1% of residents speak Asian or Pacific Island language at home (100% speak English very well).
0.6% of residents speak other language at home (75% speak English very well, 25% speak English well).
Foreign born population: 464 (5.6%)
(51.5% of them are naturalized citizens)
| Here: | 6.6 |
| State: | 6.4 |
| Here: | 4.0 |
| State: | 4.0 |
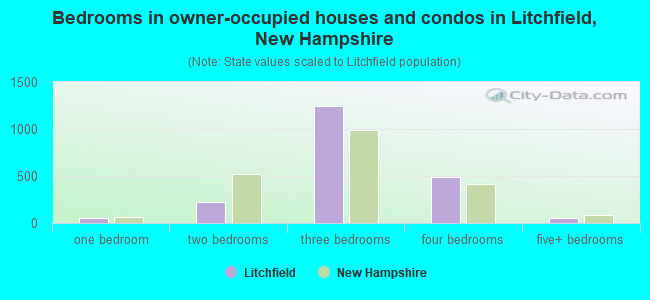
- Bedrooms in owner-occupied houses and condos in Litchfield, New Hampshire
- 0no bedroom
- 521 bedroom
- 2242 bedrooms
- 1,2493 bedrooms
- 4874 bedrooms
- 515+ bedrooms
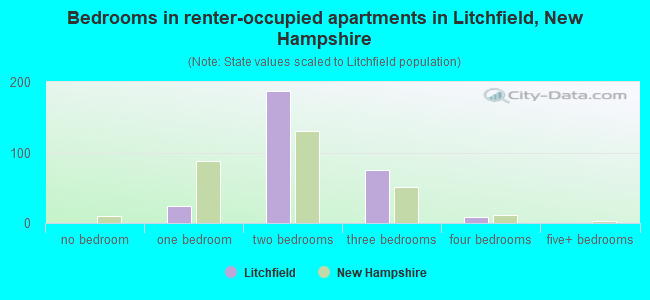
- Bedrooms in renter-occupied apartments in Litchfield, New Hampshire
- 0no bedroom
- 241 bedroom
- 1872 bedrooms
- 753 bedrooms
- 84 bedrooms
- 05+ bedrooms
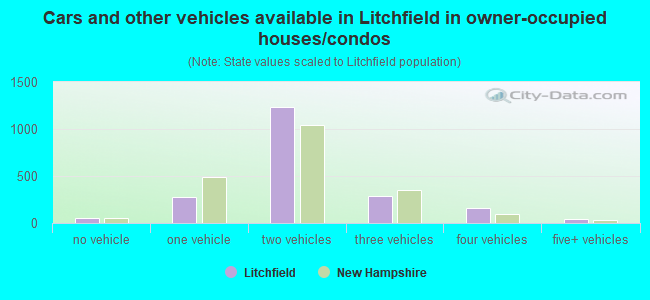
- Cars and other vehicles available in Litchfield in owner-occupied houses/condos
- 55no vehicle
- 2801 vehicle
- 1,2392 vehicles
- 2903 vehicles
- 1574 vehicles
- 425+ vehicles
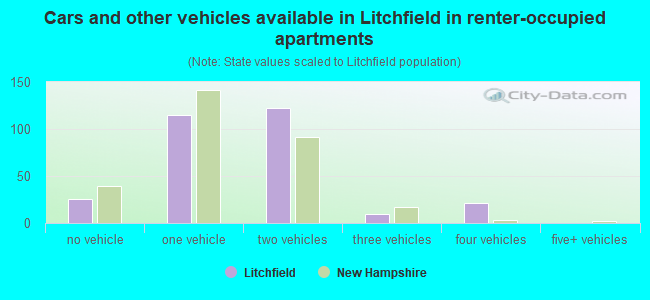
- Cars and other vehicles available in Litchfield in renter-occupied apartments
- 26no vehicle
- 1151 vehicle
- 1222 vehicles
- 103 vehicles
- 214 vehicles
- 05+ vehicles
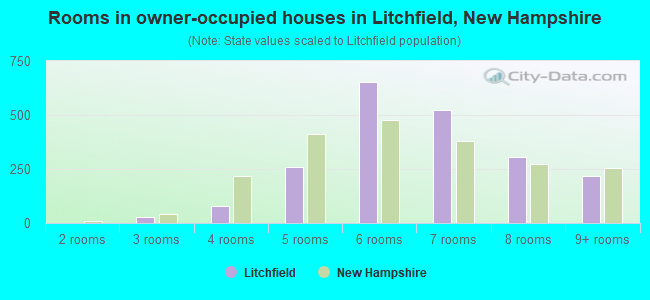
- Rooms in owner-occupied houses in Litchfield, New Hampshire
- 01 room
- 02 rooms
- 263 rooms
- 814 rooms
- 2585 rooms
- 6536 rooms
- 5237 rooms
- 3058 rooms
- 2179+ rooms
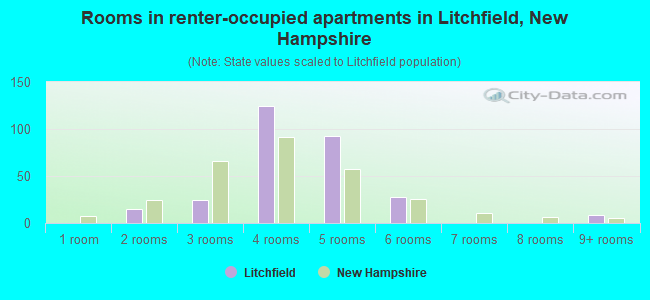
- Rooms in renter-occupied apartments in Litchfield, New Hampshire
- 01 room
- 152 rooms
- 253 rooms
- 1254 rooms
- 935 rooms
- 286 rooms
- 07 rooms
- 08 rooms
- 89+ rooms
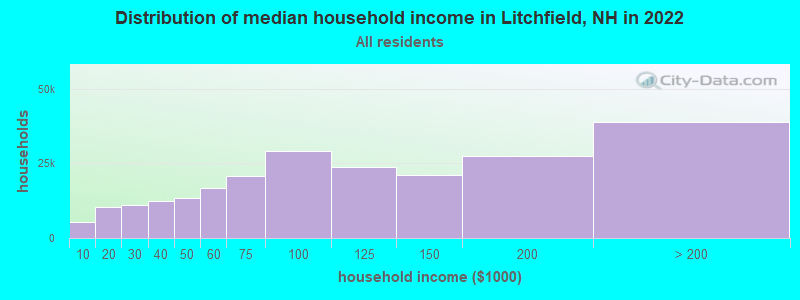
Litchfield, NH household income distribution

- 5,487Less than $10,000
- 10,401$10,000 to $19,999
- 10,940$20,000 to $29,999
- 12,299$30,000 to $39,999
- 13,339$40,000 to $49,999
- 16,756$50,000 to $59,999
- 20,663$60,000 to $74,999
- 29,257$75,000 to $99,999
- 23,760$100,000 to $124,999
- 21,052$125,000 to $149,999
- 27,573$150,000 to $199,999
- 38,903$200,000 or more
Percentage of workers working in this county: 67.7%
Number of people working at home: 895 (18.5% of all workers)
Travel time to work (commute)
- Less than 5 minutes: 32
- 5 to 9 minutes: 183
- 10 to 14 minutes: 271
- 15 to 19 minutes: 483
- 20 to 24 minutes: 776
- 25 to 29 minutes: 342
- 30 to 34 minutes: 721
- 35 to 39 minutes: 130
- 40 to 44 minutes: 144
- 45 to 59 minutes: 327
- 60 to 89 minutes: 408
- 90 or more minutes: 132
Means of transportation to work:
- Drove a car alone: 3,533 (87.7%)
- Carpooled: 393 (9.8%)
- Streetcar or trolley car: 9 (0.2%)
- Taxi: 7 (0.2%)
- Other means: 7 (0.2%)
- Worked at home: 78 (1.9%)
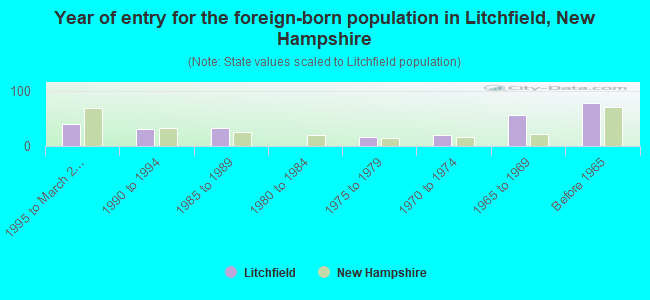
- Year of entry for the foreign-born population in Litchfield, New Hampshire
- 411995 to March 2000
- 311990 to 1994
- 331985 to 1989
- 01980 to 1984
- 161975 to 1979
- 211970 to 1974
- 561965 to 1969
- 78Before 1965
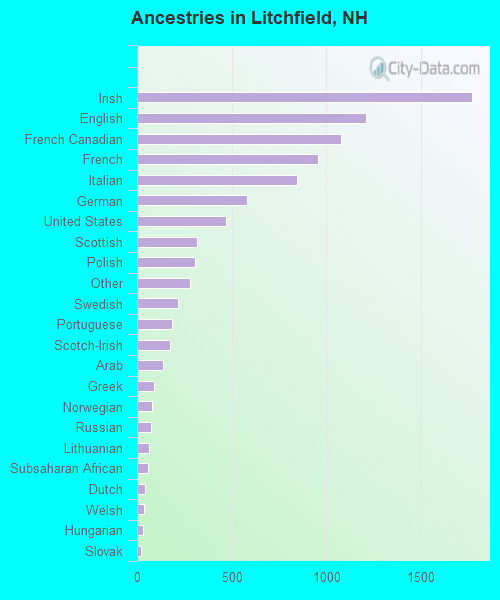
First ancestries reported:
- Irish: 1,772 (19.6%)
- English: 1,209 (13.4%)
- French Canadian: 1,077 (11.9%)
- French: 957 (10.6%)
- Italian: 845 (9.3%)
- German: 582 (6.4%)
- United States: 470 (5.2%)
- Scottish: 317 (3.5%)
- Polish: 305 (3.4%)
- Other: 280 (3.1%)
- Swedish: 217 (2.4%)
- Portuguese: 183 (2.0%)
- Scotch-Irish: 176 (1.9%)
- Arab: 138 (1.5%)
- Greek: 88 (1.0%)
- Norwegian: 77 (0.9%)
- Russian: 72 (0.8%)
- Lithuanian: 63 (0.7%)
- Subsaharan African: 57 (0.6%)
- Dutch: 43 (0.5%)
- Welsh: 36 (0.4%)
- Hungarian: 32 (0.4%)
- Slovak: 20 (0.2%)
- Swiss: 12 (0.1%)
- Czech: 11 (0.1%)
- Danish: 8 (0.09%)
Most common places of birth for foreign-born residents (%):
| Litchfield: | 52.5% (145) |
| New Hampshire: | 22.9% (12,397) |
| Litchfield: | 12.0% (33) |
| New Hampshire: | 0.9% (511) |
| Litchfield: | 11.2% (31) |
| New Hampshire: | 1.5% (835) |
| Litchfield: | 5.8% (16) |
| New Hampshire: | 0.7% (356) |
| Litchfield: | 5.4% (15) |
| New Hampshire: | 0.9% (483) |
| Litchfield: | 3.6% (10) |
| New Hampshire: | 0.1% (64) |
| Litchfield: | 2.9% (8) |
| New Hampshire: | 0.5% (252) |
| Litchfield: | 2.5% (7) |
| New Hampshire: | 4.9% (2,670) |
| Litchfield: | 2.2% (6) |
| New Hampshire: | 1.7% (940) |
| Litchfield: | 1.8% (5) |
| New Hampshire: | 8.1% (4,396) |
Place of birth for U.S.-born residents:
- This state: 3,177
- Other state: 3,871
- Northeast: 3,350
- Midwest: 158
- South: 287
- West: 76
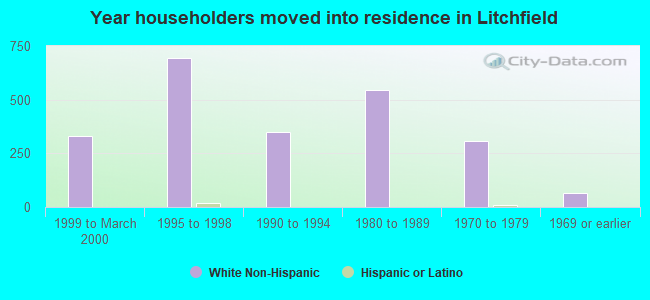
60% of Litchfield residents lived in the same house 5 years ago.
Out of people who lived in different houses, 60% lived in this county.
Out of people who lived in different counties, 20% lived in New Hampshire.
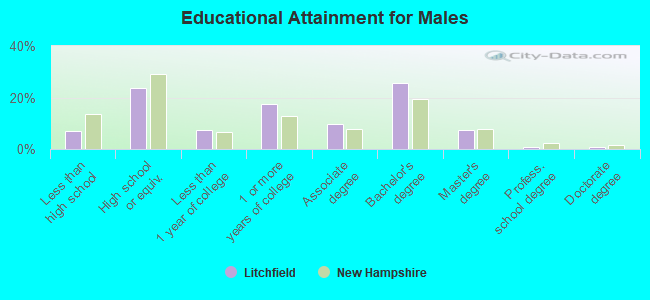
Education attainment for males 25 years and older:
- No schooling: 0
- Nursery to 4th grade: 0
- 5th and 6th grade: 5
- 7th and 8th grade: 60
- 9th grade: 27
- 10th grade: 19
- 11th grade: 7
- 12th grade, no diploma: 41
- High school graduate (or equivalency): 527
- Less than 1 year of college: 166
- Some college more than 1 year, no degree: 385
- Associate degree: 216
- Bachelor's degree: 572
- Master's degree: 163
- Professional school degree: 14
- Doctorate degree: 15
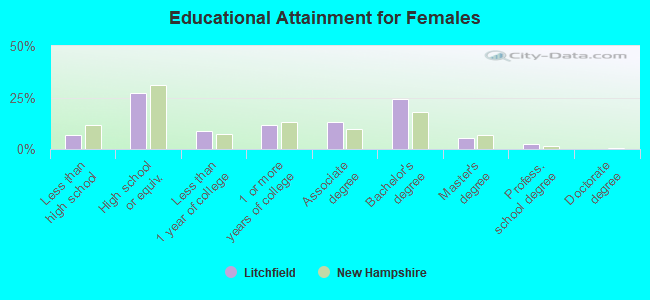
Education attainment for females 25 years and older:
- No schooling: 0
- Nursery to 4th grade: 0
- 5th and 6th grade: 0
- 7th and 8th grade: 31
- 9th grade: 19
- 10th grade: 43
- 11th grade: 30
- 12th grade, no diploma: 33
- High school graduate (or equivalency): 614
- Less than 1 year of college: 195
- Some college more than 1 year, no degree: 264
- Associate degree: 293
- Bachelor's degree: 543
- Master's degree: 123
- Professional school degree: 57
- Doctorate degree: 0


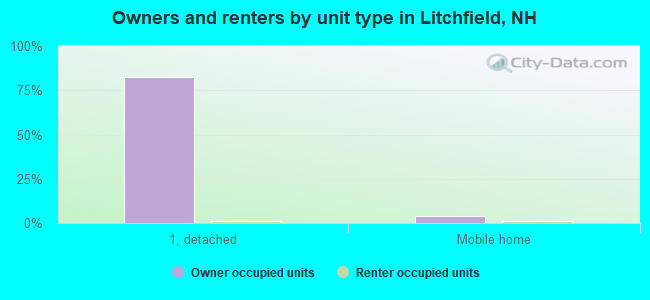
Housing units in structures:
- One, detached: 1,978
- One, attached: 40
- Two: 126
- 3 or 4: 32
- 5 to 9: 68
- 10 to 19: 24
- Mobile homes: 121
Median worth of mobile homes: $126,367
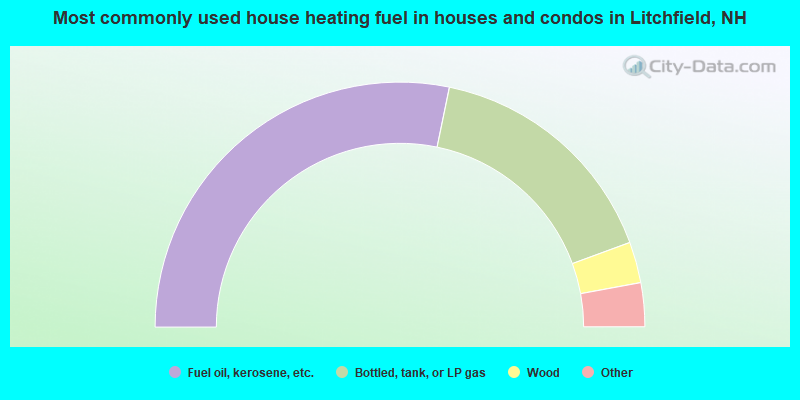
- 56.5%Fuel oil, kerosene, etc.
- 32.3%Bottled, tank, or LP gas
- 5.4%Wood
- 3.0%Electricity
- 2.0%Utility gas
- 0.4%Coal or coke
- 0.3%Other fuel
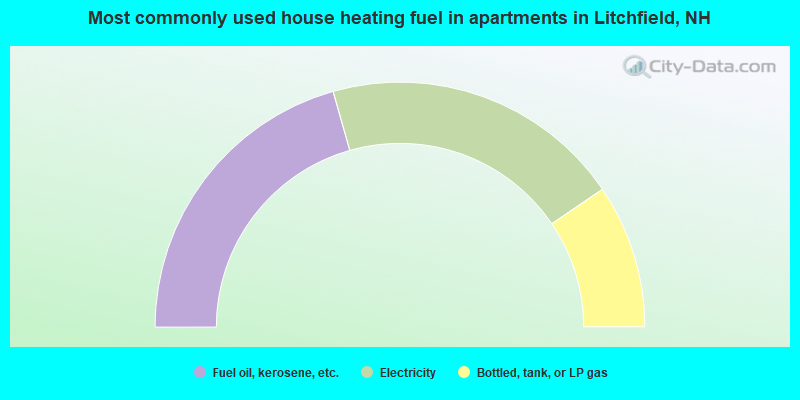
- 41.2%Fuel oil, kerosene, etc.
- 39.8%Electricity
- 19.0%Bottled, tank, or LP gas
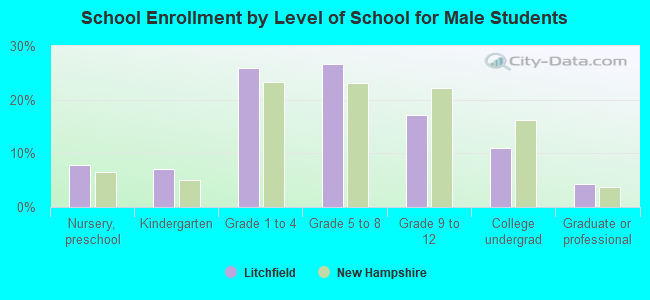
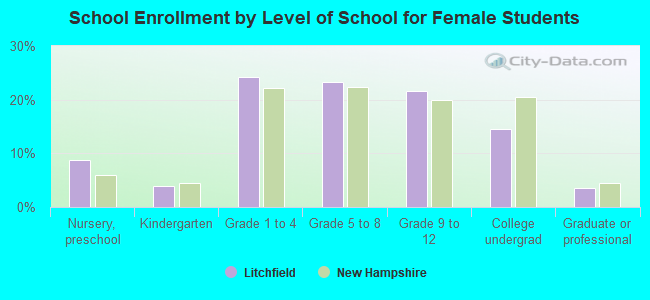
Private vs. public school enrollment:
| Here: | 8.2% |
| New Hampshire: | 8.9% |
| Here: | 15.1% |
| New Hampshire: | 10.7% |
| Here: | 30.2% |
| New Hampshire: | 36.4% |