Little Rock, SC (South Carolina) Houses and Residents
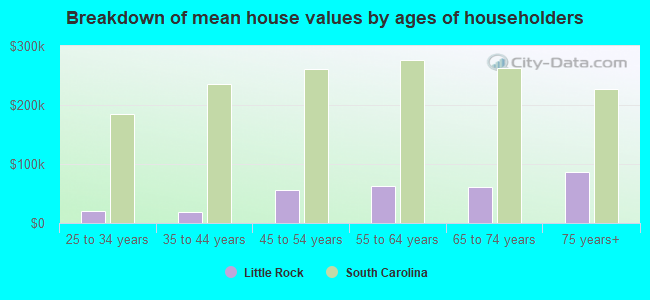
| Little Rock: | $99,073 |
| South Carolina: | $254,600 |
Total population: 3,531 (Urban population: 0, Rural population: 3,525 (84 farm, 3,441 nonfarm))
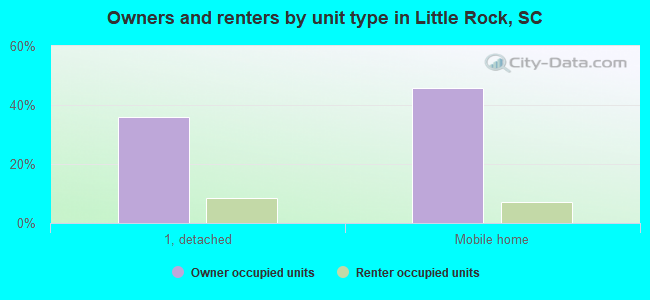
Houses: 1,232 (1,099 occupied: 915 owner occupied, 184 renter occupied)
| % of renters here: | 17% |
| State: | 28% |
Housing density: 18 houses/condos per square mile
Median price asked for vacant for-sale houses and condos in 2022 in this county: $49,932.
Median contract rent in 2022: $485 (lower quartile is $385, upper quartile is $706)
Median rent asked for vacant for-rent units in 2022: $485
Median gross rent in Little Rock, SC in 2022: $826
Housing units in Little Rock with a mortgage: 169 (27 second mortgage, 4 home equity loan, 0 both second mortgage and home equity loan)
Houses without a mortgage: 170
Compare current foreclosures near Little Rock, SC:
| Photo | Address | Area | Beds / Baths | Price | Details |
|---|---|---|---|---|---|

|
#1
Carolina St
Maxton, NC 28364
|
- sq. feet
|
1 baths 3 beds |
$69,900
|
show details |

|
#2
Fairway Dr
Laurinburg, NC 28352
|
3,352 sq. feet
|
3 baths 4 beds |
show details | |

|
#3
N Main St
Fairmont, NC 28340
|
1,763 sq. feet
|
2 baths 3 beds |
show details | |

|
#4
Church St
Fairmont, NC 28340
|
1,280 sq. feet
|
1 baths 2 beds |
show details | |

|
#5
Montclair Dr
Laurinburg, NC 28352
|
2,074 sq. feet
|
2 baths 3 beds |
show details | |

|
#6
Lombard St
Maxton, NC 28364
|
1,248 sq. feet
|
1 baths 3 beds |
show details | |

|
#7
Shaw Rd
Laurinburg, NC 28352
|
1,420 sq. feet
|
2 baths 3 beds |
show details | |

|
#8
Nc Highway 130 W
Maxton, NC 28364
|
480 sq. feet
|
1 baths 2 beds |
show details | |

|
#9
S Chicken Rd
Rowland, NC 28383
|
999 sq. feet
|
1 baths 3 beds |
show details | |

|
#10
Methodist Church Rd
Marion, SC 29571
|
- sq. feet
|
1 baths 2 beds |
show details |
| Photo | Address | Area | Beds / Baths | Price | Details |
|---|---|---|---|---|---|

|
#11
Road
Dillon, SC 29536
|
- sq. feet
|
- baths - beds |
$109,900
|
show details |

|
#12
Boardwalk Dr
Rowland, NC 28383
|
1,904 sq. feet
|
1 baths 3 beds |
show details | |

|
#13
Hilly Branch Rd
Lumberton, NC 28360
|
1,584 sq. feet
|
1 baths 3 beds |
show details | |

|
#14
Old Johns Rd
Laurinburg, NC 28352
|
1,152 sq. feet
|
2 baths 3 beds |
show details | |

|
#15
Jenkins St
Fairmont, NC 28340
|
1,577 sq. feet
|
1 baths 2 beds |
show details | |

|
#16
Summer Ln
Laurinburg, NC 28352
|
1,406 sq. feet
|
2 baths 3 beds |
show details | |

|
#17
N Martin Luther King Jr St
Rowland, NC 28383
|
1,848 sq. feet
|
2 baths 3 beds |
show details | |

|
#18
Fairway Dr
Laurinburg, NC 28352
|
2,108 sq. feet
|
3 baths 4 beds |
show details | |

|
#19
Coward Dr
Fairmont, NC 28340
|
1,248 sq. feet
|
2 baths 3 beds |
show details | |

|
#20
Deep Branch Rd
Pembroke, NC 28372
|
1,680 sq. feet
|
2 baths 3 beds |
show details |
| Photo | Address | Area | Beds / Baths | Price | Details |
|---|---|---|---|---|---|

|
#21
Mcleod Rd
Laurinburg, NC 28352
|
- sq. feet
|
- baths - beds |
show details | |

|
#22
Beth Dr
Latta, SC 29565
|
- sq. feet
|
- baths - beds |
show details | |

|
#23
Highway 38 W
Latta, SC 29565
|
- sq. feet
|
- baths - beds |
show details | |

|
#24
Shaw Rd # A
Laurinburg, NC 28352
|
- sq. feet
|
- baths - beds |
show details | |

|
#25
Salem Rd
Bennettsville, SC 29512
|
- sq. feet
|
- baths - beds |
show details | |

|
#26
E Dr M L King Jr Dr
Maxton, NC 28364
|
- sq. feet
|
- baths - beds |
show details | |

|
#27
Holly Ln
Laurinburg, NC 28352
|
- sq. feet
|
- baths - beds |
show details | |

|
#28
Baltimore Church Rd
Fairmont, NC 28340
|
- sq. feet
|
- baths - beds |
show details | |

|
#29
Nc Highway 130 W
Maxton, NC 28364
|
- sq. feet
|
- baths - beds |
show details | |

|
#30
Pembroke Pointe Ln Apt 2f
Pembroke, NC 28372
|
- sq. feet
|
- baths - beds |
show details |
| Photo | Address | Area | Beds / Baths | Price | Details |
|---|---|---|---|---|---|

|
#31
Iris Ln
Bennettsville, SC 29512
|
- sq. feet
|
- baths - beds |
show details | |

|
#32
Jigsaw Ln
Maxton, NC 28364
|
- sq. feet
|
- baths - beds |
show details | |

|
#33
Mccoll Rd Apt 101
Laurinburg, NC 28352
|
- sq. feet
|
- baths - beds |
show details | |

|
#34
Chicken Rd
Fairmont, NC 28340
|
- sq. feet
|
- baths - beds |
show details | |

|
#35
Union Chapel Rd, # B
Pembroke, NC 28372
|
- sq. feet
|
- baths - beds |
show details | |

|
#36
Usher St
Bennettsville, SC 29512
|
- sq. feet
|
- baths - beds |
show details | |

|
#37
Magnolia Dr
Fairmont, NC 28340
|
- sq. feet
|
- baths - beds |
show details | |

|
#38
Antioch Church Rd
Sellers, SC 29592
|
- sq. feet
|
- baths - beds |
show details | |

|
#39
Willow Dr
Laurinburg, NC 28352
|
- sq. feet
|
- baths - beds |
show details | |

|
#40
Lumbee St Apt B
Pembroke, NC 28372
|
- sq. feet
|
- baths - beds |
show details |
| Photo | Address | Area | Beds / Baths | Price | Details |
|---|---|---|---|---|---|

|
#41
Pearce Ln
Bennettsville, SC 29512
|
- sq. feet
|
- baths - beds |
show details | |

|
#42
Elkins Rd
Hamer, SC 29547
|
- sq. feet
|
- baths - beds |
show details | |

|
#43
Holly St
Latta, SC 29565
|
- sq. feet
|
- baths - beds |
show details | |

|
#44
Kitchen Street Rd
Rowland, NC 28383
|
- sq. feet
|
- baths - beds |
show details | |

|
#45
Wilbert St
Dillon, SC 29536
|
- sq. feet
|
- baths - beds |
show details | |

|
#46
Midway Rd
Maxton, NC 28364
|
- sq. feet
|
- baths - beds |
show details | |

|
#47
Yokon Rd
Fairmont, NC 28340
|
- sq. feet
|
- baths - beds |
show details | |

|
#48
Rolling Oaks Rd
Dillon, SC 29536
|
- sq. feet
|
- baths - beds |
show details | |

|
#49
East St
Dillon, SC 29536
|
- sq. feet
|
- baths - beds |
show details | |

|
Check over 1 million property listings on Foreclosure.com!
|
browse all offers | |||

Household type by relationship:
Households: 31,611- In family households: 27,505 (4,424 male householders, 3,918 female householders)
4,795 spouses, 10,006 children (9,304 natural, 235 adopted, 467 stepchildren), 1,845 grandchildren, 508 brothers or sisters, 343 parents, foster children, 712 other relatives, 807 non-relatives
- In nonfamily households: 4,106 (1,679 male householders (1,429 living alone)), 1,902 female householders (1,735 living alone)), 525 nonrelatives
- In group quarters: 451 (359 institutionalized population)
4,182 married couples with children.
2,994 single-parent households (414 men, 2,580 women).
96.2% of residents of Little Rock speak English at home.
2.8% of residents speak Spanish at home (44% speak English very well, 12% speak English well, 43% speak English not well).
0.7% of residents speak other Indo-European language at home (50% speak English very well, 33% speak English well, 17% speak English not well).
0.2% of residents speak Asian or Pacific Island language at home (100% speak English well).
Foreign born population: 78 (2.1%)
(59.0% of them are naturalized citizens)
| Here: | 6.2 |
| State: | 6.4 |
| Here: | 6.1 |
| State: | 4.5 |
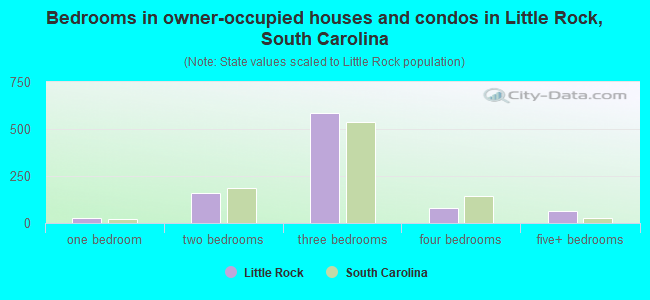
- Bedrooms in owner-occupied houses and condos in Little Rock, South Carolina
- 0no bedroom
- 261 bedroom
- 1592 bedrooms
- 5833 bedrooms
- 824 bedrooms
- 655+ bedrooms
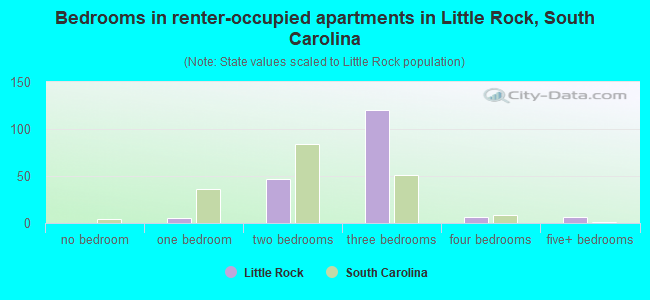
- Bedrooms in renter-occupied apartments in Little Rock, South Carolina
- 0no bedroom
- 51 bedroom
- 472 bedrooms
- 1203 bedrooms
- 64 bedrooms
- 65+ bedrooms
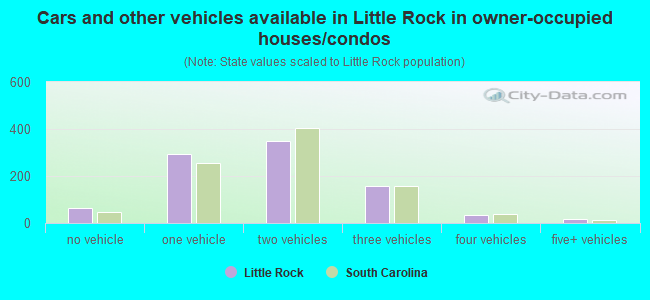
- Cars and other vehicles available in Little Rock in owner-occupied houses/condos
- 64no vehicle
- 2931 vehicle
- 3512 vehicles
- 1573 vehicles
- 324 vehicles
- 185+ vehicles
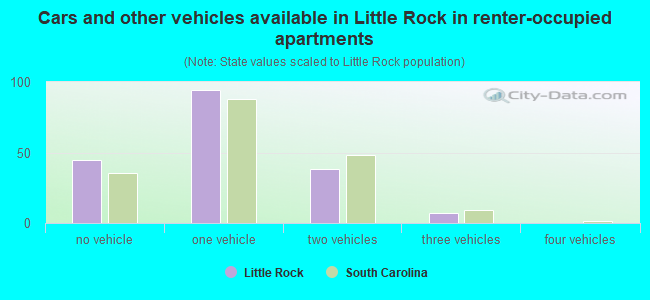
- Cars and other vehicles available in Little Rock in renter-occupied apartments
- 45no vehicle
- 941 vehicle
- 382 vehicles
- 73 vehicles
- 04 vehicles
- 05+ vehicles
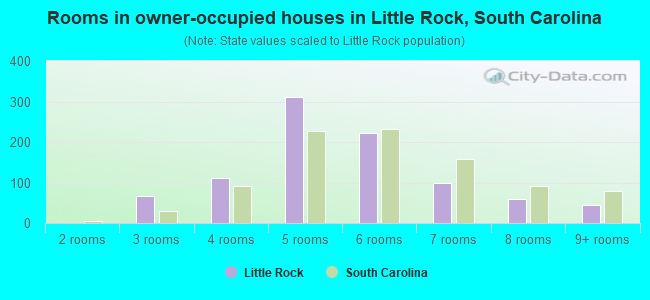
- Rooms in owner-occupied houses in Little Rock, South Carolina
- 01 room
- 02 rooms
- 663 rooms
- 1124 rooms
- 3115 rooms
- 2236 rooms
- 1007 rooms
- 598 rooms
- 449+ rooms
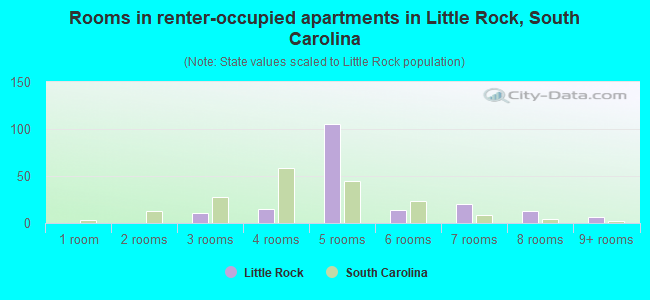
- Rooms in renter-occupied apartments in Little Rock, South Carolina
- 01 room
- 02 rooms
- 113 rooms
- 154 rooms
- 1055 rooms
- 146 rooms
- 207 rooms
- 138 rooms
- 69+ rooms
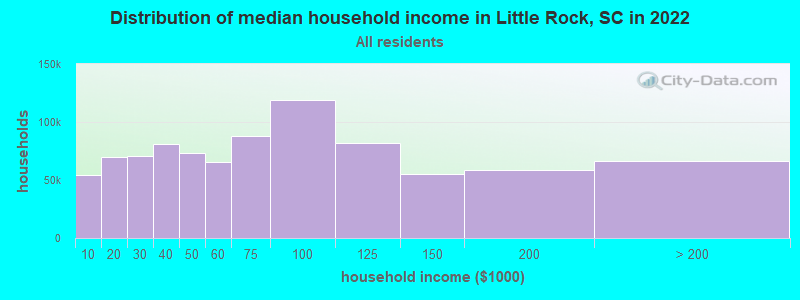
Little Rock, SC household income distribution

- 37,644Less than $10,000
- 57,584$10,000 to $19,999
- 50,373$20,000 to $29,999
- 55,932$30,000 to $39,999
- 51,629$40,000 to $49,999
- 40,324$50,000 to $59,999
- 53,769$60,000 to $74,999
- 71,266$75,000 to $99,999
- 50,288$100,000 to $124,999
- 31,504$125,000 to $149,999
- 31,339$150,000 to $199,999
- 30,897$200,000 or more
Percentage of workers working in this county: 69.3%
Number of people working at home: 99 (7.4% of all workers)
Travel time to work (commute)
- Less than 5 minutes: 50
- 5 to 9 minutes: 82
- 10 to 14 minutes: 212
- 15 to 19 minutes: 227
- 20 to 24 minutes: 55
- 25 to 29 minutes: 57
- 30 to 34 minutes: 95
- 35 to 39 minutes: 29
- 40 to 44 minutes: 55
- 45 to 59 minutes: 94
- 60 to 89 minutes: 112
- 90 or more minutes: 226
Means of transportation to work:
- Drove a car alone: 920 (70.2%)
- Carpooled: 341 (26.0%)
- Bicycle: 8 (0.6%)
- Walked: 8 (0.6%)
- Other means: 17 (1.3%)
- Worked at home: 16 (1.2%)
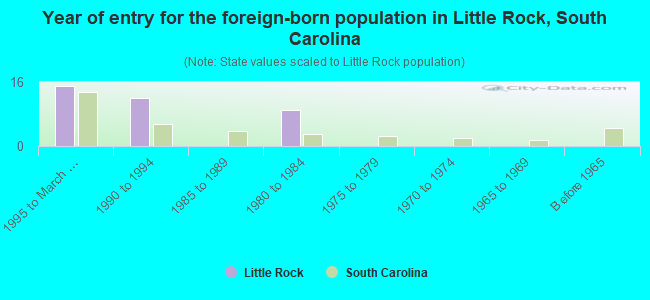
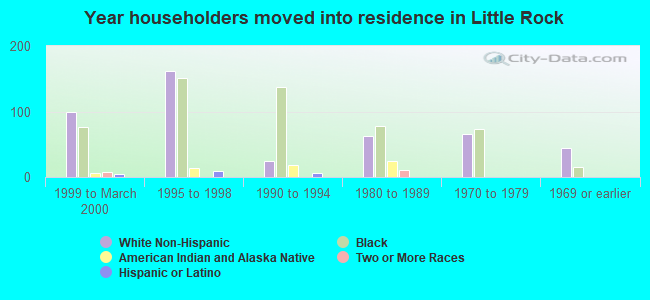
- Year of entry for the foreign-born population in Little Rock, South Carolina
- 151995 to March 2000
- 121990 to 1994
- 01985 to 1989
- 91980 to 1984
- 01975 to 1979
- 01970 to 1974
- 01965 to 1969
- 0Before 1965
Most common places of birth for foreign-born residents (%):
| Little Rock: | 41.7% (15) |
| South Carolina: | 27.3% (31,719) |
| Little Rock: | 25.0% (9) |
| South Carolina: | 0.5% (540) |
| Little Rock: | 22.2% (8) |
| South Carolina: | 2.7% (3,098) |
| Little Rock: | 11.1% (4) |
| South Carolina: | 6.8% (7,873) |
Place of birth for U.S.-born residents:
- This state: 3,001
- Other state: 472
- Northeast: 98
- Midwest: 23
- South: 340
- West: 11
66% of Little Rock residents lived in the same house 5 years ago.
Out of people who lived in different houses, 74% lived in this county.
Out of people who lived in different counties, 52% lived in South Carolina.
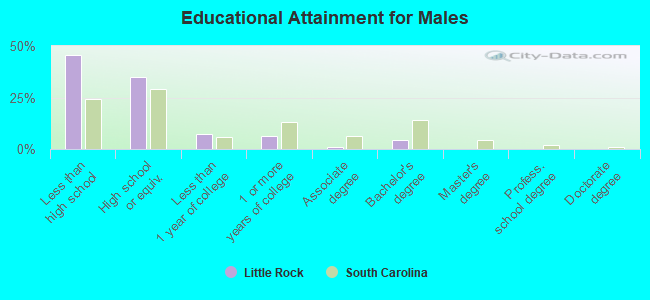
Education attainment for males 25 years and older:
- No schooling: 19
- Nursery to 4th grade: 47
- 5th and 6th grade: 18
- 7th and 8th grade: 47
- 9th grade: 29
- 10th grade: 101
- 11th grade: 67
- 12th grade, no diploma: 95
- High school graduate (or equivalency): 325
- Less than 1 year of college: 69
- Some college more than 1 year, no degree: 58
- Associate degree: 11
- Bachelor's degree: 42
- Master's degree: 0
- Professional school degree: 0
- Doctorate degree: 0
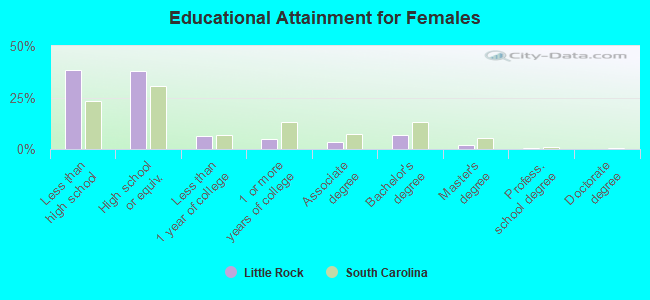
Education attainment for females 25 years and older:
- No schooling: 17
- Nursery to 4th grade: 30
- 5th and 6th grade: 43
- 7th and 8th grade: 88
- 9th grade: 52
- 10th grade: 90
- 11th grade: 41
- 12th grade, no diploma: 51
- High school graduate (or equivalency): 406
- Less than 1 year of college: 66
- Some college more than 1 year, no degree: 54
- Associate degree: 36
- Bachelor's degree: 71
- Master's degree: 21
- Professional school degree: 5
- Doctorate degree: 0
Housing units in structures:
- One, detached: 548
- One, attached: 32
- Two: 15
- 3 or 4: 5
- Mobile homes: 632
Median worth of mobile homes: $58,807
Housing units lacking complete kitchen facilities: 3.2%
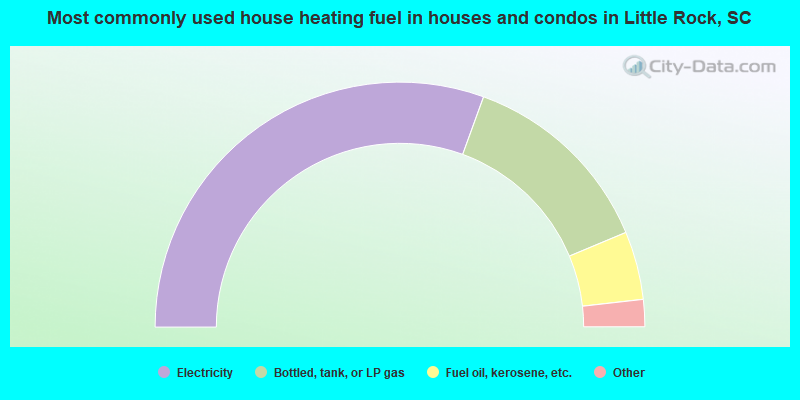
- 61.1%Electricity
- 26.3%Bottled, tank, or LP gas
- 9.0%Fuel oil, kerosene, etc.
- 1.1%Utility gas
- 1.0%No fuel used
- 0.9%Other fuel
- 0.7%Wood
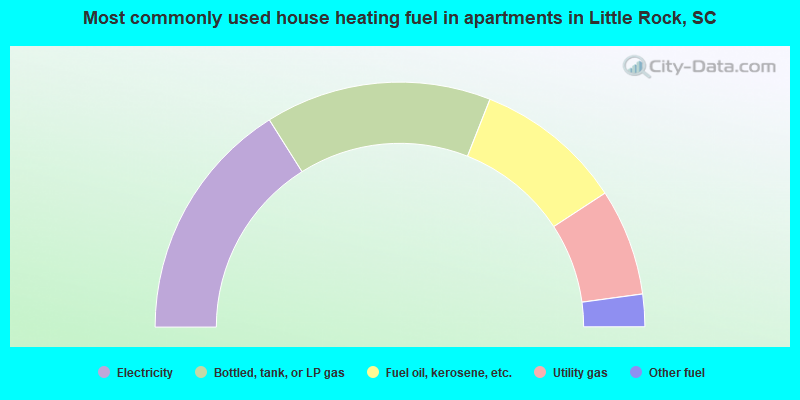
- 32.1%Electricity
- 29.9%Bottled, tank, or LP gas
- 19.6%Fuel oil, kerosene, etc.
- 14.1%Utility gas
- 4.3%Other fuel
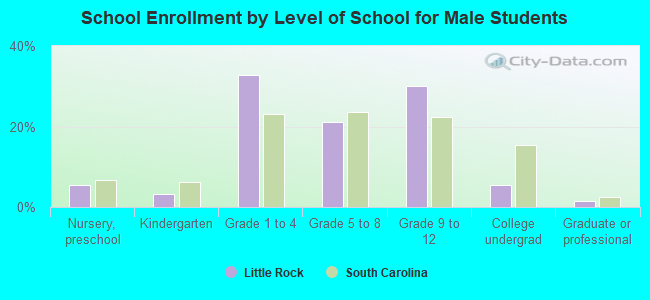
Private vs. public school enrollment:
| Here: | 8.7% |
| South Carolina: | 9.2% |
| Here: | 7.7% |
| South Carolina: | 8.1% |
| Here: | 5.4% |
| South Carolina: | 20.3% |