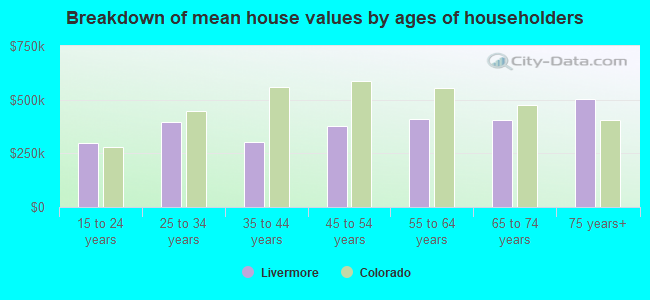
Median price asked for vacant for-sale houses and condos in 2022 in this county: $1,573,428.
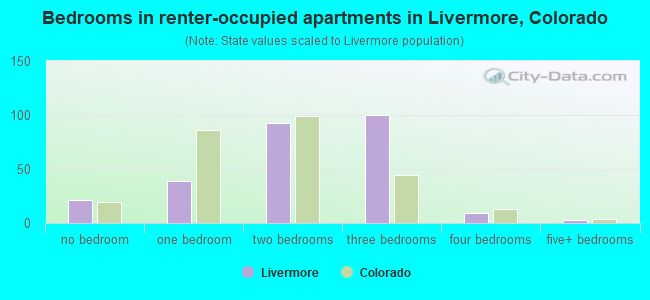
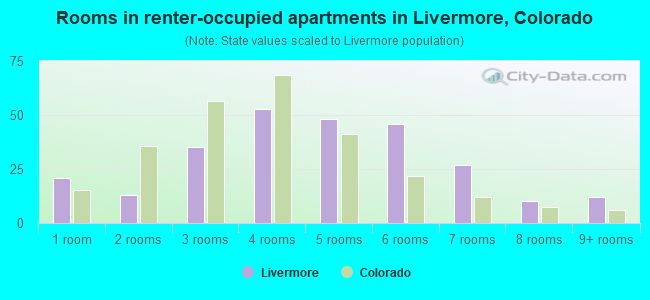
Median contract rent in 2022: $1,262 (lower quartile is $911, upper quartile is $1,539)
Median gross rent in Livermore, CO in 2022: $1,543
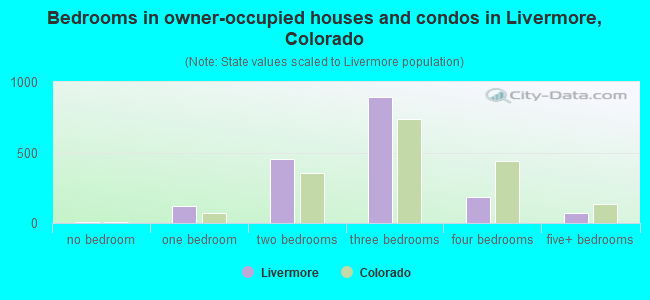
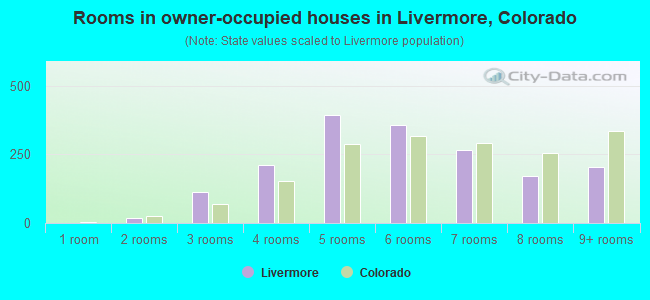
Housing units in Livermore with a mortgage: 648 (112 second mortgage, 106 home equity loan, 7 both second mortgage and home equity loan) Houses without a mortgage: 414
In family households: 226,053 (55,338 male householders, 19,655 female householders)
60,320 spouses, 74,622 children (69,131 natural, 2,271 adopted, 3,220 stepchildren), 3,604 grandchildren, 2,152 brothers or sisters, 1,601 parents, foster children, 1,897 other relatives, 5,607 non-relatives
In nonfamily households: 65,047 (21,726 male householders (14,035 living alone)), 23,576 female householders (17,152 living alone)), 19,745 nonrelatives
In group quarters: 8,530 (1,998 institutionalized population)
45,289 married couples with children.
11,091 single-parent households (2,820 men, 8,271 women).
97.0% of residents of Livermore speak English at home.
1.5% of residents speak Spanish at home (76% speak English very well, 7% speak English well, 16% speak English not well).
1.3% of residents speak other Indo-European language at home (89% speak English very well, 11% speak English well).
0.2% of residents speak other language at home (100% speak English very well).
Foreign born population: 221 (3.2%)
(80.5% of them are naturalized citizens)
Percentage of workers working in this county: 89.0% Number of people working at home: 721 (19.2% of all workers)
Travel time to work (commute)
Less than 5 minutes: 57
5 to 9 minutes: 180
10 to 14 minutes: 95
15 to 19 minutes: 135
20 to 24 minutes: 228
25 to 29 minutes: 161
30 to 34 minutes: 358
35 to 39 minutes: 81
40 to 44 minutes: 187
45 to 59 minutes: 452
60 to 89 minutes: 309
90 or more minutes: 138
Means of transportation to work:
Drove a car alone: 1,727 (66.1%)
Carpooled: 482 (18.4%)
Motorcycle: 7 (0.3%)
Bicycle: 11 (0.4%)
Walked: 130 (5.0%)
Other means: 24 (0.9%)
Worked at home: 232 (8.9%)
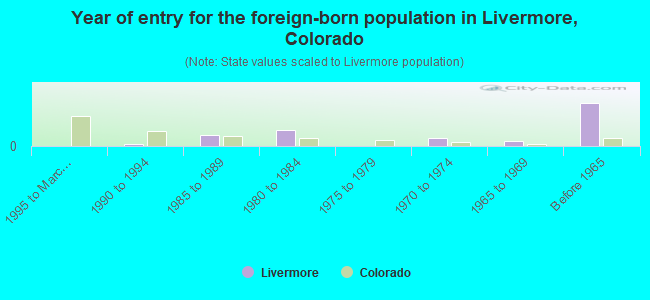
Year of entry for the foreign-born population in Livermore, Colorado
01995 to March 2000
31990 to 1994
171985 to 1989
241980 to 1984
01975 to 1979
121970 to 1974
81965 to 1969
66Before 1965
Most common places of birth for foreign-born residents (%):
Germany
Livermore:
28.5% (37)
Colorado:
4.5% (16,615)
Canada
Livermore:
26.9% (35)
Colorado:
3.7% (13,552)
Czechoslovakia (includes Czech Republic and Slovakia)
Livermore:
8.5% (11)
Colorado:
0.5% (1,888)
Korea
Livermore:
7.7% (10)
Colorado:
3.3% (12,356)
Venezuela
Livermore:
7.7% (10)
Colorado:
0.2% (808)
Italy
Livermore:
5.4% (7)
Colorado:
0.6% (2,125)
El Salvador
Livermore:
4.6% (6)
Colorado:
1.2% (4,454)
United Kingdom
Livermore:
3.8% (5)
Colorado:
3.1% (11,301)
Australia
Livermore:
3.8% (5)
Colorado:
0.5% (1,948)
Cuba
Livermore:
3.1% (4)
Colorado:
0.3% (1,255)
Place of birth for U.S.-born residents:
This state: 1,461
Other state: 3,085
Northeast: 522
Midwest: 1,509
South: 505
West: 549
47% of Livermore residents lived in the same house 5 years ago. Out of people who lived in different houses, 47% lived in this county. Out of people who lived in different counties, 46% lived in Colorado.
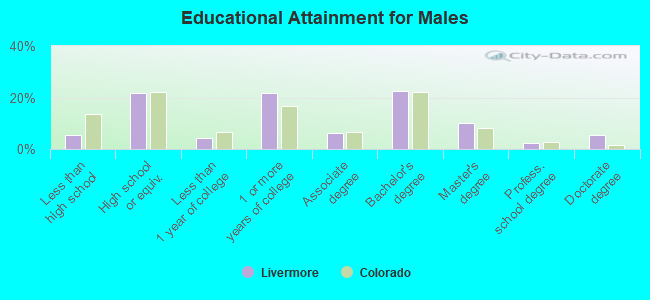
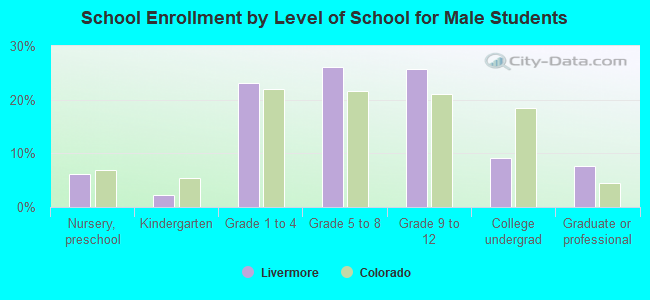
Education attainment for males 25 years and older:
No schooling: 6
Nursery to 4th grade: 6
5th and 6th grade: 6
7th and 8th grade: 14
9th grade: 9
10th grade: 19
11th grade: 16
12th grade, no diploma: 27
High school graduate (or equivalency): 416
Less than 1 year of college: 81
Some college more than 1 year, no degree: 411
Associate degree: 118
Bachelor's degree: 429
Master's degree: 191
Professional school degree: 48
Doctorate degree: 105
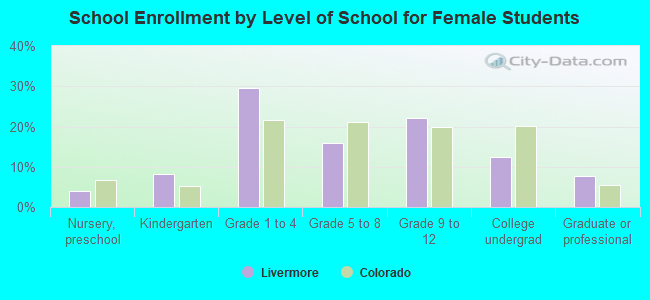
Education attainment for females 25 years and older:
No schooling: 0
Nursery to 4th grade: 0
5th and 6th grade: 0
7th and 8th grade: 16
9th grade: 8
10th grade: 15
11th grade: 0
12th grade, no diploma: 59
High school graduate (or equivalency): 337
Less than 1 year of college: 105
Some college more than 1 year, no degree: 468
Associate degree: 166
Bachelor's degree: 499
Master's degree: 101
Professional school degree: 36
Doctorate degree: 30
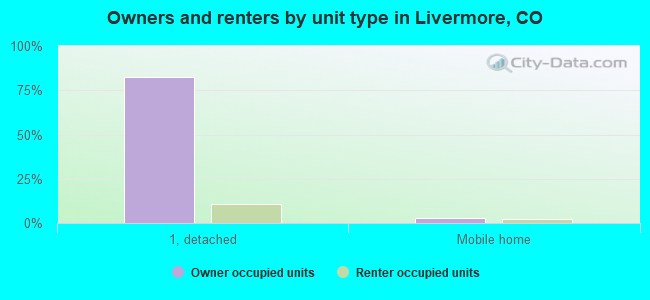
Housing units in structures:
One, detached: 3,704
One, attached: 38
3 or 4: 6
5 to 9: 31
50 or more: 11
Mobile homes: 265
Boats, RVs, vans, etc.: 32
Median worth of mobile homes: $185,310
Housing units lacking complete plumbing facilities: 9.9%
Housing units lacking complete kitchen facilities: 8.1%