Lochmoor Waterway Estates, FL (Florida) Houses and Residents
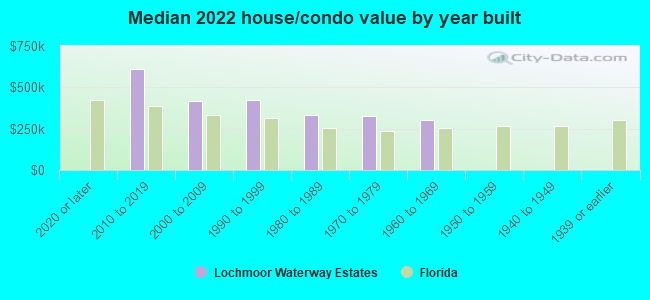
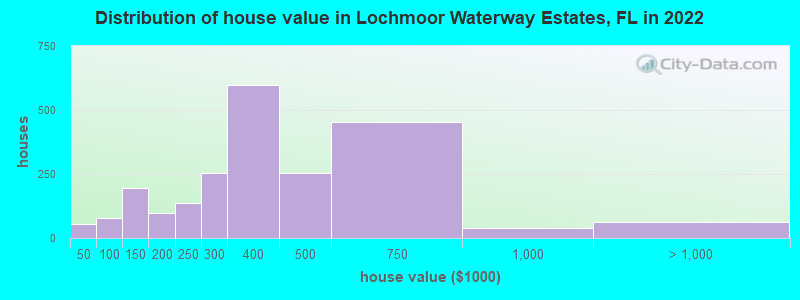
Estimated median house or condo value in 2022: $354,567 (it was $112,700 in 2000 )
Lochmoor Waterway Estates:
$354,567Florida:
$354,100
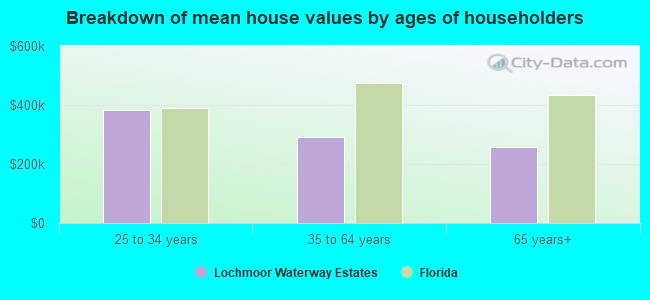
Lower value quartile - upper value quartile: $205,909 - $490,827Mean price in 2022: Detached houses: $379,770 Here:
$379,770State:
$500,941
Townhouses or other attached units: $153,970 Here:
$153,970State:
$370,869
In 2-unit structures: $373,510 Here:
$373,510State:
$423,188
In 3-to-4-unit structures: $223,566 Here:
$223,566State:
$309,944
In 5-or-more-unit structures: $142,262 Here:
$142,262State:
$447,145
Total population: 4,204 (Urban population: 3,857, Rural population: 0)
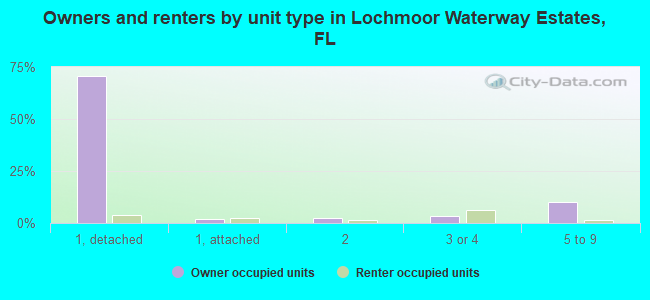
Houses: 3,115 (2,577 occupied: 2,282 owner occupied, 384 renter occupied )
% of renters here:
14%State:
33%
Housing density: 1,397 houses/condos per square mile
Median price asked for vacant for-sale houses and condos in 2022: $225,034.
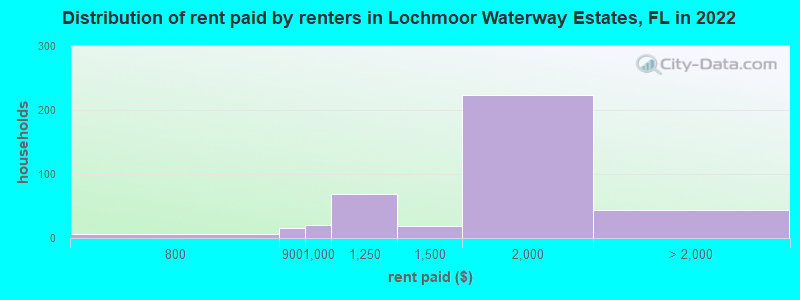
Median contract rent in 2022: $1,674 (lower quartile is $1,152, upper quartile is $1,961)
Median rent asked for vacant for-rent units in 2022: $2,047
Median gross rent in Lochmoor Waterway Estates, FL in 2022: $1,771
Housing units in Lochmoor Waterway Estates with a mortgage: 1,319 (132 second mortgage, 0 home equity loan, 111 both second mortgage and home equity loan )Houses without a mortgage: 118
Median household income for houses/condos with a mortgage: $100,064
Median household income for apartments without a mortgage: $43,906
Median monthly housing costs: $1,257
Data:
Median house or condo value ($)
Median house or condo value ($ change since 2000)
Median house or condo value ($) - White
Median house or condo value ($) - Black or African American
Median house or condo value ($) - Asian
Median house or condo value ($) - Hispanic or Latino
Median house or condo value ($) - American Indian and Alaska Native
Median house or condo value ($) - Multirace
Median house or condo value ($) - Other Race
Median price asked for mobile homes ($)
Household density (households per square mile)
Mean house or condo value by units in structure - 1, detached ($)
Mean house or condo value by units in structure - 1, attached ($)
Mean house or condo value by units in structure - 2 ($)
Mean house or condo value by units in structure by units in structure - 3 or 4 ($)
Mean house or condo value by units in structure - 5 or more ($)
Mean house or condo value by units in structure - Boat, RV, van, etc. ($)
Mean house or condo value by units in structure - Mobile home ($)
Median contract rent ($)
Median contract rent - Lower quartile ($)
Median contract rent - Upper quartile ($)
Median gross rent ($)
Urban houses (%)
Rural houses (%)
Houses occupied (%)
Houses occupied (% change since 2000)
Houses owner occupied (%)
Houses owner occupied (% change since 2000)
Houses renter occupied (%)
Houses renter occupied (% change since 2000)
Vacant housing units - For rent (%)
Vacant housing units - For rent (% change since 2000)
Vacant housing units - For sale only (%)
Vacant housing units - For sale only (% change since 2000)
Vacant housing units - Rented or sold, not occupied (%)
Vacant housing units - Rented or sold, not occupied (% change since 2000)
Vacant housing units - For seasonal, recreational, or occasional use (%)
Vacant housing units - For seasonal, recreational, or occasional use (% change since 2000)
Vacant housing units - For migrant workers (%)
Vacant housing units - For migrant workers (% change since 2000)
Vacant housing units - Other vacant (%)
Vacant housing units - Other vacant (% change since 2000)
Median monthly housing costs ($)
Median household income for houses/condos with a mortgage ($)
Median household income for houses/condos without a mortgage ($)
Median household income ($)
Median household income ($) - White
Median household income ($) - Black or African American
Median household income ($) - Asian
Median household income ($) - Hispanic or Latino
Median household income ($) - American Indian and Alaska Native
Median household income ($) - Multirace
Median household income ($) - Other Race
Mortgage status - with mortgage (%)
Mortgage status - with second mortgage (%)
Mortgage status - with home equity loan (%)
Mortgage status - with both second mortgage and home equity loan (%)
Mortgage status - without a mortgage (%)
Median year house/condo built
Median year apartment built
Household type by relationship - Male householder living alone (%)
Household type by relationship - Male householder not living alone (%)
Household type by relationship - Female householder living alone (%)
Household type by relationship - Female householder not living alone (%)
Household type by relationship - Opposite-Sex spouse (%)
Household type by relationship - Same-Sex spouse (%)
Household type by relationship - Opposite-Sex unmarried partner (%)
Household type by relationship - Same-Sex unmarried partner (%)
Household type by relationship - In group quarters (%)
Size of family households - 2-person household (%)
Size of family households - 3-person household (%)
Size of family households - 4-person household (%)
Size of family households - 5-person household (%)
Size of family households - 6-person household (%)
Size of family households - 7-or-more-person household (%)
Size of nonfamily households - 1-person household (%)
Size of nonfamily households - 2-person household (%)
Size of nonfamily households - 3-person household (%)
Size of nonfamily households - 4-person household (%)
Size of nonfamily households - 5-person household (%)
Size of nonfamily households - 6-person household (%)
Size of nonfamily households - 7-or-moreperson household (%)
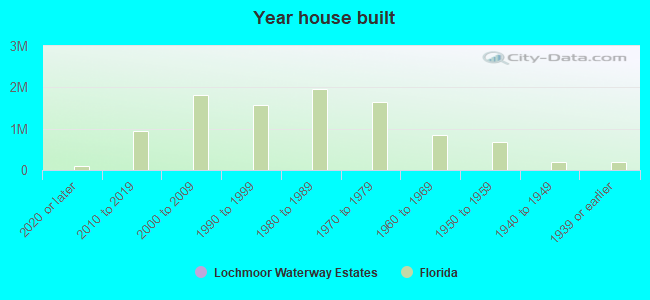
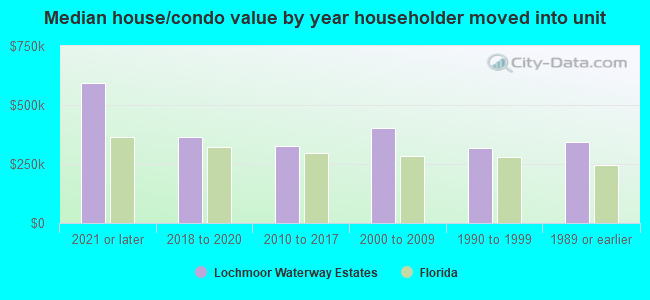
Year house built - Built 2010 or later (%)
Year house built - Built 2000 to 2009 (%)
Year house built - Built 1990 to 1999 (%)
Year house built - Built 1980 to 1989 (%)
Year house built - Built 1970 to 1979 (%)
Year house built - Built 1960 to 1969 (%)
Year house built - Built 1950 to 1959 (%)
Year house built - Built 1940 to 1949 (%)
Year house built - Built 1939 or earlier (%)
Median number of rooms in houses and condos
Median number of rooms in apartments
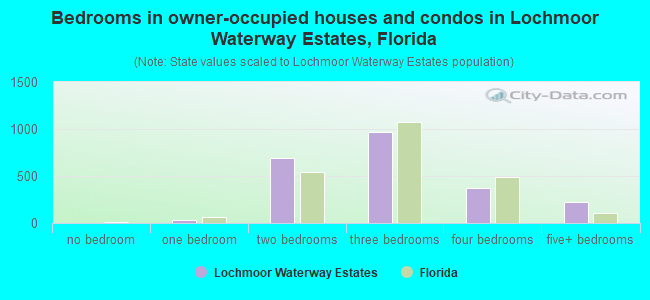
Median number of bedrooms in owner occupied houses
Mean number of bedrooms in owner occupied houses
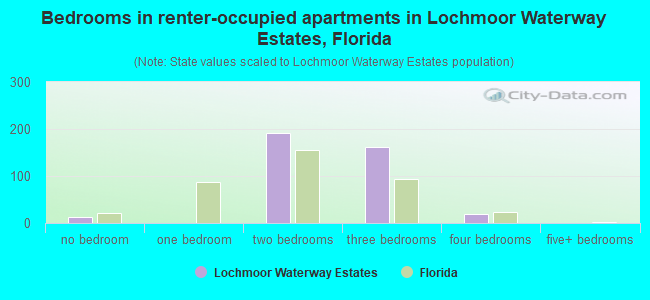
Median number of bedrooms in renter occupied houses
Mean number of bedrooms in renter occupied houses
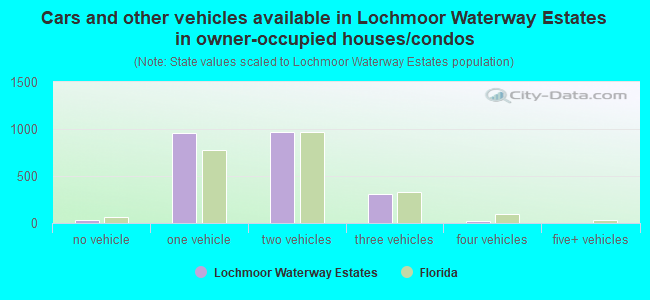
Median number of vehichles in owner occupied houses
Mean number of vehichles in owner occupied houses
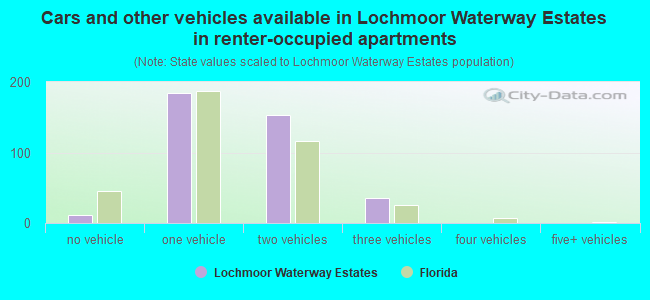
Median number of vehichles in renter occupied houses
Mean number of vehichles in renter occupied houses
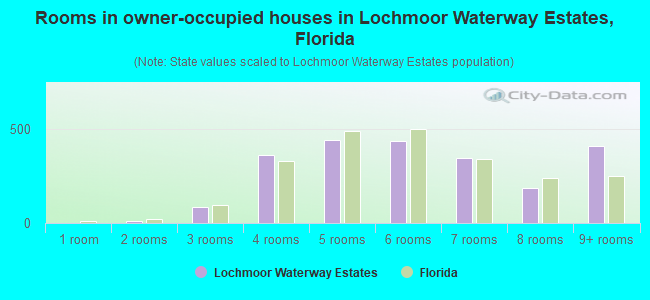
Rooms in owner-occupied houses - 1 room (%)
Rooms in owner-occupied houses - 2 rooms (%)
Rooms in owner-occupied houses - 3 rooms (%)
Rooms in owner-occupied houses - 4 rooms (%)
Rooms in owner-occupied houses - 5 rooms (%)
Rooms in owner-occupied houses - 6 rooms (%)
Rooms in owner-occupied houses - 7 rooms (%)
Rooms in owner-occupied houses - 8 rooms (%)
Rooms in owner-occupied houses - 9+ rooms (%)
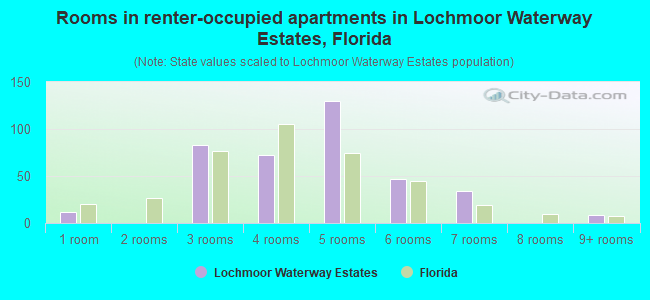
Rooms in renter-occupied houses - 1 room (%)
Rooms in renter-occupied houses - 2 rooms (%)
Rooms in renter-occupied houses - 3 rooms (%)
Rooms in renter-occupied houses - 4 rooms (%)
Rooms in renter-occupied houses - 5 rooms (%)
Rooms in renter-occupied houses - 6 rooms (%)
Rooms in renter-occupied houses - 7 rooms (%)
Rooms in renter-occupied houses - 8 rooms (%)
Rooms in renter-occupied houses - 9+ rooms (%)
Bedrooms in owner-occupied houses - no bedrooms (%)
Bedrooms in owner-occupied houses - 1 bedroom (%)
Bedrooms in owner-occupied houses - 2 bedrooms (%)
Bedrooms in owner-occupied houses - 3 bedrooms (%)
Bedrooms in owner-occupied houses - 4 bedrooms (%)
Bedrooms in owner-occupied houses - 5+ bedrooms (%)
Bedrooms in renter-occupied houses - no bedrooms (%)
Bedrooms in renter-occupied houses - 1 bedroom (%)
Bedrooms in renter-occupied houses - 2 bedrooms (%)
Bedrooms in renter-occupied houses - 3 bedrooms (%)
Bedrooms in renter-occupied houses - 4 bedrooms (%)
Bedrooms in renter-occupied houses - 5+ bedrooms (%)
Vehicles available in owner-occupied houses - no vehicle available (%)
Vehicles available in owner-occupied houses - 1 vehicle available(%)
Vehicles available in owner-occupied houses - 2 Vehicles available (%)
Vehicles available in owner-occupied houses - 3 Vehicles available (%)
Vehicles available in owner-occupied houses - 4 Vehicles available (%)
Vehicles available in owner-occupied houses - 5+ Vehicles available (%)
Vehicles available in renter-occupied houses - no vehicle available (%)
Vehicles available in renter-occupied houses - 1 vehicle available (%)
Vehicles available in renter-occupied houses - 2 Vehicles available (%)
Vehicles available in renter-occupied houses - 3 Vehicles available (%)
Vehicles available in renter-occupied houses - 4 Vehicles available (%)
Vehicles available in renter-occupied houses - 5+ Vehicles available (%)
Housing units in structures - 1, detached (%)
Housing units in structures - 1, attached (%)
Housing units in structures - 2 (%)
Housing units in structures - 3 or 4 (%)
Housing units in structures - 5 to 9 (%)
Housing units in structures - 10 to 19 (%)
Housing units in structures - 20 to 49 (%)
Housing units in structures - 50 or more (%)
Housing units in structures - Mobile home (%)
Housing units in structures - Boat, RV, van, etc. (%)
Housing units in structures - Owners - 1, detached (%)
Housing units in structures - Owners - 1, attached (%)
Housing units in structures - Owners - 2 (%)
Housing units in structures - Owners - 3 or 4 (%)
Housing units in structures - Owners - 5 to 9 (%)
Housing units in structures - Owners - 10 to 19 (%)
Housing units in structures - Owners - 20 to 49 (%)
Housing units in structures - Owners - 50 or more (%)
Housing units in structures - Owners - Mobile home (%)
Housing units in structures - Owners - Boat, RV, van, etc. (%)
Housing units in structures - Renters - 1, detached (%)
Housing units in structures - Renters - 1, attached (%)
Housing units in structures - Renters - 2 (%)
Housing units in structures - Renters - 3 or 4 (%)
Housing units in structures - Renters - 5 to 9 (%)
Housing units in structures - Renters - 10 to 19 (%)
Housing units in structures - Renters - 20 to 49 (%)
Housing units in structures - Renters - 50 or more (%)
Housing units in structures - Renters - Mobile home (%)
Housing units in structures - Renters - Boat, RV, van, etc. (%)
House/condo owner moved in on average (years ago)
Renter moved in on average (years ago)
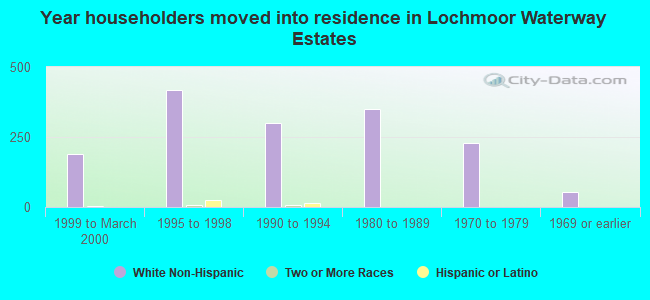
Year householder moved into unit - Moved in 1999 to March 2000 (%)
Year householder moved into unit - Moved in 1999 to March 2000 (%) - White
Year householder moved into unit - Moved in 1999 to March 2000 (%) - Black or African American
Year householder moved into unit - Moved in 1999 to March 2000 (%) - Asian
Year householder moved into unit - Moved in 1999 to March 2000 (%) - Hispanic or Latino
Year householder moved into unit - Moved in 1999 to March 2000 (%) - American Indian and Alaska Native
Year householder moved into unit - Moved in 1999 to March 2000 (%) - Multirace
Year householder moved into unit - Moved in 1999 to March 2000 (%) - Other Race
Year householder moved into unit - Moved in 1995 to 1998 (%)
Year householder moved into unit - Moved in 1995 to 1998 (%) - White
Year householder moved into unit - Moved in 1995 to 1998 (%) - Black or African American
Year householder moved into unit - Moved in 1995 to 1998 (%) - Asian
Year householder moved into unit - Moved in 1995 to 1998 (%) - Hispanic or Latino
Year householder moved into unit - Moved in 1995 to 1998 (%) - American Indian and Alaska Native
Year householder moved into unit - Moved in 1995 to 1998 (%) - Multirace
Year householder moved into unit - Moved in 1995 to 1998 (%) - Other Race
Year householder moved into unit - Moved in 1990 to 1994 (%)
Year householder moved into unit - Moved in 1990 to 1994 (%) - White
Year householder moved into unit - Moved in 1990 to 1994 (%) - Black or African American
Year householder moved into unit - Moved in 1990 to 1994 (%) - Asian
Year householder moved into unit - Moved in 1990 to 1994 (%) - Hispanic or Latino
Year householder moved into unit - Moved in 1990 to 1994 (%) - American Indian and Alaska Native
Year householder moved into unit - Moved in 1990 to 1994 (%) - Multirace
Year householder moved into unit - Moved in 1990 to 1994 (%) - Other Race
Year householder moved into unit - Moved in 1980 to 1989 (%)
Year householder moved into unit - Moved in 1980 to 1989 (%) - White
Year householder moved into unit - Moved in 1980 to 1989 (%) - Black or African American
Year householder moved into unit - Moved in 1980 to 1989 (%) - Asian
Year householder moved into unit - Moved in 1980 to 1989 (%) - Hispanic or Latino
Year householder moved into unit - Moved in 1980 to 1989 (%) - American Indian and Alaska Native
Year householder moved into unit - Moved in 1980 to 1989 (%) - Multirace
Year householder moved into unit - Moved in 1980 to 1989 (%) - Other Race
Year householder moved into unit - Moved in 1970 to 1979 (%)
Year householder moved into unit - Moved in 1970 to 1979 (%) - White
Year householder moved into unit - Moved in 1970 to 1979 (%) - Black or African American
Year householder moved into unit - Moved in 1970 to 1979 (%) - Asian
Year householder moved into unit - Moved in 1970 to 1979 (%) - Hispanic or Latino
Year householder moved into unit - Moved in 1970 to 1979 (%) - American Indian and Alaska Native
Year householder moved into unit - Moved in 1970 to 1979 (%) - Multirace
Year householder moved into unit - Moved in 1970 to 1979 (%) - Other Race
Year householder moved into unit - Moved in 1969 or earlier (%)
Year householder moved into unit - Moved in 1969 or earlier (%) - White
Year householder moved into unit - Moved in 1969 or earlier (%) - Black or African American
Year householder moved into unit - Moved in 1969 or earlier (%) - Asian
Year householder moved into unit - Moved in 1969 or earlier (%) - Hispanic or Latino
Year householder moved into unit - Moved in 1969 or earlier (%) - American Indian and Alaska Native
Year householder moved into unit - Moved in 1969 or earlier (%) - Multirace
Year householder moved into unit - Moved in 1969 or earlier (%) - Other Race
Housing units lacking complete plumbing facilities (%)
Housing units lacking complete kitchen facilities (%)
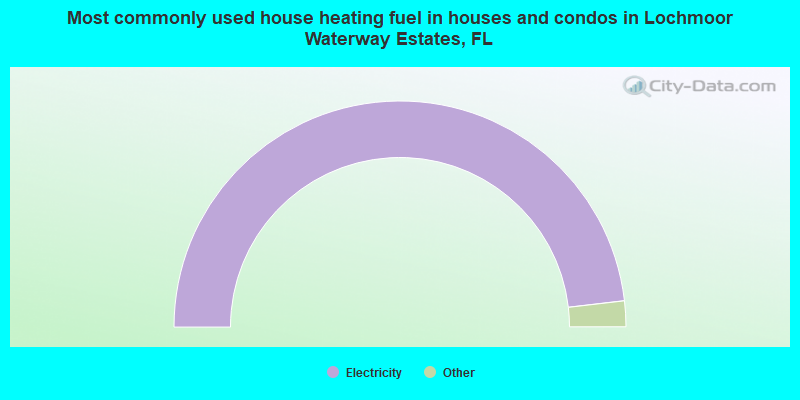
House heating fuel used in houses and condos - Utility gas (%)
House heating fuel used in houses and condos - Bottled, tank, or LP gas (%)
House heating fuel used in houses and condos - Electricity (%)
House heating fuel used in houses and condos - Fuel oil, kerosene, etc. (%)
House heating fuel used in houses and condos - Coal or coke (%)
House heating fuel used in houses and condos - Wood (%)
House heating fuel used in houses and condos - Solar energy (%)
House heating fuel used in houses and condos - Other fuel (%)
House heating fuel used in houses and condos - No fuel used (%)
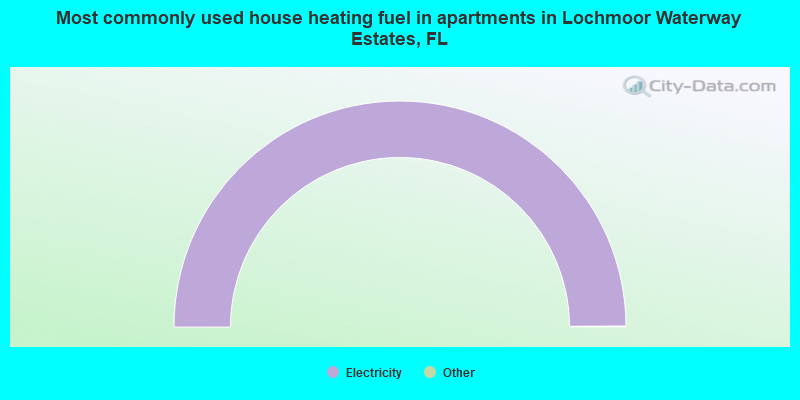
House heating fuel used in apartments - Utility gas (%)
House heating fuel used in apartments - Bottled, tank, or LP gas (%)
House heating fuel used in apartments - Electricity (%)
House heating fuel used in apartments - Fuel oil, kerosene, etc. (%)
House heating fuel used in apartments - Coal or coke (%)
House heating fuel used in apartments - Wood (%)
House heating fuel used in apartments - Solar energy (%)
House heating fuel used in apartments - Other fuel (%)
House heating fuel used in apartments - No fuel used (%)
Median year house/condo built: 1980Median year apartment built: 2003Household type by relationship:
Households: 5,668
Male householders: 1,253 (310 living alone ), Female householders: 1,351 (516 living alone )1,379 spouses (1,379 opposite-sex spouses ), 128 unmarried partners , (105 opposite-sex unmarried partners ), 1,210 children (1,084 natural , 48 adopted , 77 stepchildren ), 13 grandchildren , 27 brothers or sisters , 126 parents , 0 foster children , 0 other relatives , 176 non-relatives
Size of family households: 1,214 2-persons , 294 3-persons , 237 4-persons , 6 5-persons , 20 6-persons .
Size of nonfamily households: 803 1-person , 47 2-persons , 45 3-persons .
385 married couples with children. single-parent households (213 men , 110 women ).
92.1% of residents of Lochmoor Waterway Estates speak English at home. of residents speak Spanish at home (40% speak English very well , 49% speak English well , 11% speak English not well ).of residents speak other Indo-European language at home (60% speak English very well , 40% speak English well ).of residents speak Asian or Pacific Island language at home (100% speak English very well ).
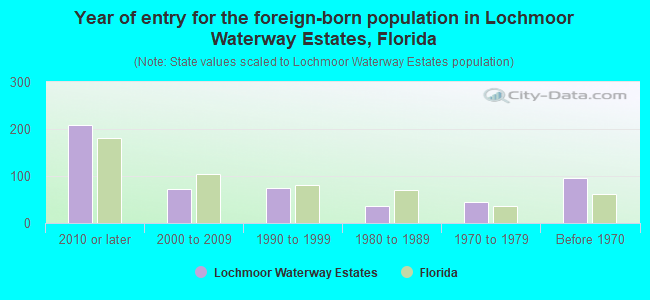
Foreign born population: 514 (9.1%)of them are naturalized citizens )
Median number of rooms in houses and condos:
Median number of rooms in apartments
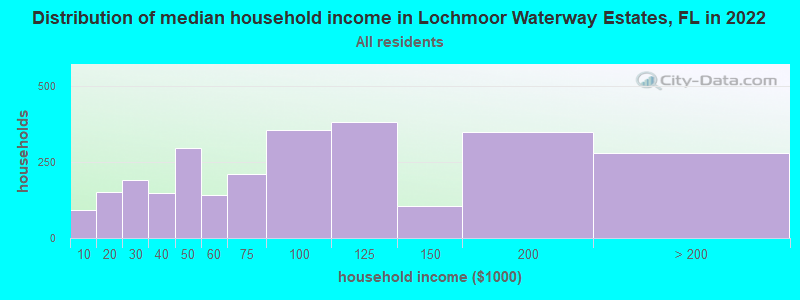
Lochmoor Waterway Estates, FL household income distribution 92 Less than $10,000151 $10,000 to $19,999192 $20,000 to $29,999147 $30,000 to $39,999296 $40,000 to $49,999143 $50,000 to $59,999211 $60,000 to $74,999357 $75,000 to $99,999382 $100,000 to $124,999106 $125,000 to $149,999348 $150,000 to $199,999279 $200,000 or more
Home value of owner - occupied houses in 2022 in Lochmoor Waterway Estates, FL 7 Less than $10,00016 $10,000 to $14,9997 $15,000 to $19,99917 $30,000 to $34,9995 $40,000 to $49,9998 $50,000 to $59,99920 $60,000 to $69,99944 $90,000 to $99,99985 $100,000 to $124,999107 $125,000 to $149,99955 $150,000 to $174,99942 $175,000 to $199,999137 $200,000 to $249,999254 $250,000 to $299,999597 $300,000 to $399,999255 $400,000 to $499,999454 $500,000 to $749,99940 $750,000 to $999,99930 $1,000,000 to $1,499,99930 $1,500,000 to $1,999,999Rent paid by renters in 2022 in Lochmoor Waterway Estates, FL 5 $700 to $74915 $800 to $89921 $900 to $99968 $1,000 to $1,24917 $1,250 to $1,499222 $1,500 to $1,99924 $2,000 to $2,4999 $3,500 or more10 No cash rent
Percentage of workers working in this county: 88.8%Number of people working at home: 494 (18.9% of all workers )
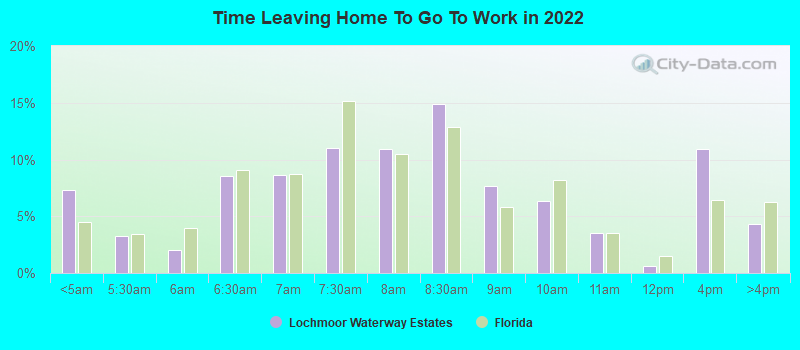
Travel time to work (commute)
Less than 5 minutes: 495 to 9 minutes: 18510 to 14 minutes: 32815 to 19 minutes: 38620 to 24 minutes: 27425 to 29 minutes: 3430 to 34 minutes: 39135 to 39 minutes: 040 to 44 minutes: 7745 to 59 minutes: 15860 to 89 minutes: 7190 or more minutes: 177
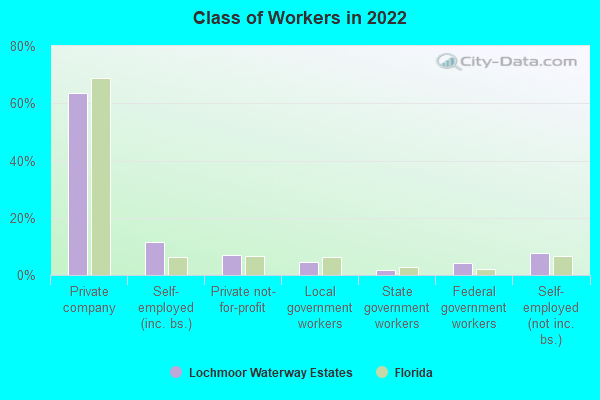
Means of transportation to work:
Drove a car alone: 1,701 (88.0%)Carpooled: 147 (7.6%)Bus or trolley bus : 7 (0.4%)Ferryboat: 8 (0.4%)Walked: 7 (0.4%)Other means: 5 (0.3%)Worked at home: 59 (3.1%)
Unemployment by race in 2022
Unemployment rate for White non-Hispanic residents 3.2% Males2.4% FemalesUnemployment rate for Black residents 58.9% MalesUnemployment rate for two or more race residents 33.6% FemalesUnemployment rate for Hispanic or Latino residents 28.2% Females
Year of entry for the foreign-born population in Lochmoor Waterway Estates, Florida
208 2010 or later 73 2000 to 2009 74 1990 to 1999 37 1980 to 1989 45 1970 to 1979 95 Before 1970
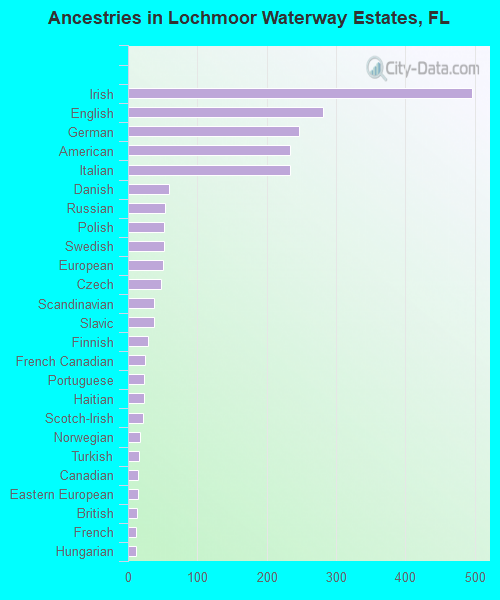
First ancestries reported:
Irish: 496 (18.7%)
English: 281 (10.6%)
German: 247 (9.3%)
American: 234 (8.8%)
Italian: 233 (8.8%)
Danish: 59 (2.2%)
Russian: 53 (2.0%)
Polish: 52 (2.0%)
Swedish: 52 (2.0%)
European: 50 (1.9%)
Czech: 48 (1.8%)
Scandinavian: 37 (1.4%)
Slavic: 37 (1.4%)
Finnish: 29 (1.1%)
French Canadian: 25 (0.9%)
Portuguese: 23 (0.9%)
Haitian: 23 (0.9%)
Scotch-Irish: 21 (0.8%)
Norwegian: 18 (0.7%)
Turkish: 16 (0.6%)
Canadian: 14 (0.5%)
Eastern European: 14 (0.5%)
British: 13 (0.5%)
French: 12 (0.5%)
Hungarian: 12 (0.5%)
Austrian: 10 (0.4%)
Dutch: 8 (0.3%)
Brazilian: 7 (0.3%) Most common places of birth for foreign-born residents (%): Cuba Lochmoor Waterway Estates:
21.6% (101)Florida:
22.0% (1,006,576)
Haiti Lochmoor Waterway Estates:
20.1% (94)Florida:
7.5% (342,375)
Peru Lochmoor Waterway Estates:
9.0% (42)Florida:
2.1% (96,693)
United Kingdom, excluding England and Scotland Lochmoor Waterway Estates:
7.9% (37)Florida:
0.7% (34,227)
Canada Lochmoor Waterway Estates:
7.3% (34)Florida:
2.4% (109,132)
England Lochmoor Waterway Estates:
6.2% (29)Florida:
0.8% (37,723)
Germany Lochmoor Waterway Estates:
4.3% (20)Florida:
1.2% (54,272)
Portugal Lochmoor Waterway Estates:
4.1% (19)Florida:
0.2% (9,493)
Austria Lochmoor Waterway Estates:
3.2% (15)Florida:
0.1% (3,914)
Turkey Lochmoor Waterway Estates:
3.2% (15)Florida:
0.2% (10,969)
Italy Lochmoor Waterway Estates:
2.8% (13)Florida:
0.7% (30,755)
France Lochmoor Waterway Estates:
2.4% (11)Florida:
0.4% (20,008)
Australia Lochmoor Waterway Estates:
1.7% (8)Florida:
0.1% (5,190)
Place of birth for U.S.-born residents:
This state: 1,628Other state: 3,431Northeast: 1,266Midwest: 1,390South: 465West: 306 90.8% of Lochmoor Waterway Estates residents lived in the same house 1 years ago.
Out of people who lived in different houses, 37.1% lived in this county.
Out of people who lived in different counties, 34.6% lived in Florida.
Lochmoor Waterway Estates:
90.8%State average:
86.3%
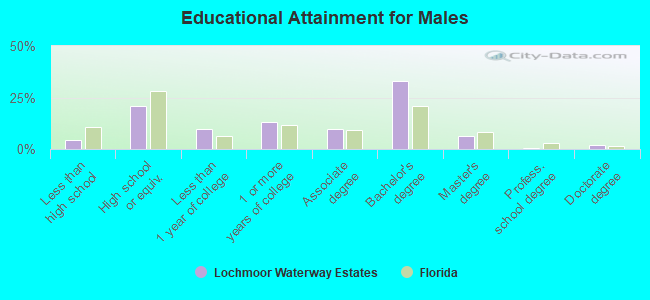
Education attainment for males 25 years and older:
No schooling: 30Nursery to 4th grade: 05th and 6th grade: 07th and 8th grade: 09th grade: 010th grade: 011th grade: 1212th grade, no diploma: 53High school graduate (or equivalency): 443Less than 1 year of college: 202Some college more than 1 year, no degree: 279Associate degree: 205Bachelor's degree: 698Master's degree: 132Professional school degree: 12Doctorate degree: 43
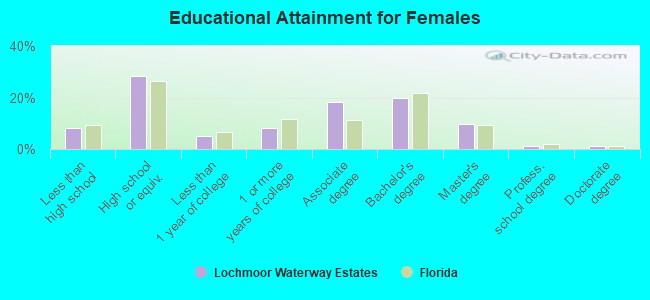
Education attainment for females 25 years and older:
No schooling: 16Nursery to 4th grade: 05th and 6th grade: 157th and 8th grade: 189th grade: 5610th grade: 811th grade: 012th grade, no diploma: 90High school graduate (or equivalency): 708Less than 1 year of college: 129Some college more than 1 year, no degree: 202Associate degree: 458Bachelor's degree: 502Master's degree: 245Professional school degree: 34Doctorate degree: 31
Housing units in structures:
One, detached: 2,129One, attached: 57Two: 773 or 4: 2835 to 9: 33410 to 19: 16320 to 49: 3050 or more: 29Boats, RVs, vans, etc.: 8House/condo owner moved in on average 7 years ago
Renter moved in on average 3 years ago
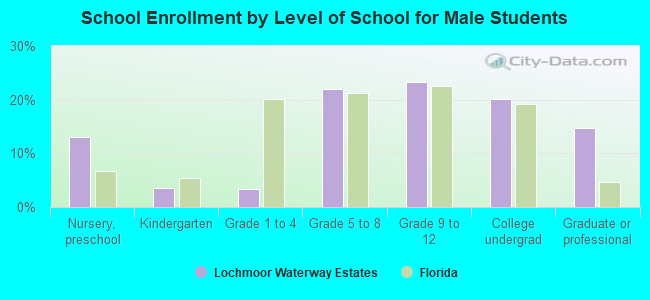
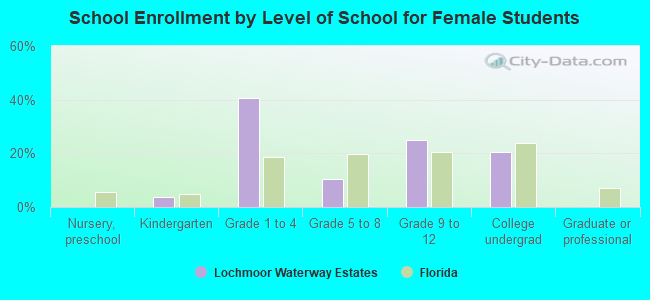
Private vs. public school enrollment:
Students in private schools in grades 1 to 8 (elementary and middle school): 23 Students in private schools in grades 9 to 12 (high school): 0 Students in private undergraduate colleges: 62