Log Lane Village, CO (Colorado) Houses and Residents
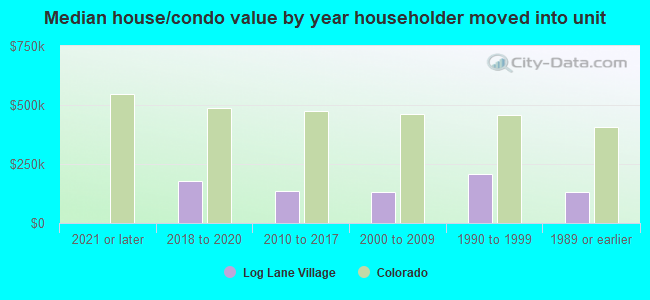
| Log Lane Village: | $165,292 |
| Colorado: | $531,100 |
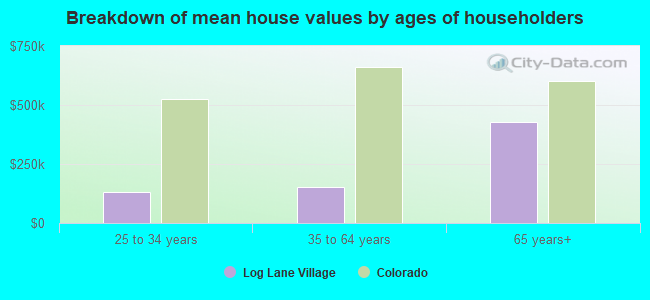
Mean price in 2022:
Detached houses: $209,936
Here: $209,936 State: $676,667 Mobile homes: $116,386
Here: $116,386 State: $115,510
Total population: 872 (All urban)
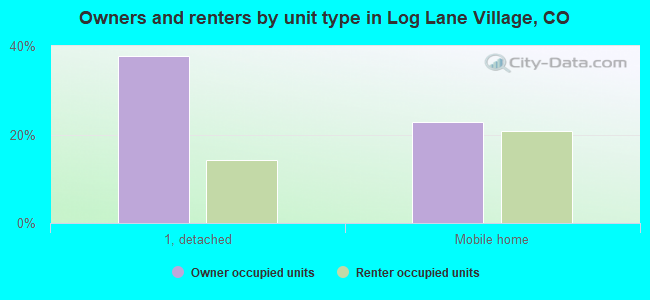
Houses: 307 (290 occupied: 177 owner occupied, 115 renter occupied)
| % of renters here: | 39% |
| State: | 34% |
Housing density: 1,234 houses/condos per square mile
Median price asked for vacant for-sale houses and condos in 2022 in this county: $2,797,097.
Median contract rent in 2022: $719 (lower quartile is $575, upper quartile is $1,027)
Median rent asked for vacant for-rent units in 2022: $741
Median gross rent in Log Lane Village, CO in 2022: $972
Housing units in Log Lane Village with a mortgage: 75 (0 second mortgage, 0 home equity loan, 0 both second mortgage and home equity loan)
Houses without a mortgage: 14
Median household income for houses/condos with a mortgage: $64,812
Median household income for apartments without a mortgage: $46,054
Median monthly housing costs: $787
Compare current foreclosures near Log Lane Village, CO:
| Photo | Address | Area | Beds / Baths | Price | Details |
|---|---|---|---|---|---|

|
#1
Cedar St
Log Lane Village, CO 80705
|
1,006 sq. feet
|
1 baths 2 beds |
show details | |

|
#2
Birch St
Log Lane Village, CO 80705
|
1,932 sq. feet
|
2 baths 3 beds |
show details | |

|
#3
Balsam St
Log Lane Village, CO 80705
|
- sq. feet
|
- baths - beds |
show details | |

|
#4
Diana St
Fort Morgan, CO 80701
|
2,950 sq. feet
|
2 baths 4 beds |
show details | |

|
#5
Williams St
Brush, CO 80723
|
1,250 sq. feet
|
2 baths 4 beds |
show details | |

|
#6
Colorado Ave
Brush, CO 80723
|
1,508 sq. feet
|
1 baths 3 beds |
show details | |

|
#7
W Beaver Ave
Fort Morgan, CO 80701
|
1,630 sq. feet
|
1 baths 3 beds |
show details | |

|
#8
Lincoln St
Brush, CO 80723
|
1,883 sq. feet
|
2 baths 3 beds |
show details | |

|
#9
Edmunds St
Brush, CO 80723
|
1,105 sq. feet
|
1 baths 2 beds |
show details | |

|
#10
Western Ave
Brush, CO 80723
|
1,334 sq. feet
|
2 baths 4 beds |
show details |
| Photo | Address | Area | Beds / Baths | Price | Details |
|---|---|---|---|---|---|

|
#11
County Road U
Wiggins, CO 80654
|
1,568 sq. feet
|
2 baths 3 beds |
show details | |

|
#12
Christensen Ct
Brush, CO 80723
|
1,560 sq. feet
|
2 baths 2 beds |
show details | |

|
#13
County Road 15
Weldona, CO 80653
|
1,836 sq. feet
|
2 baths 3 beds |
show details | |

|
#14
Colorado Ave
Brush, CO 80723
|
1,508 sq. feet
|
1 baths 3 beds |
show details | |

|
#15
Michael Ave
Fort Morgan, CO 80701
|
1,960 sq. feet
|
2 baths 4 beds |
show details | |

|
#16
S Lake St
Fort Morgan, CO 80701
|
1,848 sq. feet
|
1 baths 4 beds |
show details | |

|
#17
County Road R
Fort Morgan, CO 80701
|
2,900 sq. feet
|
3 baths 5 beds |
show details | |

|
#18
Cheyenne St
Fort Morgan, CO 80701
|
3,177 sq. feet
|
2 baths 3 beds |
show details | |

|
#19
Carson St
Brush, CO 80723
|
1,298 sq. feet
|
1 baths 4 beds |
show details | |

|
#20
Clifton St
Brush, CO 80723
|
1,570 sq. feet
|
1 baths 3 beds |
show details |
| Photo | Address | Area | Beds / Baths | Price | Details |
|---|---|---|---|---|---|

|
#21
Lincoln St
Fort Morgan, CO 80701
|
1,352 sq. feet
|
2 baths 2 beds |
show details | |

|
#22
Meeker St
Fort Morgan, CO 80701
|
3,282 sq. feet
|
3 baths 4 beds |
show details | |

|
#23
West St
Fort Morgan, CO 80701
|
1,066 sq. feet
|
1 baths 2 beds |
show details | |

|
#24
W 6th Ave
Fort Morgan, CO 80701
|
1,620 sq. feet
|
2 baths 3 beds |
show details | |

|
#25
Maple St
Fort Morgan, CO 80701
|
2,529 sq. feet
|
3 baths 5 beds |
show details | |

|
#26
County Road R.6
Brush, CO 80723
|
1,824 sq. feet
|
1 baths 3 beds |
show details | |

|
#27
Park St
Fort Morgan, CO 80701
|
2,648 sq. feet
|
2 baths 4 beds |
show details | |

|
#28
Lane St
Fort Morgan, CO 80701
|
3,533 sq. feet
|
2 baths 3 beds |
show details | |

|
#29
County Road 185
Fort Morgan, CO 80701
|
768 sq. feet
|
1 baths 2 beds |
show details | |

|
#30
Lincoln St
Brush, CO 80723
|
1,343 sq. feet
|
1 baths 2 beds |
show details |
| Photo | Address | Area | Beds / Baths | Price | Details |
|---|---|---|---|---|---|

|
#31
Highway 144
Weldona, CO 80653
|
- sq. feet
|
- baths - beds |
show details | |

|
#32
County Rd S
Fort Morgan, CO 80701
|
- sq. feet
|
- baths - beds |
show details | |

|
#33
Industrial Park Rd
Brush, CO 80723
|
- sq. feet
|
- baths - beds |
show details | |

|
#34
Bob Blvd Lot 10
Brush, CO 80723
|
- sq. feet
|
- baths - beds |
show details | |

|
#35
Us Highway 34, Spc 40
Fort Morgan, CO 80701
|
- sq. feet
|
- baths - beds |
show details | |

|
#36
W Brush Ave
Fort Morgan, CO 80701
|
- sq. feet
|
- baths - beds |
show details | |

|
#37
Ensign St
Fort Morgan, CO 80701
|
- sq. feet
|
- baths - beds |
show details | |

|
#38
Deuel St
Fort Morgan, CO 80701
|
- sq. feet
|
- baths - beds |
show details | |

|
#39
Wildcat Pkwy
Wiggins, CO 80654
|
- sq. feet
|
- baths - beds |
show details | |

|
Check over 1 million property listings on Foreclosure.com!
|
browse all offers | |||


Median year apartment built: 1977
Household type by relationship:
Households: 817- Male householders: 129 (50 living alone), Female householders: 153 (10 living alone)
132 spouses (132 opposite-sex spouses), 31 unmarried partners, (31 opposite-sex unmarried partners), 211 children (184 natural, 18 adopted, 9 stepchildren), 57 grandchildren, 29 brothers or sisters, 22 parents, 0 foster children, 25 other relatives, 24 non-relatives
Size of family households: 83 2-persons, 29 3-persons, 39 4-persons, 28 5-persons, 2 6-persons, 19 7-or-more-persons.
Size of nonfamily households: 63 1-person, 21 2-persons, 2 4-persons.
90 married couples with children.
46 single-parent households (14 men, 32 women).
67.3% of residents of Log Lane Village speak English at home.
30.9% of residents speak Spanish at home (50% speak English very well, 21% speak English well, 14% speak English not well, 15% don't speak English at all).
0.3% of residents speak other Indo-European language at home (100% speak English very well).
0.9% of residents speak Asian or Pacific Island language at home (100% speak English very well).
Foreign born population: 121 (14.8%)
(46.3% of them are naturalized citizens)
| Here: | 5.8 |
| State: | 6.8 |
| Here: | 4.8 |
| State: | 4.0 |
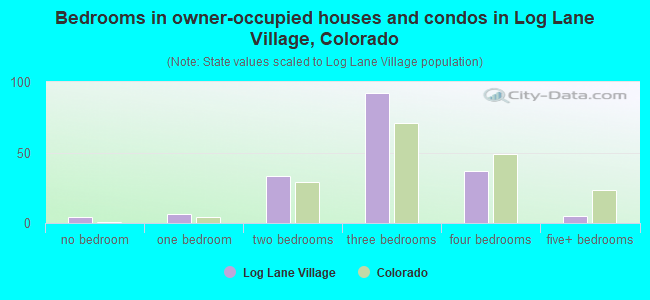
- Bedrooms in owner-occupied houses and condos in Log Lane Village, Colorado
- 4no bedroom
- 61 bedroom
- 332 bedrooms
- 923 bedrooms
- 374 bedrooms
- 55+ bedrooms
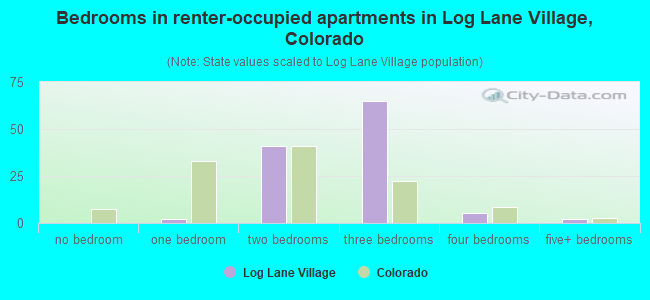
- Bedrooms in renter-occupied apartments in Log Lane Village, Colorado
- 0no bedroom
- 21 bedroom
- 412 bedrooms
- 653 bedrooms
- 54 bedrooms
- 25+ bedrooms
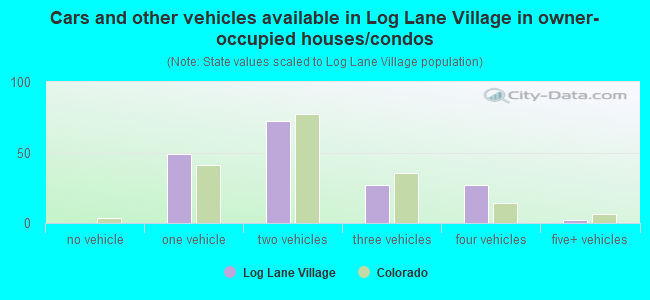
- Cars and other vehicles available in Log Lane Village in owner-occupied houses/condos
- 0no vehicle
- 491 vehicle
- 722 vehicles
- 273 vehicles
- 274 vehicles
- 25+ vehicles
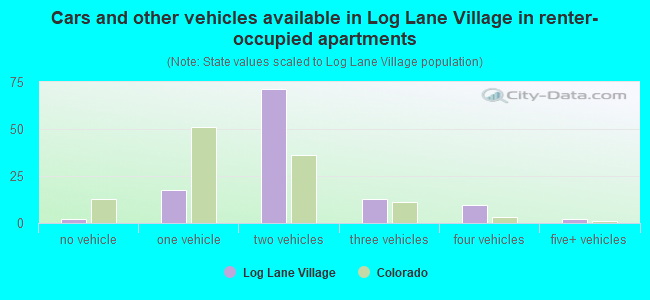
- Cars and other vehicles available in Log Lane Village in renter-occupied apartments
- 2no vehicle
- 181 vehicle
- 712 vehicles
- 133 vehicles
- 94 vehicles
- 25+ vehicles
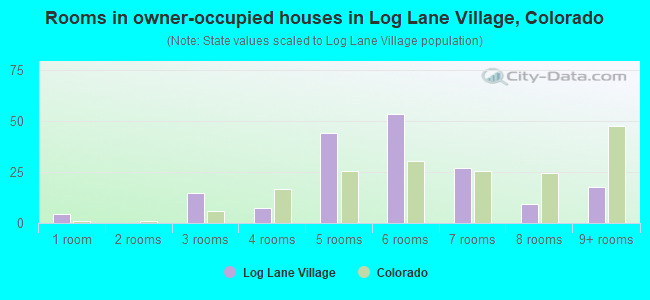
- Rooms in owner-occupied houses in Log Lane Village, Colorado
- 41 room
- 02 rooms
- 153 rooms
- 74 rooms
- 445 rooms
- 536 rooms
- 277 rooms
- 98 rooms
- 189+ rooms
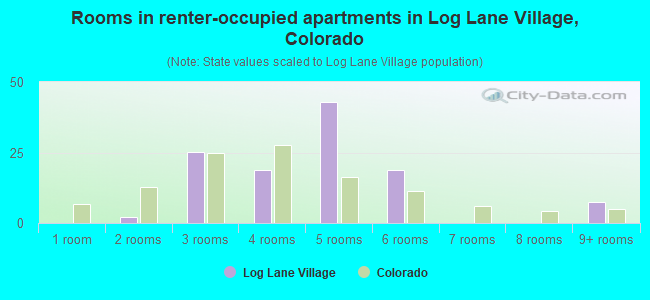
- Rooms in renter-occupied apartments in Log Lane Village, Colorado
- 01 room
- 22 rooms
- 253 rooms
- 194 rooms
- 435 rooms
- 196 rooms
- 07 rooms
- 08 rooms
- 79+ rooms
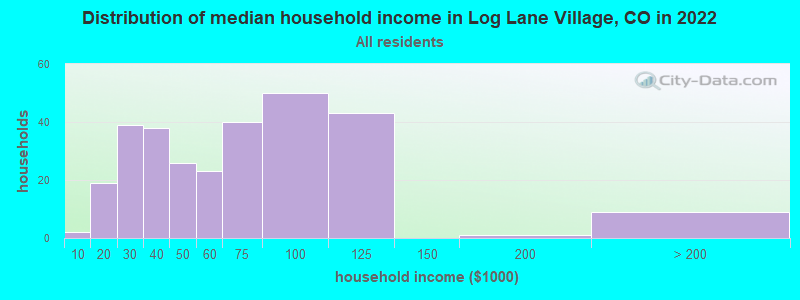
Log Lane Village, CO household income distribution

- 2Less than $10,000
- 19$10,000 to $19,999
- 39$20,000 to $29,999
- 38$30,000 to $39,999
- 26$40,000 to $49,999
- 23$50,000 to $59,999
- 40$60,000 to $74,999
- 50$75,000 to $99,999
- 43$100,000 to $124,999
- 1$150,000 to $199,999
- 9$200,000 or more
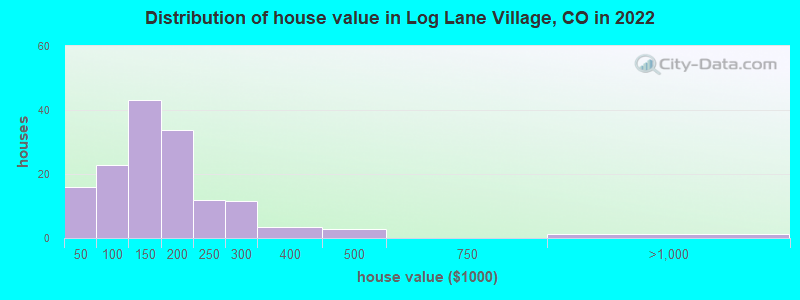
Home value of owner - occupied houses in 2022 in Log Lane Village, CO
-
- 13Less than $10,000
- 2$40,000 to $49,999
- 8$60,000 to $69,999
- 4$80,000 to $89,999
- 7$90,000 to $99,999
- 38$100,000 to $124,999
- 4$125,000 to $149,999
- 25$150,000 to $174,999
- 8$175,000 to $199,999
- 11$200,000 to $249,999
- 11$250,000 to $299,999
- 3$300,000 to $399,999
- 2$400,000 to $499,999
- 1$750,000 to $999,999
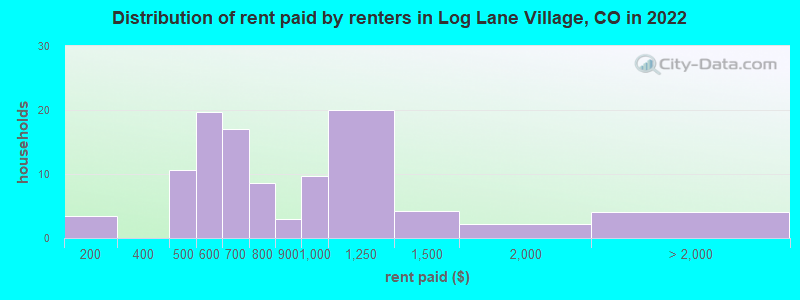
Rent paid by renters in 2022 in Log Lane Village, CO
-
- 3$100 to $149
- 10$450 to $499
- 14$500 to $549
- 5$550 to $599
- 6$600 to $649
- 10$650 to $699
- 8$700 to $749
- 3$800 to $899
- 9$900 to $999
- 20$1,000 to $1,249
- 4$1,250 to $1,499
- 2$1,500 to $1,999
- 4No cash rent
Percentage of workers working in this county: 86.8%
Number of people working at home: 27 (6.7% of all workers)
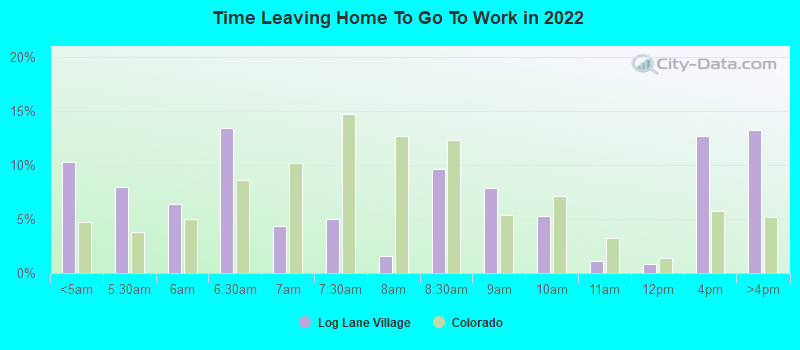
Travel time to work (commute)
- Less than 5 minutes: 12
- 5 to 9 minutes: 107
- 10 to 14 minutes: 82
- 15 to 19 minutes: 70
- 20 to 24 minutes: 2
- 25 to 29 minutes: 2
- 30 to 34 minutes: 0
- 35 to 39 minutes: 0
- 40 to 44 minutes: 0
- 45 to 59 minutes: 15
- 60 to 89 minutes: 54
- 90 or more minutes: 11
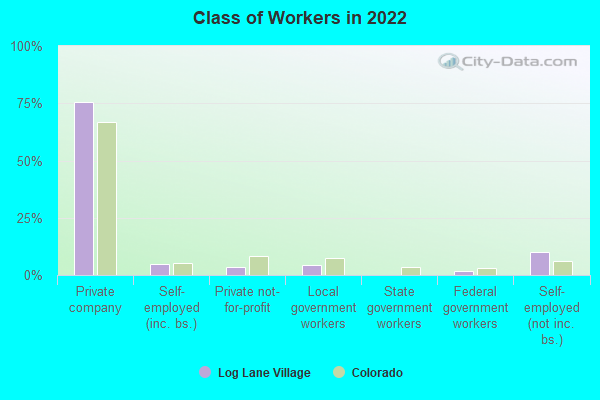
Means of transportation to work:
- Drove a car alone: 260 (68.6%)
- Carpooled: 107 (28.2%)
- Walked: 4 (1.1%)
- Other means: 2 (0.5%)
- Worked at home: 6 (1.6%)
- Unemployment by race in 2022
- Unemployment rate for White non-Hispanic residents
- 7.4%Males
- 8.2%Females
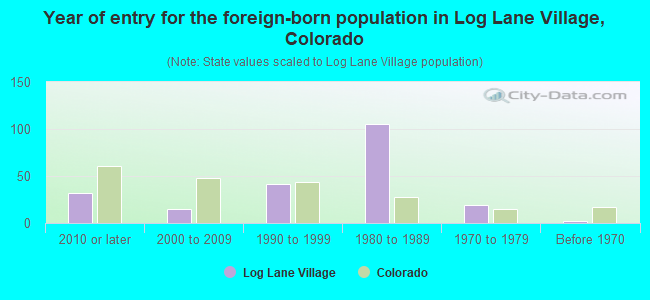
- Year of entry for the foreign-born population in Log Lane Village, Colorado
- 322010 or later
- 152000 to 2009
- 411990 to 1999
- 1051980 to 1989
- 191970 to 1979
- 2Before 1970
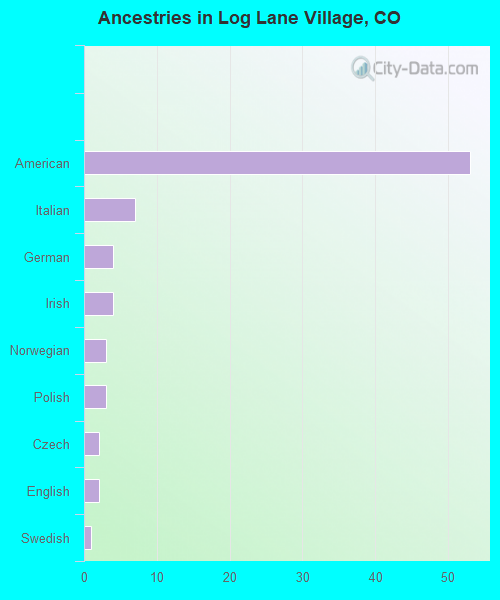
First ancestries reported:
- American: 53 (14.2%)
- Italian: 7 (1.9%)
- German: 4 (1.1%)
- Irish: 4 (1.1%)
- Norwegian: 3 (0.8%)
- Polish: 3 (0.8%)
- Czech: 2 (0.5%)
- English: 2 (0.5%)
- Swedish: 1 (0.3%)
Most common places of birth for foreign-born residents (%):
| Log Lane Village: | 87.6% (106) |
| Colorado: | 38.3% (209,491) |
| Log Lane Village: | 7.4% (9) |
| Colorado: | 1.4% (7,898) |
| Log Lane Village: | 3.3% (4) |
| Colorado: | 0.7% (4,075) |
Place of birth for U.S.-born residents:
- This state: 446
- Other state: 240
- Northeast: 10
- Midwest: 54
- South: 79
- West: 95
88.3% of Log Lane Village residents lived in the same house 1 years ago.
Out of people who lived in different houses, 29.3% lived in this county.
Out of people who lived in different counties, 55.6% lived in Colorado.
| Log Lane Village: | 88.3% |
| State average: | 83.6% |
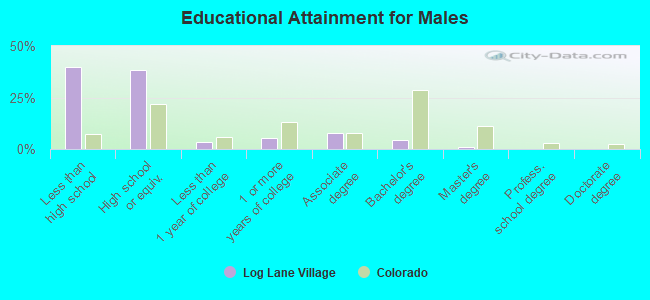
Education attainment for males 25 years and older:
- No schooling: 12
- Nursery to 4th grade: 7
- 5th and 6th grade: 11
- 7th and 8th grade: 14
- 9th grade: 11
- 10th grade: 14
- 11th grade: 1
- 12th grade, no diploma: 6
- High school graduate (or equivalency): 73
- Less than 1 year of college: 6
- Some college more than 1 year, no degree: 10
- Associate degree: 15
- Bachelor's degree: 8
- Master's degree: 2
- Professional school degree: 0
- Doctorate degree: 0
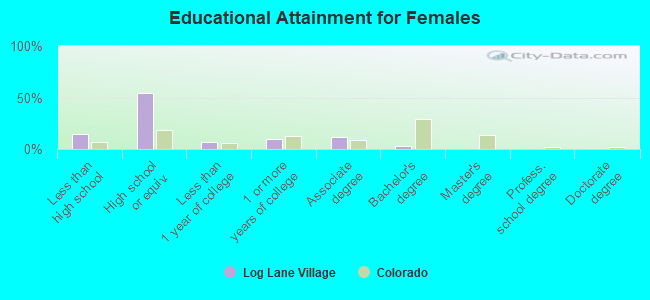
Education attainment for females 25 years and older:
- No schooling: 2
- Nursery to 4th grade: 0
- 5th and 6th grade: 1
- 7th and 8th grade: 12
- 9th grade: 11
- 10th grade: 3
- 11th grade: 2
- 12th grade, no diploma: 0
- High school graduate (or equivalency): 118
- Less than 1 year of college: 14
- Some college more than 1 year, no degree: 22
- Associate degree: 26
- Bachelor's degree: 6
- Master's degree: 0
- Professional school degree: 0
- Doctorate degree: 0


Housing units in structures:
- One, detached: 169
- Two: 2
- 50 or more: 2
- Mobile homes: 133
Median worth of mobile homes: $127,961
Housing units lacking complete kitchen facilities in 2022: 2.7%
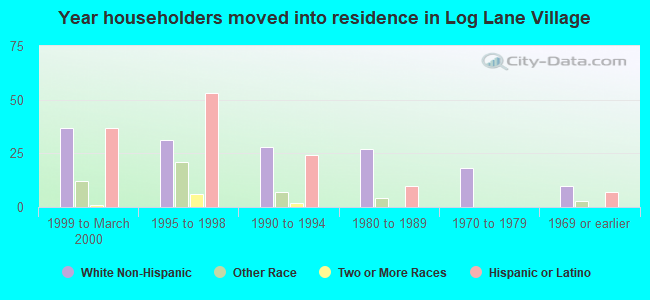
House/condo owner moved in on average 13 years ago
Renter moved in on average 6 years ago
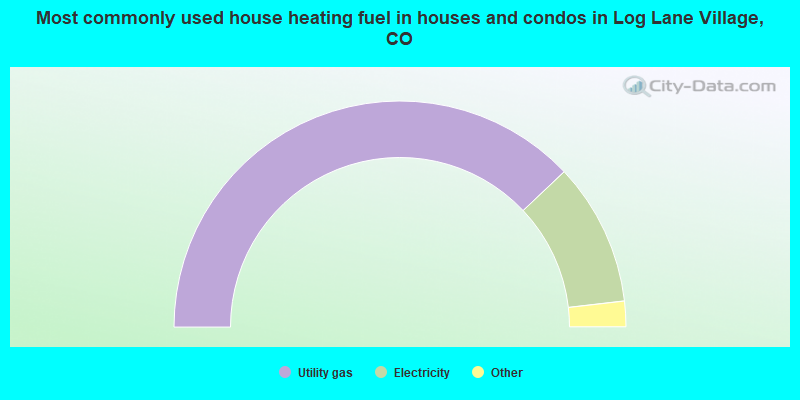
- 76.5%Utility gas
- 20.6%Electricity
- 1.8%Wood
- 1.2%Bottled, tank, or LP gas
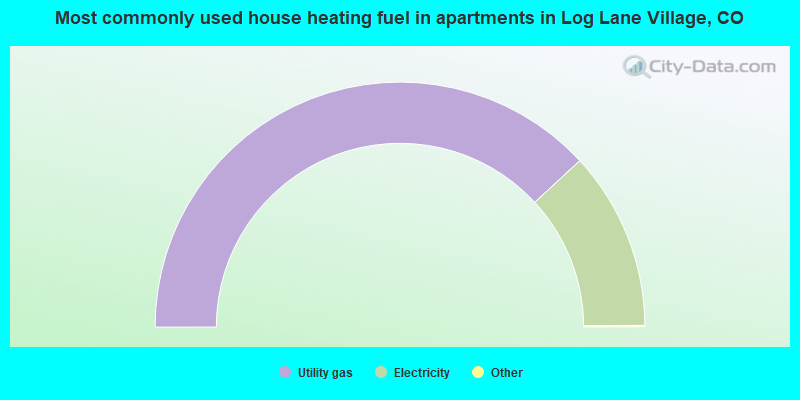
- 76.4%Utility gas
- 23.6%Electricity
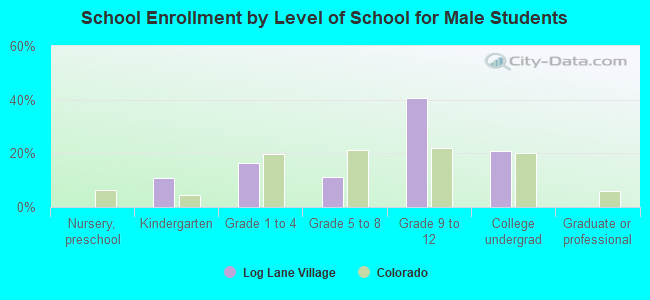
Private vs. public school enrollment:
| Here: | 0.0% |
| Colorado: | 11.4% |
| Here: | 0.0% |
| Colorado: | 8.5% |
| Here: | 36.8% |
| Colorado: | 14.0% |