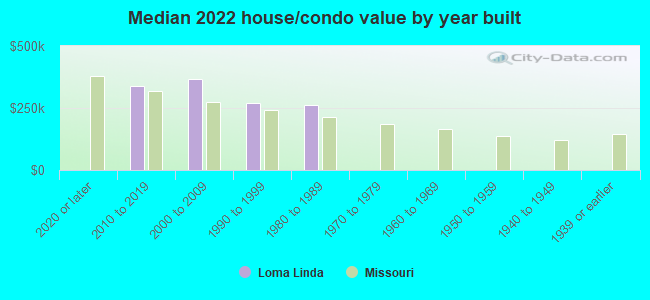
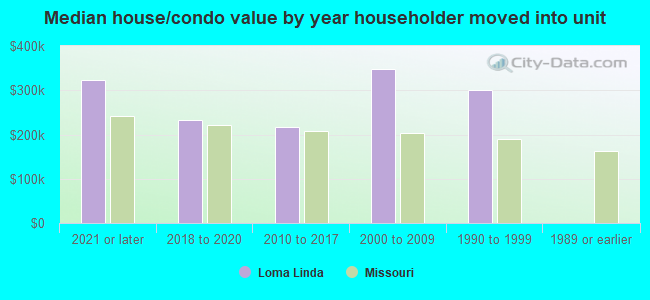
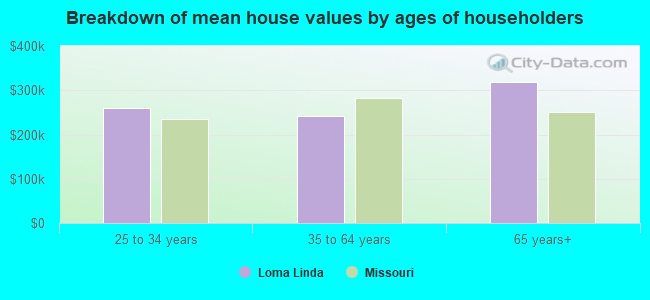
Loma Linda, MO (Missouri) Houses and Residents
| Loma Linda: | $265,462 |
| Missouri: | $221,200 |
Total population: 764 (Urban population: 0, Rural population: 522 (2 farm, 520 nonfarm))
Houses: 510 (437 occupied: 355 owner occupied, 88 renter occupied)
| % of renters here: | 20% |
| State: | 32% |
Housing density: 142 houses/condos per square mile
Median price asked for vacant for-sale houses and condos in 2022 in this county: $140,021.
Median contract rent in 2022: $695 (lower quartile is $564, upper quartile is $780)
Median rent asked for vacant for-rent units in 2022: $799
Median gross rent in Loma Linda, MO in 2022: $815
Housing units in Loma Linda with a mortgage: 168 (8 second mortgage, 0 home equity loan, 6 both second mortgage and home equity loan)
Houses without a mortgage: 0
Median household income for houses/condos with a mortgage: $109,212
Median household income for apartments without a mortgage: $87,798
Median monthly housing costs: $866
Compare current foreclosures near Loma Linda, MO:
| Photo | Address | Area | Beds / Baths | Price | Details |
|---|---|---|---|---|---|

|
#1
N Grant St
Oronogo, MO 64855
|
1,288 sq. feet
|
1 baths 3 beds |
$69,500
|
show details |

|
#2
Grand Ave
Joplin, MO 64804
|
1,545 sq. feet
|
2 baths 3 beds |
show details | |

|
#3
Oak St
North Miami, OK 74358
|
896 sq. feet
|
1 baths 2 beds |
show details | |

|
#4
E 9th St
Joplin, MO 64801
|
1,354 sq. feet
|
1 baths 3 beds |
show details | |

|
#5
H St NE
Miami, OK 74354
|
1,324 sq. feet
|
1 baths 3 beds |
show details | |

|
#6
E 120 Rd
Wyandotte, OK 74370
|
1,655 sq. feet
|
2 baths 7 beds |
show details | |

|
#7
S Maple St
Carterville, MO 64835
|
- sq. feet
|
1 baths 3 beds |
show details | |

|
#8
E 160 Rd
Wyandotte, OK 74370
|
1,543 sq. feet
|
1 baths 3 beds |
show details | |

|
#9
W 1st St
Baxter Springs, KS 66713
|
1,144 sq. feet
|
1 baths 3 beds |
show details | |

|
#10
SE 70th St
Riverton, KS 66770
|
1,152 sq. feet
|
1 baths 3 beds |
show details |
| Photo | Address | Area | Beds / Baths | Price | Details |
|---|---|---|---|---|---|

|
#11
W 30th St
Baxter Springs, KS 66713
|
1,862 sq. feet
|
1 baths 3 beds |
show details | |

|
#12
Oak St
Wyandotte, OK 74370
|
748 sq. feet
|
1 baths 2 beds |
show details | |

|
#13
Southridge
Baxter Springs, KS 66713
|
1,630 sq. feet
|
2 baths 3 beds |
show details | |

|
#14
N Elm
Wyandotte, OK 74370
|
2,202 sq. feet
|
2 baths 4 beds |
show details | |

|
#15
Hillcrest Dr
Galena, KS 66739
|
1,452 sq. feet
|
2 baths 3 beds |
show details | |

|
#16
S Highway 137
Miami, OK 74354
|
1,917 sq. feet
|
1 baths 5 beds |
show details | |

|
#17
N Elm St
Miami, OK 74354
|
1,366 sq. feet
|
2 baths 3 beds |
show details | |

|
#18
15th Ave NE
Miami, OK 74354
|
1,971 sq. feet
|
2 baths 4 beds |
show details | |

|
#19
NE 100th St
Weir, KS 66781
|
3,543 sq. feet
|
3 baths 5 beds |
show details | |

|
#20
W 17th St
Galena, KS 66739
|
1,222 sq. feet
|
2 baths 3 beds |
show details |
| Photo | Address | Area | Beds / Baths | Price | Details |
|---|---|---|---|---|---|

|
#21
15th Ave NE
Miami, OK 74354
|
1,757 sq. feet
|
2 baths 3 beds |
show details | |

|
#22
Camelot Pl
Miami, OK 74354
|
2,091 sq. feet
|
1 baths 4 beds |
show details | |

|
#23
N Elm St Apt 48
Miami, OK 74354
|
- sq. feet
|
- baths - beds |
show details | |

|
#24
Elm Ct
Webb City, MO 64870
|
- sq. feet
|
- baths - beds |
show details | |

|
#25
E Glenview Pl
Neosho, MO 64850
|
640 sq. feet
|
- baths - beds |
show details | |

|
#26
Matthew Cir
Webb City, MO 64870
|
- sq. feet
|
- baths - beds |
show details | |

|
#27
Nicholas Ln
Carl Junction, MO 64834
|
- sq. feet
|
- baths - beds |
show details | |

|
#28
Monroe Cir
Carl Junction, MO 64834
|
- sq. feet
|
- baths - beds |
show details | |

|
#29
Cherry St Apt A
Carl Junction, MO 64834
|
- sq. feet
|
- baths - beds |
show details | |

|
#30
Prospect St
Webb City, MO 64870
|
- sq. feet
|
- baths - beds |
show details |
| Photo | Address | Area | Beds / Baths | Price | Details |
|---|---|---|---|---|---|

|
#31
S Roney St
Carl Junction, MO 64834
|
- sq. feet
|
- baths - beds |
show details | |

|
#32
W Burch St
Carterville, MO 64835
|
- sq. feet
|
- baths - beds |
show details | |

|
#33
W 8th St
Webb City, MO 64870
|
- sq. feet
|
- baths - beds |
show details | |

|
#34
Wolfe Dr
Duenweg, MO 64841
|
- sq. feet
|
- baths - beds |
show details | |

|
#35
Thurman St
Diamond, MO 64840
|
1,124 sq. feet
|
- baths - beds |
show details | |

|
#36
Falcon Rd
Neosho, MO 64850
|
1,344 sq. feet
|
- baths - beds |
show details | |

|
#37
Alex Jordan Dr
Duenweg, MO 64841
|
- sq. feet
|
- baths - beds |
show details | |

|
#38
S Oronogo St Apt 2d
Webb City, MO 64870
|
- sq. feet
|
- baths - beds |
show details | |

|
#39
Redbud Rd
Seneca, MO 64865
|
- sq. feet
|
- baths - beds |
show details | |

|
#40
Otter Dr
Neosho, MO 64850
|
- sq. feet
|
- baths - beds |
show details |
| Photo | Address | Area | Beds / Baths | Price | Details |
|---|---|---|---|---|---|

|
#41
Angus Dr
Seneca, MO 64865
|
3,965 sq. feet
|
- baths - beds |
show details | |

|
#42
S High St
Neosho, MO 64850
|
744 sq. feet
|
- baths - beds |
show details | |

|
#43
Pearl St
Neosho, MO 64850
|
- sq. feet
|
- baths - beds |
show details | |

|
#44
Hamilton St
Neosho, MO 64850
|
1,121 sq. feet
|
- baths - beds |
show details | |

|
#45
E South St
Neosho, MO 64850
|
504 sq. feet
|
- baths - beds |
show details | |

|
#46
Finney Ave
Neosho, MO 64850
|
- sq. feet
|
- baths - beds |
show details | |

|
#47
Gold Dust Dr Apt B
Webb City, MO 64870
|
- sq. feet
|
- baths - beds |
show details | |

|
#48
S Ripley St
Neosho, MO 64850
|
908 sq. feet
|
- baths - beds |
show details | |

|
#49
S Mickey Mantle Blvd
Commerce, OK 74339
|
- sq. feet
|
- baths - beds |
show details | |

|
Check over 1 million property listings on Foreclosure.com!
|
browse all offers | |||


 | Which Is Better? Joplin Or Springfield (91 replies) |
Median year apartment built: 1987
Household type by relationship:
Households: 989- Male householders: 301 (61 living alone), Female householders: 133 (40 living alone)
234 spouses (234 opposite-sex spouses), 17 unmarried partners, (16 opposite-sex unmarried partners), 241 children (235 natural, 2 adopted, 4 stepchildren), 40 grandchildren, 2 brothers or sisters, 5 parents, 0 foster children, 8 other relatives, 6 non-relatives
Size of family households: 166 2-persons, 90 3-persons, 45 4-persons, 11 5-persons, 3 7-or-more-persons.
Size of nonfamily households: 104 1-person, 20 2-persons.
95 married couples with children.
17 single-parent households (11 men, 6 women).
98.4% of residents of Loma Linda speak English at home.
0.9% of residents speak Spanish at home (100% speak English very well).
0.4% of residents speak other Indo-European language at home (100% speak English very well).
0.2% of residents speak other language at home (100% speak English very well).
Foreign born population: 21 (2.1%)
(90.5% of them are naturalized citizens)
| Here: | 6.4 |
| State: | 6.4 |
| Here: | 3.4 |
| State: | 4.4 |
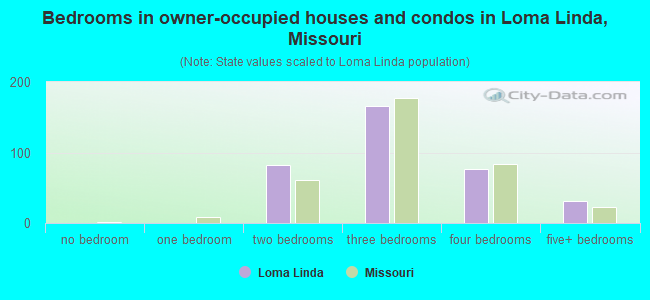
- Bedrooms in owner-occupied houses and condos in Loma Linda, Missouri
- 0no bedroom
- 01 bedroom
- 822 bedrooms
- 1663 bedrooms
- 774 bedrooms
- 315+ bedrooms
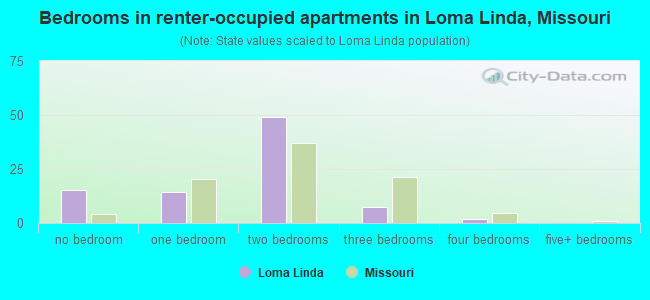
- Bedrooms in renter-occupied apartments in Loma Linda, Missouri
- 15no bedroom
- 141 bedroom
- 492 bedrooms
- 73 bedrooms
- 24 bedrooms
- 05+ bedrooms
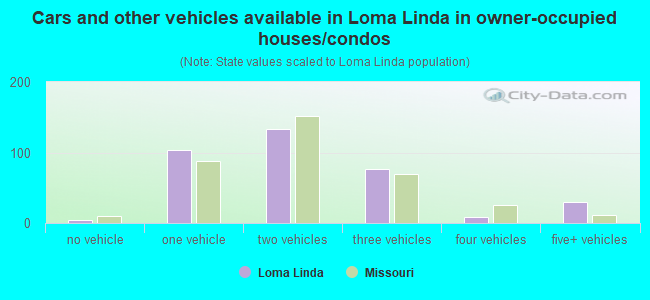
- Cars and other vehicles available in Loma Linda in owner-occupied houses/condos
- 4no vehicle
- 1031 vehicle
- 1342 vehicles
- 773 vehicles
- 84 vehicles
- 305+ vehicles
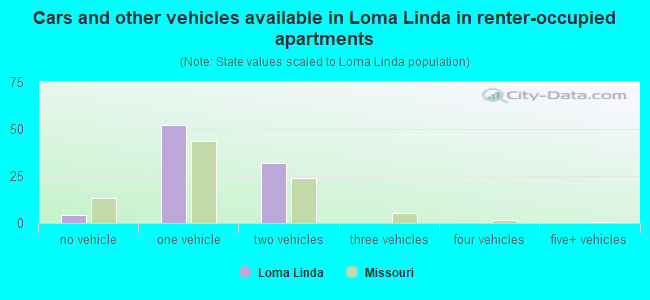
- Cars and other vehicles available in Loma Linda in renter-occupied apartments
- 4no vehicle
- 521 vehicle
- 322 vehicles
- 03 vehicles
- 04 vehicles
- 05+ vehicles
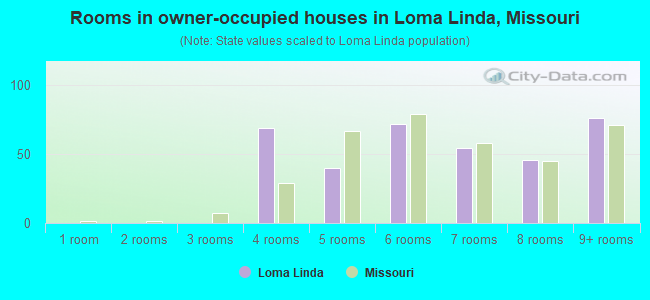
- Rooms in owner-occupied houses in Loma Linda, Missouri
- 01 room
- 02 rooms
- 03 rooms
- 694 rooms
- 405 rooms
- 726 rooms
- 547 rooms
- 458 rooms
- 769+ rooms
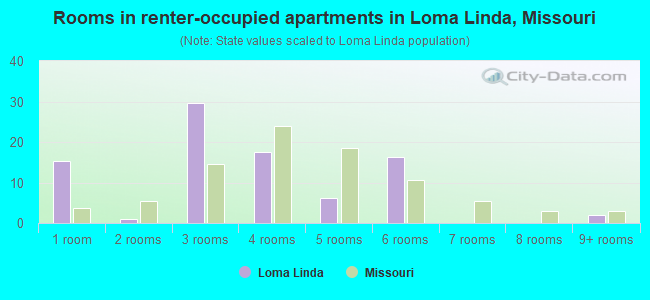
- Rooms in renter-occupied apartments in Loma Linda, Missouri
- 151 room
- 12 rooms
- 303 rooms
- 174 rooms
- 65 rooms
- 166 rooms
- 07 rooms
- 08 rooms
- 29+ rooms
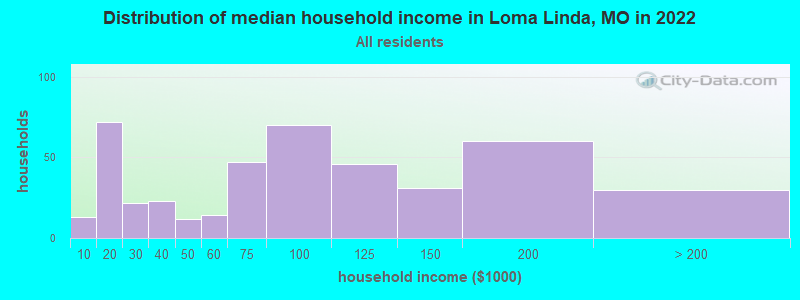
Loma Linda, MO household income distribution

- 13Less than $10,000
- 72$10,000 to $19,999
- 22$20,000 to $29,999
- 23$30,000 to $39,999
- 12$40,000 to $49,999
- 14$50,000 to $59,999
- 47$60,000 to $74,999
- 70$75,000 to $99,999
- 46$100,000 to $124,999
- 31$125,000 to $149,999
- 60$150,000 to $199,999
- 30$200,000 or more
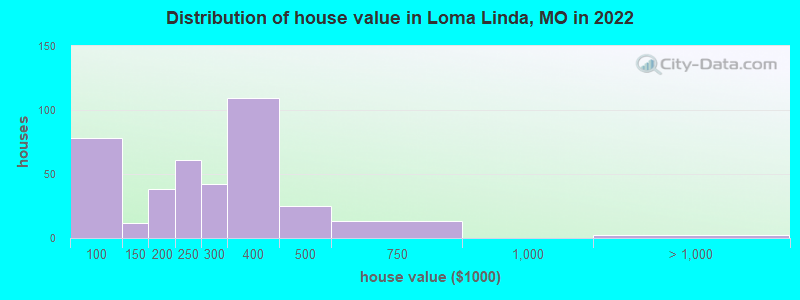
Home value of owner - occupied houses in 2022 in Loma Linda, MO
-
- 0$50,000 to $59,999
- 66$60,000 to $69,999
- 10$70,000 to $79,999
- 3$100,000 to $124,999
- 8$125,000 to $149,999
- 13$150,000 to $174,999
- 24$175,000 to $199,999
- 60$200,000 to $249,999
- 41$250,000 to $299,999
- 108$300,000 to $399,999
- 24$400,000 to $499,999
- 13$500,000 to $749,999
- 2$1,000,000 to $1,499,999
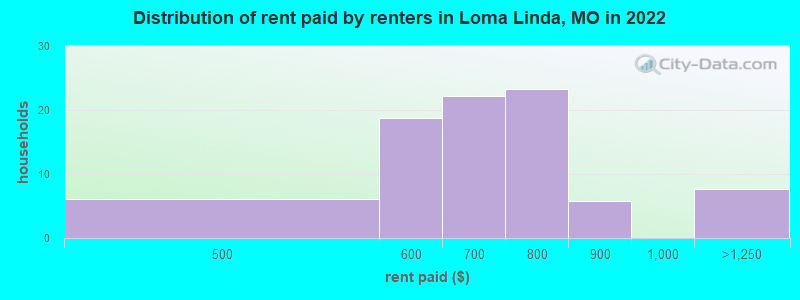
Rent paid by renters in 2022 in Loma Linda, MO
-
- 6$450 to $499
- 12$500 to $549
- 6$550 to $599
- 6$600 to $649
- 15$650 to $699
- 19$700 to $749
- 3$750 to $799
- 5$800 to $899
- 7$1,000 to $1,249
Percentage of workers working in this county: 48.0%
Number of people working at home: 35 (6.5% of all workers)
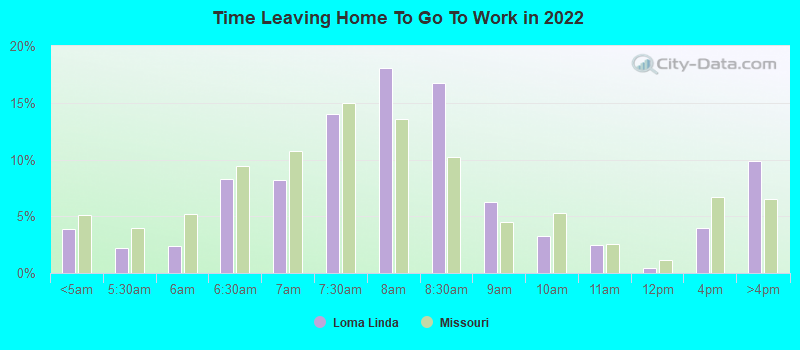
Travel time to work (commute)
- Less than 5 minutes: 14
- 5 to 9 minutes: 17
- 10 to 14 minutes: 57
- 15 to 19 minutes: 73
- 20 to 24 minutes: 137
- 25 to 29 minutes: 54
- 30 to 34 minutes: 96
- 35 to 39 minutes: 2
- 40 to 44 minutes: 4
- 45 to 59 minutes: 9
- 60 to 89 minutes: 14
- 90 or more minutes: 6
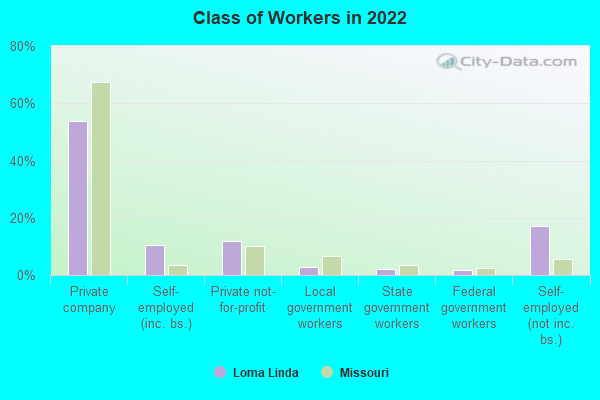
Means of transportation to work:
- Drove a car alone: 226 (83.4%)
- Carpooled: 17 (6.3%)
- Subway or elevated: 2 (0.7%)
- Walked: 2 (0.7%)
- Other means: 8 (3.0%)
- Worked at home: 16 (5.9%)
- Unemployment by race in 2022
- Unemployment rate for White non-Hispanic residents
- 2.0%Males
- 1.2%Females
- Unemployment rate for American Indian and Alaska Native residents
- 13.6%Females
- Unemployment rate for two or more race residents
- 13.7%Males
- Unemployment rate for Hispanic or Latino residents
- 27.6%Males
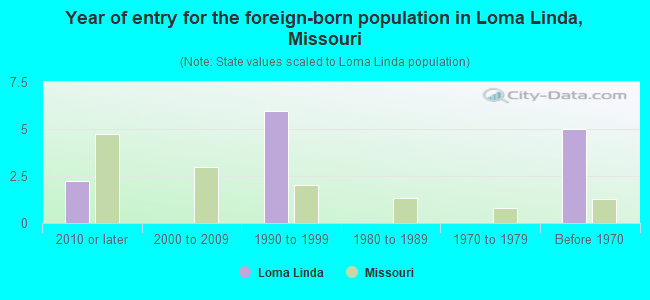
- Year of entry for the foreign-born population in Loma Linda, Missouri
- 22010 or later
- 02000 to 2009
- 61990 to 1999
- 01980 to 1989
- 01970 to 1979
- 5Before 1970
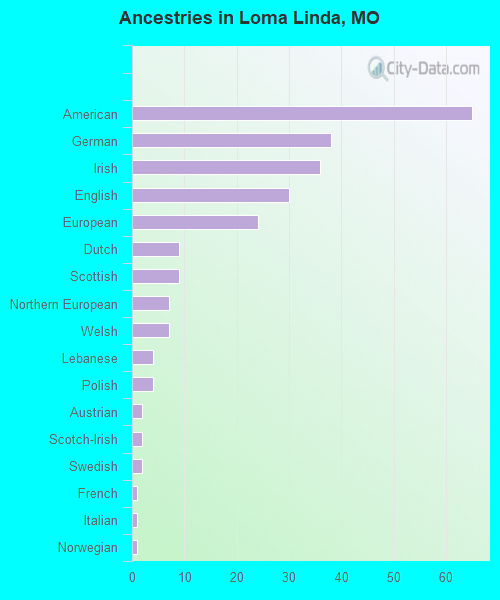
First ancestries reported:
- American: 65 (14.2%)
- German: 38 (8.3%)
- Irish: 36 (7.9%)
- English: 30 (6.6%)
- European: 24 (5.3%)
- Dutch: 9 (2.0%)
- Scottish: 9 (2.0%)
- Northern European: 7 (1.5%)
- Welsh: 7 (1.5%)
- Lebanese: 4 (0.9%)
- Polish: 4 (0.9%)
- Austrian: 2 (0.4%)
- Scotch-Irish: 2 (0.4%)
- Swedish: 2 (0.4%)
- French: 1 (0.2%)
- Italian: 1 (0.2%)
- Norwegian: 1 (0.2%)
Most common places of birth for foreign-born residents (%):
| Loma Linda: | 57.1% (12) |
| Missouri: | 14.9% (38,568) |
| Loma Linda: | 14.3% (3) |
| Missouri: | 3.0% (7,803) |
| Loma Linda: | 9.5% (2) |
| Missouri: | 8.9% (22,932) |
| Loma Linda: | 4.8% (1) |
| Missouri: | 0.8% (2,138) |
| Loma Linda: | 4.8% (1) |
| Missouri: | 0.5% (1,253) |
Place of birth for U.S.-born residents:
- This state: 517
- Other state: 444
- Northeast: 34
- Midwest: 187
- South: 168
- West: 52
89.2% of Loma Linda residents lived in the same house 1 years ago.
Out of people who lived in different houses, 26.0% lived in this county.
Out of people who lived in different counties, 49.2% lived in Missouri.
| Loma Linda: | 89.2% |
| State average: | 87.1% |
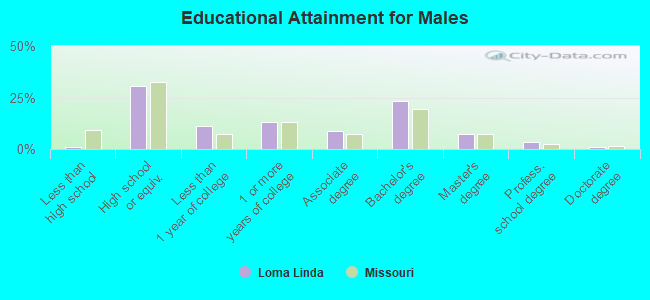
Education attainment for males 25 years and older:
- No schooling: 0
- Nursery to 4th grade: 0
- 5th and 6th grade: 0
- 7th and 8th grade: 0
- 9th grade: 0
- 10th grade: 0
- 11th grade: 1
- 12th grade, no diploma: 2
- High school graduate (or equivalency): 122
- Less than 1 year of college: 45
- Some college more than 1 year, no degree: 53
- Associate degree: 35
- Bachelor's degree: 93
- Master's degree: 29
- Professional school degree: 14
- Doctorate degree: 4
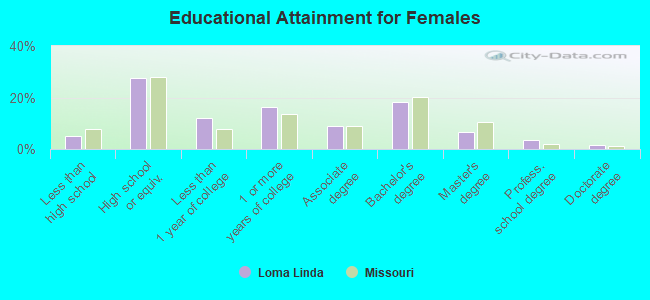
Education attainment for females 25 years and older:
- No schooling: 3
- Nursery to 4th grade: 0
- 5th and 6th grade: 0
- 7th and 8th grade: 0
- 9th grade: 2
- 10th grade: 7
- 11th grade: 0
- 12th grade, no diploma: 6
- High school graduate (or equivalency): 95
- Less than 1 year of college: 42
- Some college more than 1 year, no degree: 56
- Associate degree: 31
- Bachelor's degree: 63
- Master's degree: 23
- Professional school degree: 12
- Doctorate degree: 6
Housing units in structures:
- One, detached: 354
- One, attached: 21
- Two: 29
- 3 or 4: 49
- 5 to 9: 33
- 50 or more: 10
- Mobile homes: 12
Housing units lacking complete kitchen facilities in 2022: 6.5%
House/condo owner moved in on average 7 years ago
Renter moved in on average 1 years ago
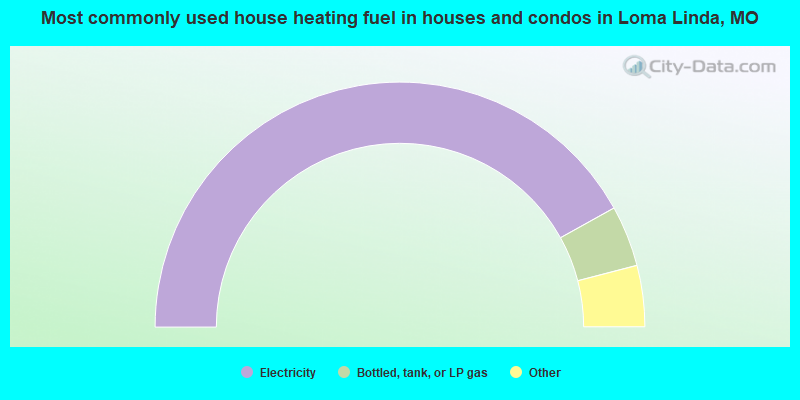
- 84.1%Electricity
- 8.1%Bottled, tank, or LP gas
- 3.7%Utility gas
- 2.0%Solar energy
- 0.9%Other fuel
- 0.9%No fuel used
- 0.3%Wood
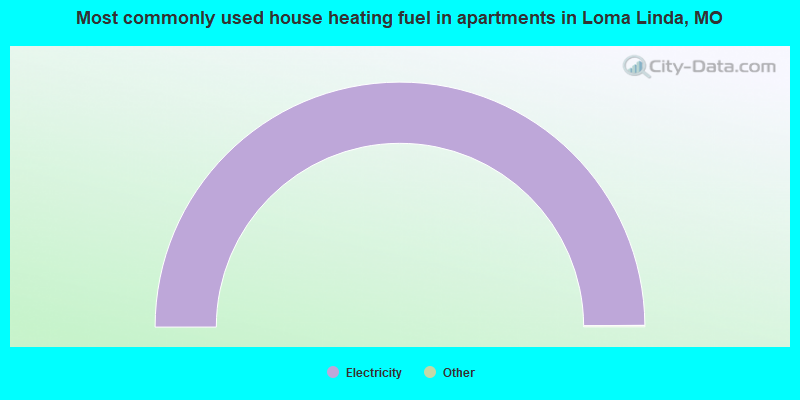
- 100.0%Electricity
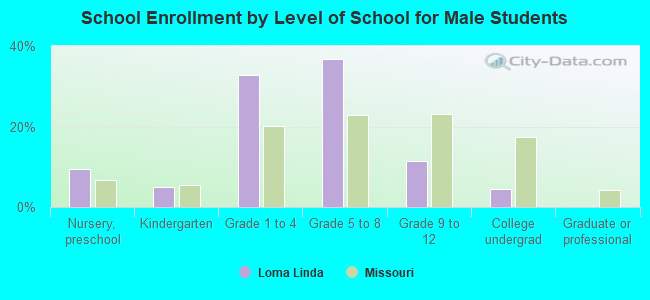
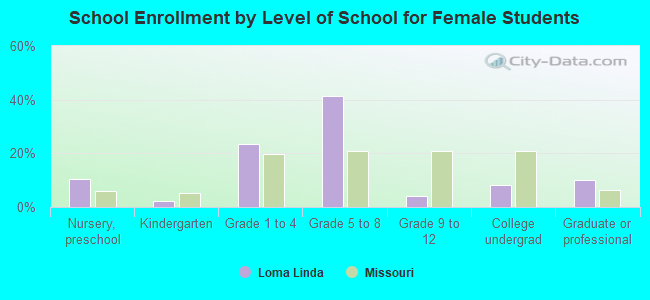
Private vs. public school enrollment:
| Here: | 40.5% |
| Missouri: | 15.4% |
| Here: | 0.0% |
| Missouri: | 13.9% |
| Here: | 40.0% |
| Missouri: | 22.6% |