Madera, CA (California) Houses and Residents
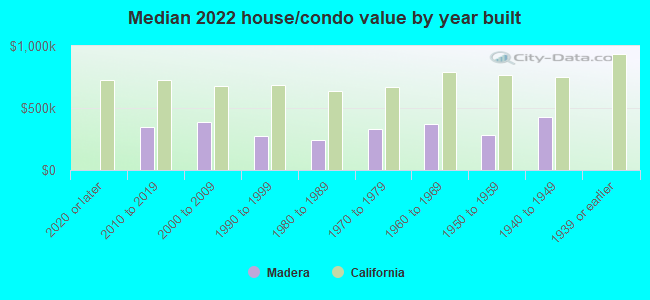
| Madera: | $335,900 |
| California: | $715,900 |
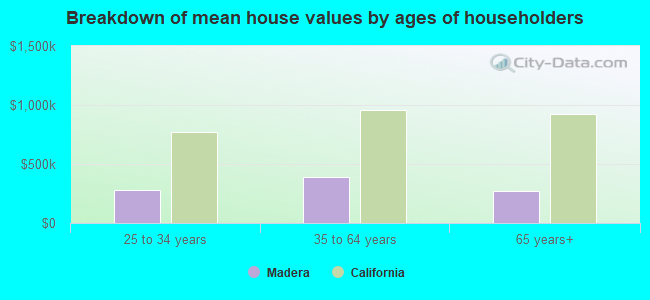
Mean price in 2022:
Detached houses: $328,201
Here: $328,201 State: $988,808 Townhouses or other attached units: $697,278
Here: $697,278 State: $838,546 Mobile homes: $167,990
Here: $167,990 State: $184,506
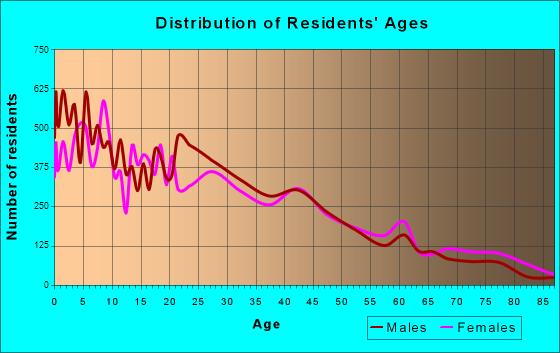
Total population: 63,605 (Urban population: 43,344, Rural population: 26 (all nonfarm))
Houses: 17,210 (16,352 occupied: 9,284 owner occupied, 7,068 renter occupied)
| % of renters here: | 43% |
| State: | 44% |
Housing density: 1,400 houses/condos per square mile
Median price asked for vacant for-sale houses and condos in 2022: $841,019.
Median contract rent in 2022: $1,023 (lower quartile is $827, upper quartile is $1,235)
Median rent asked for vacant for-rent units in 2022: $593
Median gross rent in Madera, CA in 2022: $1,203
Housing units in Madera with a mortgage: 6,751 (253 second mortgage, 0 home equity loan, 217 both second mortgage and home equity loan)
Houses without a mortgage: 105
Median household income for houses/condos with a mortgage: $95,839
Median household income for apartments without a mortgage: $72,291
Median monthly housing costs: $1,318
Compare current foreclosures in Madera, CA:
| Photo | Address | Area | Beds / Baths | Price | Details |
|---|---|---|---|---|---|

|
#1
Laguna Way
Madera, CA 93638
|
1,320 sq. feet
|
2 baths 3 beds |
show details | |

|
#2
Avenue 18 # 18
Madera, CA 93637
|
1,906 sq. feet
|
2 baths 4 beds |
show details | |

|
#3
Walden Ave
Madera, CA 93638
|
1,168 sq. feet
|
1 baths 3 beds |
show details | |

|
#4
Rd 603 Fka 35972 Road 603
Madera, CA 93638
|
1,512 sq. feet
|
2 baths 3 beds |
show details | |

|
#5
Monreal Rd
Madera, CA 93636
|
1,850 sq. feet
|
2 baths 3 beds |
show details | |

|
#6
Grant Ave
Madera, CA 93638
|
720 sq. feet
|
1 baths 2 beds |
show details | |

|
#7
W 7th St
Madera, CA 93637
|
1,824 sq. feet
|
1 baths 3 beds |
show details | |

|
#8
N M St
Madera, CA 93637
|
1,322 sq. feet
|
2 baths 4 beds |
show details | |

|
#9
Road 30
Madera, CA 93637
|
1,724 sq. feet
|
2 baths 4 beds |
show details | |

|
#10
Topper Rd
Madera, CA 93636
|
- sq. feet
|
2 baths 3 beds |
show details |
| Photo | Address | Area | Beds / Baths | Price | Details |
|---|---|---|---|---|---|

|
#11
W 4th St
Madera, CA 93637
|
- sq. feet
|
2 baths 3 beds |
show details | |

|
#12
Charlton Rd
Madera, CA 93636
|
- sq. feet
|
2 baths 3 beds |
show details | |

|
#13
Cambria Ave
Madera, CA 93637
|
- sq. feet
|
1 baths 3 beds |
show details | |

|
#14
Coolidge St
Madera, CA 93638
|
- sq. feet
|
2 baths 3 beds |
show details | |

|
#15
Frisco Way
Madera, CA 93638
|
- sq. feet
|
2 baths 3 beds |
show details | |

|
#16
Fern St
Madera, CA 93638
|
- sq. feet
|
1 baths 2 beds |
show details | |

|
#17
Avenue 13 1/2
Madera, CA 93638
|
- sq. feet
|
1 baths 4 beds |
show details | |

|
#18
Lane Pl
Madera, CA 93638
|
- sq. feet
|
1 baths 3 beds |
show details | |

|
#19
Monreal Rd
Madera, CA 93636
|
- sq. feet
|
3 baths 3 beds |
show details | |

|
#20
Avenue 18 # 18
Madera, CA 93637
|
- sq. feet
|
2 baths 4 beds |
show details |
| Photo | Address | Area | Beds / Baths | Price | Details |
|---|---|---|---|---|---|

|
#21
Lemon Tree Dr
Madera, CA 93637
|
- sq. feet
|
2 baths 4 beds |
show details | |

|
#22
Daley Rd
Madera, CA 93638
|
- sq. feet
|
1 baths 3 beds |
show details | |

|
#23
Shannon Ave
Madera, CA 93637
|
- sq. feet
|
2 baths 4 beds |
show details | |

|
#24
Avenue 5
Madera, CA 93637
|
- sq. feet
|
1 baths 3 beds |
show details | |

|
#25
Ashlan Way
Madera, CA 93638
|
- sq. feet
|
2 baths 3 beds |
show details | |

|
#26
Avenue 14 1/2
Madera, CA 93638
|
- sq. feet
|
3 baths 5 beds |
show details | |

|
#27
Countess Ln
Madera, CA 93637
|
- sq. feet
|
1 baths 3 beds |
show details | |

|
#28
Kensington Dr
Madera, CA 93636
|
- sq. feet
|
2 baths 3 beds |
show details | |

|
#29
W Dunham St
Madera, CA 93637
|
- sq. feet
|
2 baths 3 beds |
show details | |

|
#30
Avenue 18
Madera, CA 93637
|
- sq. feet
|
3 baths 4 beds |
show details |
| Photo | Address | Area | Beds / Baths | Price | Details |
|---|---|---|---|---|---|

|
#31
Harper Blvd
Madera, CA 93638
|
- sq. feet
|
1 baths 3 beds |
show details | |

|
#32
S Granada Dr Apt 54
Madera, CA 93637
|
- sq. feet
|
1 baths 2 beds |
show details | |

|
#33
Concord Ave
Madera, CA 93637
|
- sq. feet
|
- baths - beds |
show details | |

|
#34
El Dorado Ct
Madera, CA 93636
|
- sq. feet
|
- baths - beds |
show details | |

|
#35
Riverview Dr Apt 171
Madera, CA 93637
|
- sq. feet
|
- baths - beds |
show details | |

|
#36
W 4th St
Madera, CA 93637
|
- sq. feet
|
- baths - beds |
show details | |

|
#37
E Almond Ave
Madera, CA 93637
|
- sq. feet
|
- baths - beds |
show details | |

|
#38
De Ann Cv
Madera, CA 93637
|
- sq. feet
|
- baths - beds |
show details | |

|
#39
Avenue 12 1/2 # 12
Madera, CA 93636
|
- sq. feet
|
- baths - beds |
show details | |

|
#40
Spring Way
Madera, CA 93637
|
- sq. feet
|
- baths - beds |
show details |
| Photo | Address | Area | Beds / Baths | Price | Details |
|---|---|---|---|---|---|

|
#41
Road 603
Madera, CA 93638
|
- sq. feet
|
- baths - beds |
show details | |

|
#42
Deborah Ln
Madera, CA 93637
|
- sq. feet
|
- baths - beds |
show details | |

|
#43
N Schnoor St Apt 210
Madera, CA 93637
|
- sq. feet
|
- baths - beds |
show details | |

|
#44
Bonadelle Ave
Madera, CA 93636
|
- sq. feet
|
- baths - beds |
show details | |

|
#45
Morris Ln
Madera, CA 93637
|
- sq. feet
|
- baths - beds |
show details | |

|
#46
River Pt
Madera, CA 93637
|
- sq. feet
|
- baths - beds |
show details | |

|
#47
Paseo Del Mar Pkwy
Madera, CA 93638
|
- sq. feet
|
- baths - beds |
show details | |

|
#48
Columbia St
Madera, CA 93638
|
- sq. feet
|
- baths 3 beds |
show details | |

|
#49
Rosebriar St
Madera, CA 93638
|
- sq. feet
|
- baths - beds |
show details | |

|
Check over 1 million property listings on Foreclosure.com!
|
browse all offers | |||

Latest news about housing in Madera, CA collected exclusively by city-data.com from local newspapers, TV, and radio stations


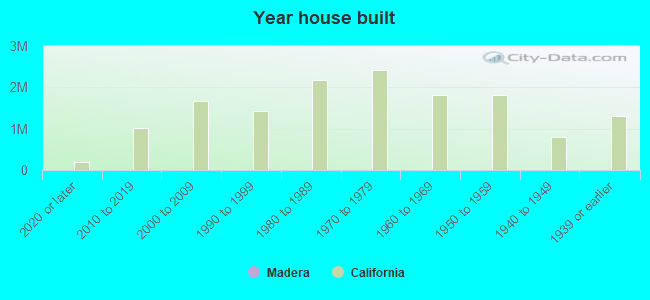
Median year apartment built: 1977
Household type by relationship:
Households: 68,042- Male householders: 7,602 (1,020 living alone), Female householders: 8,750 (1,493 living alone)
7,290 spouses (6,985 opposite-sex spouses), 2,897 unmarried partners, (2,897 opposite-sex unmarried partners), 27,268 children (24,285 natural, 688 adopted, 2,295 stepchildren), 2,732 grandchildren, 2,354 brothers or sisters, 1,832 parents, 0 foster children, 2,655 other relatives, 3,838 non-relatives
- In group quarters: 824
Size of family households: 3,752 2-persons, 1,379 3-persons, 1,938 4-persons, 2,811 5-persons, 1,390 6-persons, 1,735 7-or-more-persons.
Size of nonfamily households: 2,513 1-person, 499 2-persons, 117 3-persons, 110 4-persons, 108 5-persons.
8,516 married couples with children.
8,282 single-parent households (5,004 men, 3,278 women).
38.0% of residents of Madera speak English at home.
60.0% of residents speak Spanish at home (51% speak English very well, 14% speak English well, 13% speak English not well, 21% don't speak English at all).
1.8% of residents speak other Indo-European language at home (71% speak English very well, 8% speak English well, 10% speak English not well, 11% don't speak English at all).
0.3% of residents speak Asian or Pacific Island language at home (57% speak English very well, 23% speak English well, 20% speak English not well).
0.1% of residents speak other language at home (12% speak English very well, 29% speak English well, 26% speak English not well, 33% don't speak English at all).
Foreign born population: 18,737 (27.5%)
(25.2% of them are naturalized citizens)
| Here: | 6.1 |
| State: | 6.0 |
| Here: | 4.4 |
| State: | 3.9 |
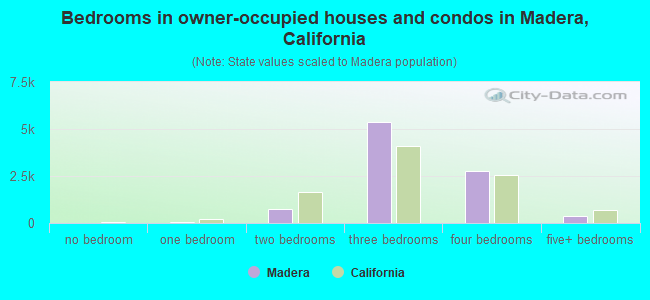
- Bedrooms in owner-occupied houses and condos in Madera, California
- 0no bedroom
- 651 bedroom
- 7202 bedrooms
- 5,3663 bedrooms
- 2,7874 bedrooms
- 3465+ bedrooms
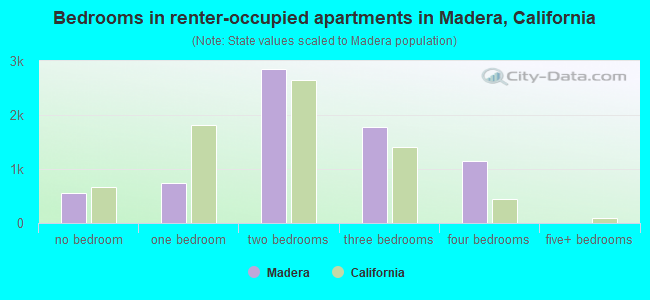
- Bedrooms in renter-occupied apartments in Madera, California
- 548no bedroom
- 7441 bedroom
- 2,8572 bedrooms
- 1,7703 bedrooms
- 1,1494 bedrooms
- 05+ bedrooms
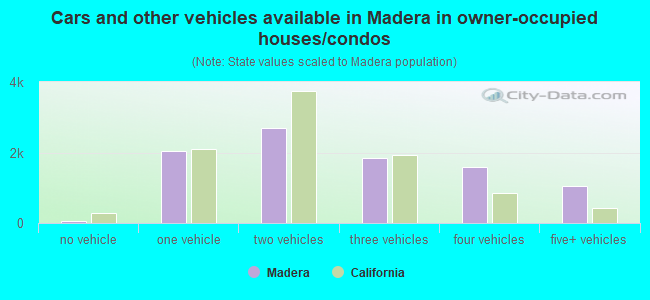
- Cars and other vehicles available in Madera in owner-occupied houses/condos
- 52no vehicle
- 2,0521 vehicle
- 2,7002 vehicles
- 1,8473 vehicles
- 1,5884 vehicles
- 1,0455+ vehicles
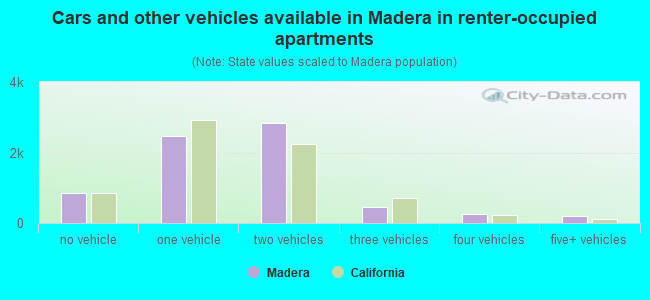
- Cars and other vehicles available in Madera in renter-occupied apartments
- 865no vehicle
- 2,4691 vehicle
- 2,8402 vehicles
- 4513 vehicles
- 2444 vehicles
- 1995+ vehicles
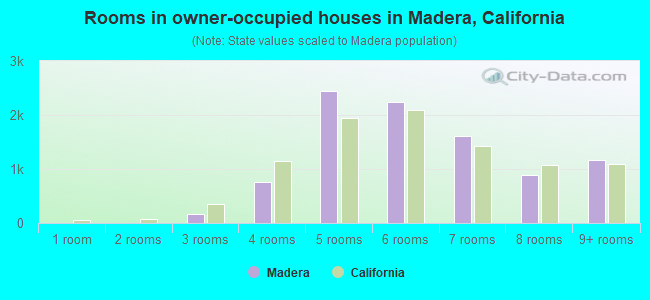
- Rooms in owner-occupied houses in Madera, California
- 01 room
- 02 rooms
- 1583 rooms
- 7604 rooms
- 2,4475 rooms
- 2,2506 rooms
- 1,6207 rooms
- 8828 rooms
- 1,1679+ rooms
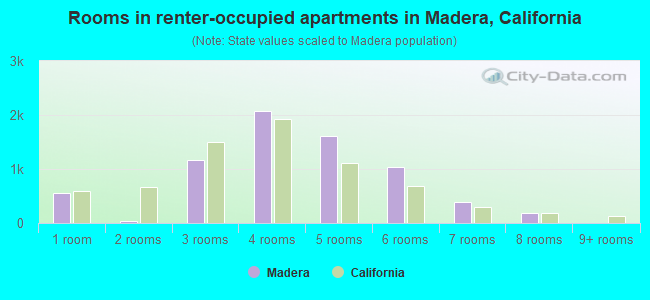
- Rooms in renter-occupied apartments in Madera, California
- 5481 room
- 372 rooms
- 1,1693 rooms
- 2,0694 rooms
- 1,6165 rooms
- 1,0406 rooms
- 3957 rooms
- 1948 rooms
- 09+ rooms
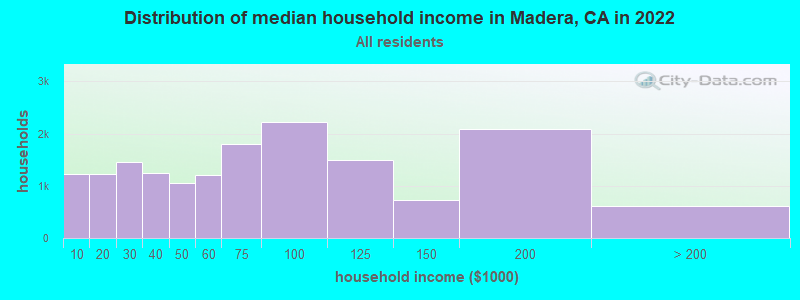
Madera, CA household income distribution

- 1,226Less than $10,000
- 1,234$10,000 to $19,999
- 1,446$20,000 to $29,999
- 1,243$30,000 to $39,999
- 1,050$40,000 to $49,999
- 1,202$50,000 to $59,999
- 1,803$60,000 to $74,999
- 2,221$75,000 to $99,999
- 1,491$100,000 to $124,999
- 722$125,000 to $149,999
- 2,093$150,000 to $199,999
- 621$200,000 or more
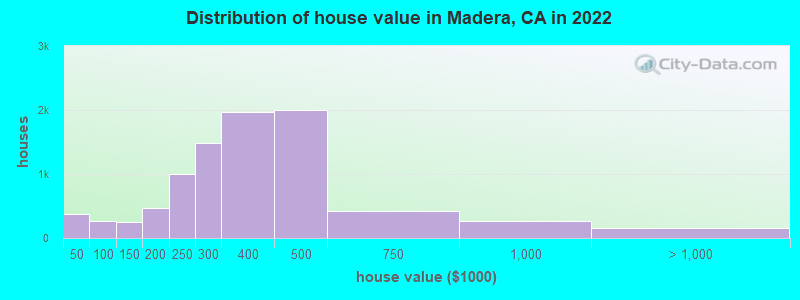
Home value of owner - occupied houses in 2022 in Madera, CA
-
- 110Less than $10,000
- 16$10,000 to $14,999
- 149$15,000 to $19,999
- 11$20,000 to $24,999
- 13$35,000 to $39,999
- 80$40,000 to $49,999
- 18$50,000 to $59,999
- 108$60,000 to $69,999
- 5$70,000 to $79,999
- 49$90,000 to $99,999
- 175$100,000 to $124,999
- 81$125,000 to $149,999
- 151$150,000 to $174,999
- 320$175,000 to $199,999
- 998$200,000 to $249,999
- 1,476$250,000 to $299,999
- 1,968$300,000 to $399,999
- 1,992$400,000 to $499,999
- 421$500,000 to $749,999
- 264$750,000 to $999,999
- 22$1,000,000 to $1,499,999
- 141$2,000,000 or more
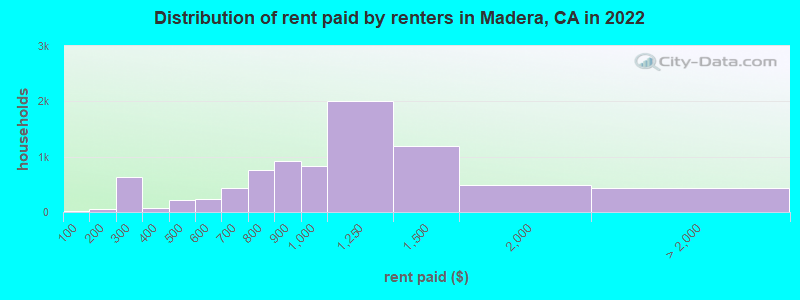
Rent paid by renters in 2022 in Madera, CA
-
- 18Less than $100
- 20$100 to $149
- 40$150 to $199
- 449$200 to $249
- 187$250 to $299
- 23$300 to $349
- 48$350 to $399
- 43$400 to $449
- 163$450 to $499
- 178$500 to $549
- 58$550 to $599
- 250$600 to $649
- 184$650 to $699
- 242$700 to $749
- 517$750 to $799
- 929$800 to $899
- 838$900 to $999
- 2,005$1,000 to $1,249
- 1,189$1,250 to $1,499
- 483$1,500 to $1,999
- 105$2,000 to $2,499
- 11$2,500 to $2,999
- 10$3,000 to $3,499
- 11$3,500 or more
- 285No cash rent
Percentage of workers working in this county: 64.8%
Number of people working at home: 1,570 (6.1% of all workers)
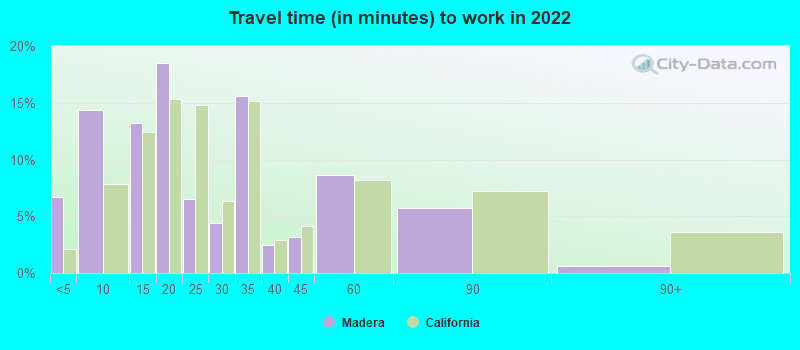
Travel time to work (commute)
- Less than 5 minutes: 1,295
- 5 to 9 minutes: 3,982
- 10 to 14 minutes: 3,230
- 15 to 19 minutes: 2,604
- 20 to 24 minutes: 3,228
- 25 to 29 minutes: 951
- 30 to 34 minutes: 5,452
- 35 to 39 minutes: 429
- 40 to 44 minutes: 1,843
- 45 to 59 minutes: 2,297
- 60 to 89 minutes: 505
- 90 or more minutes: 680
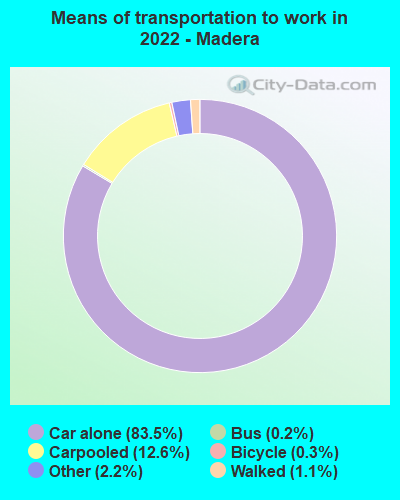
Means of transportation to work:
- Drove a car alone: 16,051 (75.2%)
- Carpooled: 2,606 (12.2%)
- Bus: 28 (0.1%)
- Subway or elevated rail: 9 (0.0%)
- Taxi: 448 (2.1%)
- Bicycle: 68 (0.3%)
- Walked: 229 (1.1%)
- Worked at home: 1,570 (7.4%)
- Unemployment by race in 2022
- Unemployment rate for White non-Hispanic residents
- 2.8%Males
- 10.4%Females
- Unemployment rate for Black residents
- 18.9%Males
- 10.3%Females
- Unemployment rate for American Indian and Alaska Native residents
- 4.1%Males
- Unemployment rate for Asian residents
- 12.8%Males
- 21.3%Females
- Unemployment rate for other race residents
- 10.3%Males
- 20.1%Females
- Unemployment rate for two or more race residents
- 12.8%Males
- 15.1%Females
- Unemployment rate for Hispanic or Latino residents
- 9.7%Males
- 14.8%Females
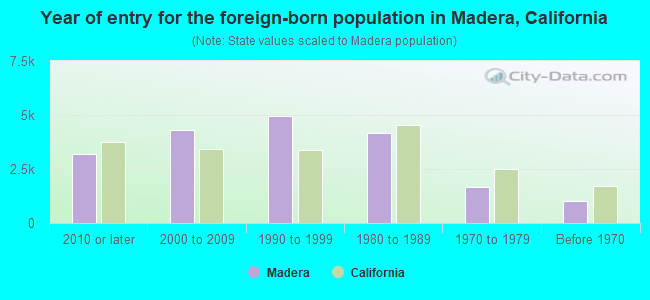
- Year of entry for the foreign-born population in Madera, California
- 3,1732010 or later
- 4,2972000 to 2009
- 4,9651990 to 1999
- 4,1581980 to 1989
- 1,6891970 to 1979
- 1,033Before 1970
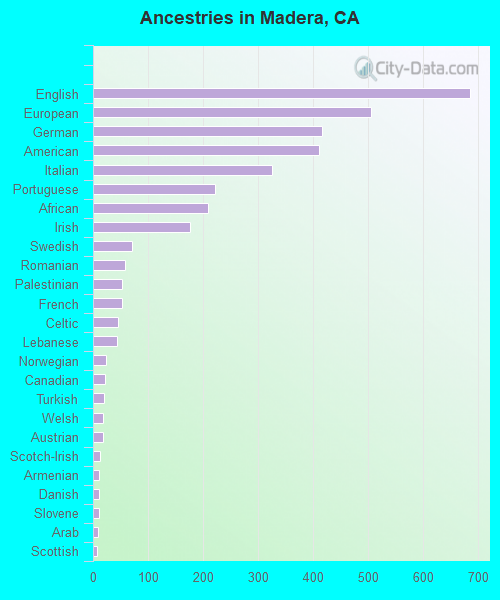
First ancestries reported:
- English: 685 (1.4%)
- European: 505 (1.0%)
- German: 416 (0.9%)
- American: 410 (0.8%)
- Italian: 326 (0.7%)
- Portuguese: 222 (0.5%)
- African: 209 (0.4%)
- Irish: 177 (0.4%)
- Swedish: 70 (0.1%)
- Romanian: 58 (0.1%)
- Palestinian: 52 (0.1%)
- French: 52 (0.1%)
- Celtic: 45 (0.09%)
- Lebanese: 43 (0.09%)
- Norwegian: 24 (0.05%)
- Canadian: 21 (0.04%)
- Turkish: 20 (0.04%)
- Welsh: 19 (0.04%)
- Austrian: 18 (0.04%)
- Scotch-Irish: 13 (0.03%)
- Armenian: 10 (0.02%)
- Danish: 10 (0.02%)
- Slovene: 10 (0.02%)
- Arab: 9 (0.02%)
- Scottish: 8 (0.02%)
- Lithuanian: 6 (0.01%)
- Polish: 4 (0.01%)
Most common places of birth for foreign-born residents (%):
| Madera: | 87.2% (15,989) |
| California: | 37.2% (3,881,193) |
| Madera: | 2.6% (476) |
| California: | 5.2% (539,184) |
| Madera: | 2.1% (377) |
| California: | 4.2% (440,287) |
Place of birth for U.S.-born residents:
- This state: 44,202
- Other state: 3,864
- Northeast: 741
- Midwest: 399
- South: 1,763
- West: 961
90.9% of Madera residents lived in the same house 1 years ago.
Out of people who lived in different houses, 38.6% lived in this county.
Out of people who lived in different counties, 89.2% lived in California.
| Madera: | 90.9% |
| State average: | 88.9% |
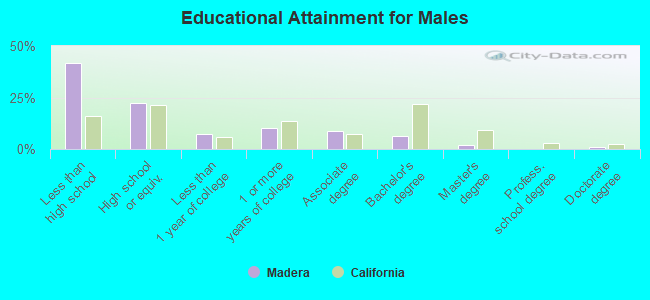
Education attainment for males 25 years and older:
- No schooling: 1,594
- Nursery to 4th grade: 939
- 5th and 6th grade: 2,478
- 7th and 8th grade: 390
- 9th grade: 487
- 10th grade: 723
- 11th grade: 718
- 12th grade, no diploma: 598
- High school graduate (or equivalency): 4,255
- Less than 1 year of college: 1,406
- Some college more than 1 year, no degree: 1,965
- Associate degree: 1,625
- Bachelor's degree: 1,160
- Master's degree: 390
- Professional school degree: 0
- Doctorate degree: 171
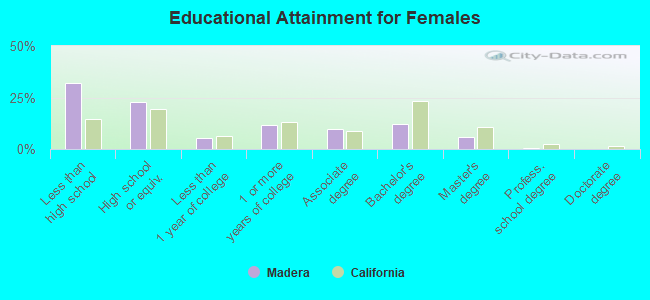
Education attainment for females 25 years and older:
- No schooling: 1,635
- Nursery to 4th grade: 666
- 5th and 6th grade: 1,460
- 7th and 8th grade: 107
- 9th grade: 901
- 10th grade: 502
- 11th grade: 227
- 12th grade, no diploma: 852
- High school graduate (or equivalency): 4,522
- Less than 1 year of college: 1,032
- Some college more than 1 year, no degree: 2,310
- Associate degree: 1,870
- Bachelor's degree: 2,397
- Master's degree: 1,144
- Professional school degree: 69
- Doctorate degree: 0
Housing units in structures:
- One, detached: 11,752
- One, attached: 548
- Two: 312
- 3 or 4: 985
- 5 to 9: 666
- 10 to 19: 739
- 20 to 49: 452
- 50 or more: 545
- Mobile homes: 1,211
Median worth of mobile homes: $40,580
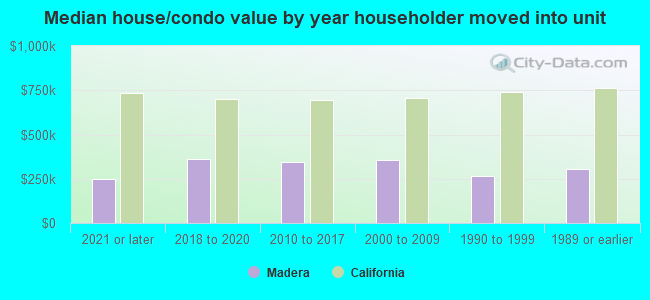
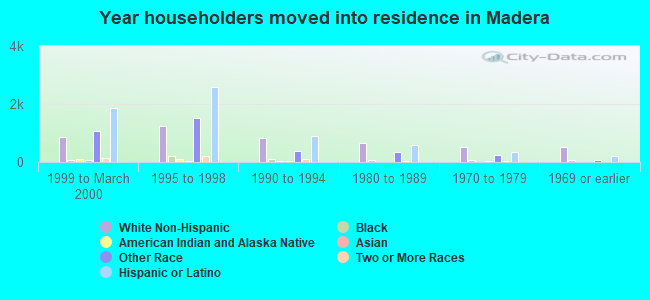
House/condo owner moved in on average 15 years ago
Renter moved in on average 5 years ago
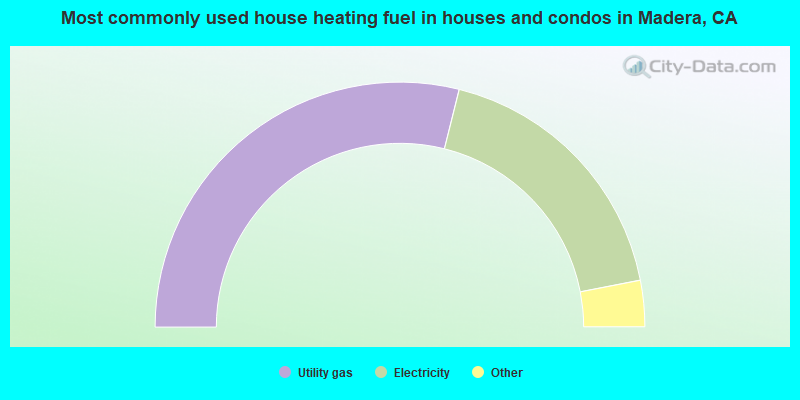
- 57.8%Utility gas
- 36.1%Electricity
- 3.2%Solar energy
- 1.2%Bottled, tank, or LP gas
- 0.9%Wood
- 0.6%No fuel used
- 0.2%Fuel oil, kerosene, etc.
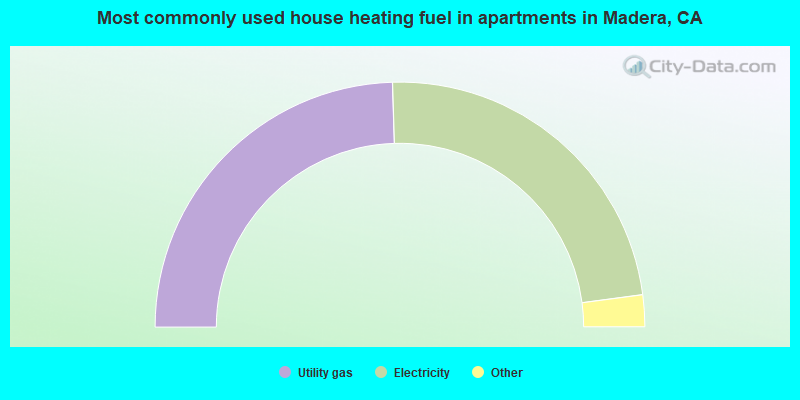
- 49.1%Utility gas
- 46.8%Electricity
- 2.7%No fuel used
- 0.6%Bottled, tank, or LP gas
- 0.6%Solar energy
- 0.3%Fuel oil, kerosene, etc.
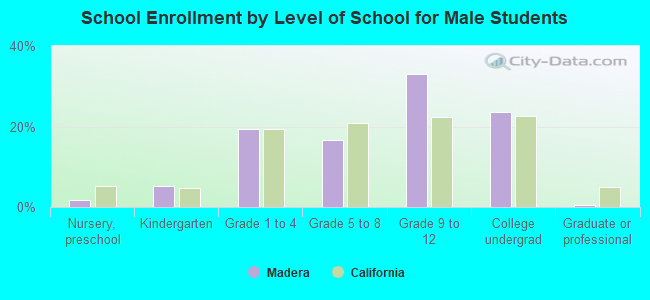
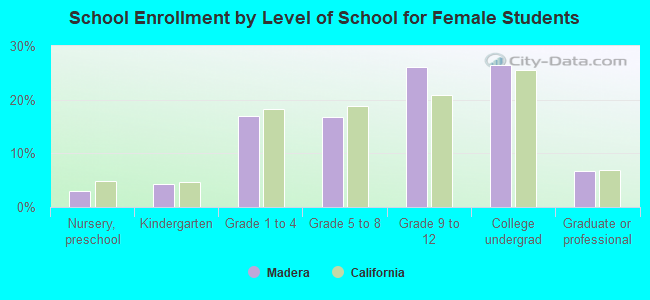
Private vs. public school enrollment:
| Here: | 3.3% |
| California: | 10.5% |
| Here: | 1.1% |
| California: | 8.5% |
| Here: | 2.5% |
| California: | 15.9% |