Mansfield, TX (Texas) Houses and Residents
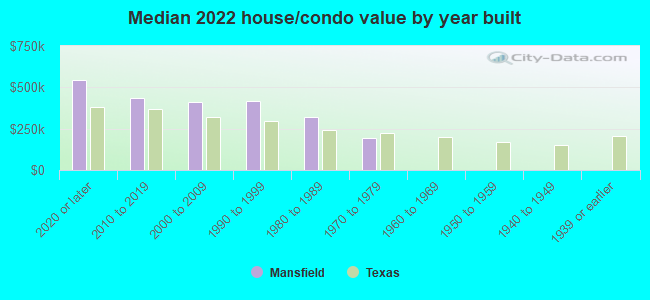
Estimated median house or condo value in 2022: $410,000 (it was $119,700 in 2000 )
Mansfield:
$410,000Texas:
$275,400
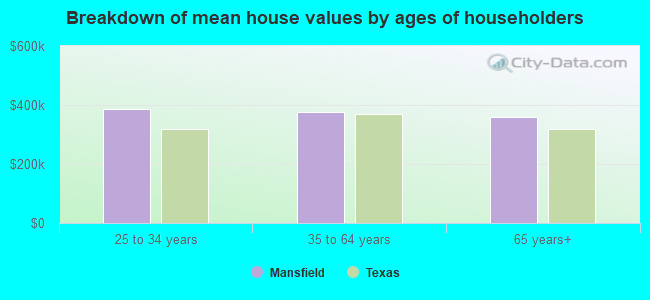
Lower value quartile - upper value quartile: $295,800 - $491,600Mean price in 2022: Detached houses: $399,945 Here:
$399,945State:
$369,058
Townhouses or other attached units: $199,289 Here:
$199,289State:
$327,631
Mobile homes: $725,455 Here:
$725,455State:
$124,413
Total population: 62,246 (Urban population: 27,309, Rural population: 1,679 (73 farm, 1,606 nonfarm ))
Houses: 26,039 (24,145 occupied: 18,147 owner occupied, 5,998 renter occupied )
% of renters here:
25%State:
38%
Housing density: 714 houses/condos per square mile
Median price asked for vacant for-sale houses and condos in 2022: $446,918.
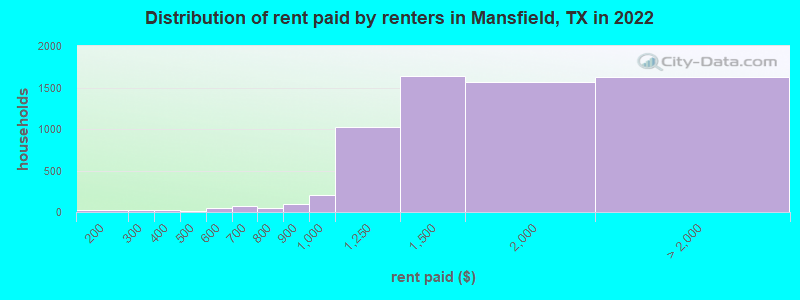
Median contract rent in 2022: $1,558 (lower quartile is $1,336, upper quartile is over $2,000)
Median rent asked for vacant for-rent units in 2022: $5,114
Median gross rent in Mansfield, TX in 2022: $1,827
Housing units in Mansfield with a mortgage: 12,702 (531 second mortgage, 0 home equity loan, 531 both second mortgage and home equity loan )Houses without a mortgage: 244
Median household income for houses/condos with a mortgage: $145,669
Median household income for apartments without a mortgage: $103,720
Median monthly housing costs: $1,971
Data:
Median house or condo value ($)
Median house or condo value ($ change since 2000)
Median house or condo value ($) - White
Median house or condo value ($) - Black or African American
Median house or condo value ($) - Asian
Median house or condo value ($) - Hispanic or Latino
Median house or condo value ($) - American Indian and Alaska Native
Median house or condo value ($) - Multirace
Median house or condo value ($) - Other Race
Median price asked for mobile homes ($)
Household density (households per square mile)
Mean house or condo value by units in structure - 1, detached ($)
Mean house or condo value by units in structure - 1, attached ($)
Mean house or condo value by units in structure - 2 ($)
Mean house or condo value by units in structure by units in structure - 3 or 4 ($)
Mean house or condo value by units in structure - 5 or more ($)
Mean house or condo value by units in structure - Boat, RV, van, etc. ($)
Mean house or condo value by units in structure - Mobile home ($)
Median contract rent ($)
Median contract rent - Lower quartile ($)
Median contract rent - Upper quartile ($)
Median gross rent ($)
Urban houses (%)
Rural houses (%)
Houses occupied (%)
Houses occupied (% change since 2000)
Houses owner occupied (%)
Houses owner occupied (% change since 2000)
Houses renter occupied (%)
Houses renter occupied (% change since 2000)
Vacant housing units - For rent (%)
Vacant housing units - For rent (% change since 2000)
Vacant housing units - For sale only (%)
Vacant housing units - For sale only (% change since 2000)
Vacant housing units - Rented or sold, not occupied (%)
Vacant housing units - Rented or sold, not occupied (% change since 2000)
Vacant housing units - For seasonal, recreational, or occasional use (%)
Vacant housing units - For seasonal, recreational, or occasional use (% change since 2000)
Vacant housing units - For migrant workers (%)
Vacant housing units - For migrant workers (% change since 2000)
Vacant housing units - Other vacant (%)
Vacant housing units - Other vacant (% change since 2000)
Median monthly housing costs ($)
Median household income for houses/condos with a mortgage ($)
Median household income for houses/condos without a mortgage ($)
Median household income ($)
Median household income ($) - White
Median household income ($) - Black or African American
Median household income ($) - Asian
Median household income ($) - Hispanic or Latino
Median household income ($) - American Indian and Alaska Native
Median household income ($) - Multirace
Median household income ($) - Other Race
Mortgage status - with mortgage (%)
Mortgage status - with second mortgage (%)
Mortgage status - with home equity loan (%)
Mortgage status - with both second mortgage and home equity loan (%)
Mortgage status - without a mortgage (%)
Median year house/condo built
Median year apartment built
Household type by relationship - Male householder living alone (%)
Household type by relationship - Male householder not living alone (%)
Household type by relationship - Female householder living alone (%)
Household type by relationship - Female householder not living alone (%)
Household type by relationship - Opposite-Sex spouse (%)
Household type by relationship - Same-Sex spouse (%)
Household type by relationship - Opposite-Sex unmarried partner (%)
Household type by relationship - Same-Sex unmarried partner (%)
Household type by relationship - In group quarters (%)
Size of family households - 2-person household (%)
Size of family households - 3-person household (%)
Size of family households - 4-person household (%)
Size of family households - 5-person household (%)
Size of family households - 6-person household (%)
Size of family households - 7-or-more-person household (%)
Size of nonfamily households - 1-person household (%)
Size of nonfamily households - 2-person household (%)
Size of nonfamily households - 3-person household (%)
Size of nonfamily households - 4-person household (%)
Size of nonfamily households - 5-person household (%)
Size of nonfamily households - 6-person household (%)
Size of nonfamily households - 7-or-moreperson household (%)
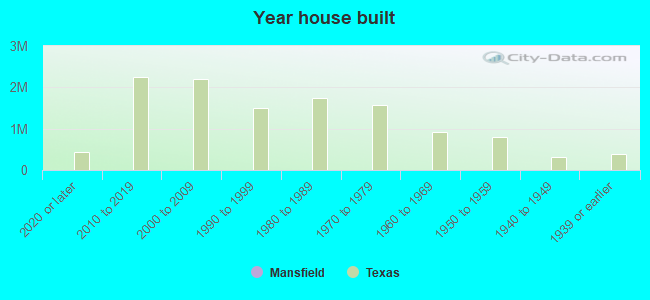
Year house built - Built 2010 or later (%)
Year house built - Built 2000 to 2009 (%)
Year house built - Built 1990 to 1999 (%)
Year house built - Built 1980 to 1989 (%)
Year house built - Built 1970 to 1979 (%)
Year house built - Built 1960 to 1969 (%)
Year house built - Built 1950 to 1959 (%)
Year house built - Built 1940 to 1949 (%)
Year house built - Built 1939 or earlier (%)
Median number of rooms in houses and condos
Median number of rooms in apartments
Median number of bedrooms in owner occupied houses
Mean number of bedrooms in owner occupied houses
Median number of bedrooms in renter occupied houses
Mean number of bedrooms in renter occupied houses
Median number of vehichles in owner occupied houses
Mean number of vehichles in owner occupied houses
Median number of vehichles in renter occupied houses
Mean number of vehichles in renter occupied houses
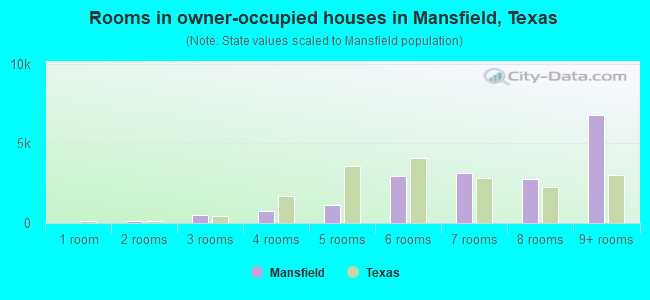
Rooms in owner-occupied houses - 1 room (%)
Rooms in owner-occupied houses - 2 rooms (%)
Rooms in owner-occupied houses - 3 rooms (%)
Rooms in owner-occupied houses - 4 rooms (%)
Rooms in owner-occupied houses - 5 rooms (%)
Rooms in owner-occupied houses - 6 rooms (%)
Rooms in owner-occupied houses - 7 rooms (%)
Rooms in owner-occupied houses - 8 rooms (%)
Rooms in owner-occupied houses - 9+ rooms (%)
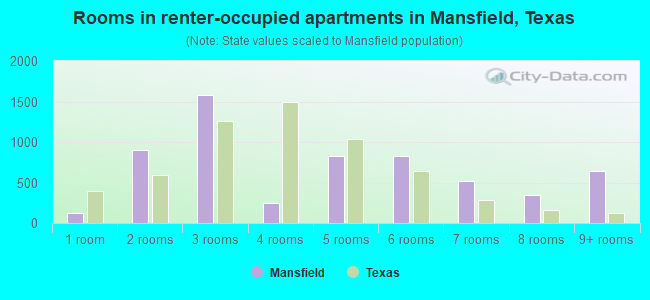
Rooms in renter-occupied houses - 1 room (%)
Rooms in renter-occupied houses - 2 rooms (%)
Rooms in renter-occupied houses - 3 rooms (%)
Rooms in renter-occupied houses - 4 rooms (%)
Rooms in renter-occupied houses - 5 rooms (%)
Rooms in renter-occupied houses - 6 rooms (%)
Rooms in renter-occupied houses - 7 rooms (%)
Rooms in renter-occupied houses - 8 rooms (%)
Rooms in renter-occupied houses - 9+ rooms (%)
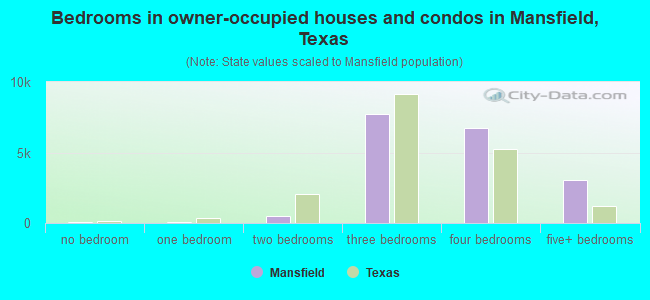
Bedrooms in owner-occupied houses - no bedrooms (%)
Bedrooms in owner-occupied houses - 1 bedroom (%)
Bedrooms in owner-occupied houses - 2 bedrooms (%)
Bedrooms in owner-occupied houses - 3 bedrooms (%)
Bedrooms in owner-occupied houses - 4 bedrooms (%)
Bedrooms in owner-occupied houses - 5+ bedrooms (%)
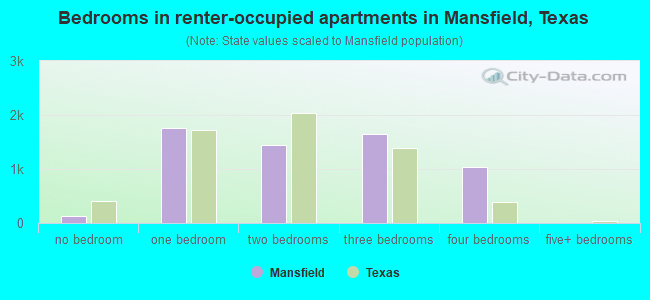
Bedrooms in renter-occupied houses - no bedrooms (%)
Bedrooms in renter-occupied houses - 1 bedroom (%)
Bedrooms in renter-occupied houses - 2 bedrooms (%)
Bedrooms in renter-occupied houses - 3 bedrooms (%)
Bedrooms in renter-occupied houses - 4 bedrooms (%)
Bedrooms in renter-occupied houses - 5+ bedrooms (%)
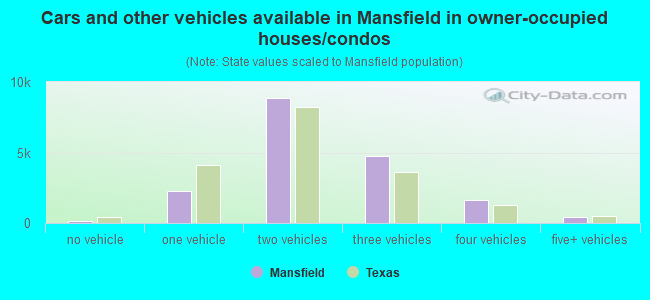
Vehicles available in owner-occupied houses - no vehicle available (%)
Vehicles available in owner-occupied houses - 1 vehicle available(%)
Vehicles available in owner-occupied houses - 2 Vehicles available (%)
Vehicles available in owner-occupied houses - 3 Vehicles available (%)
Vehicles available in owner-occupied houses - 4 Vehicles available (%)
Vehicles available in owner-occupied houses - 5+ Vehicles available (%)
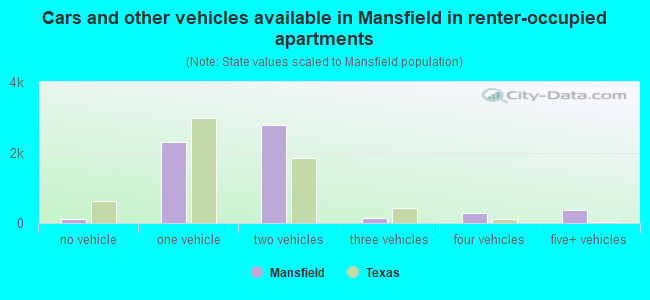
Vehicles available in renter-occupied houses - no vehicle available (%)
Vehicles available in renter-occupied houses - 1 vehicle available (%)
Vehicles available in renter-occupied houses - 2 Vehicles available (%)
Vehicles available in renter-occupied houses - 3 Vehicles available (%)
Vehicles available in renter-occupied houses - 4 Vehicles available (%)
Vehicles available in renter-occupied houses - 5+ Vehicles available (%)
Housing units in structures - 1, detached (%)
Housing units in structures - 1, attached (%)
Housing units in structures - 2 (%)
Housing units in structures - 3 or 4 (%)
Housing units in structures - 5 to 9 (%)
Housing units in structures - 10 to 19 (%)
Housing units in structures - 20 to 49 (%)
Housing units in structures - 50 or more (%)
Housing units in structures - Mobile home (%)
Housing units in structures - Boat, RV, van, etc. (%)
Housing units in structures - Owners - 1, detached (%)
Housing units in structures - Owners - 1, attached (%)
Housing units in structures - Owners - 2 (%)
Housing units in structures - Owners - 3 or 4 (%)
Housing units in structures - Owners - 5 to 9 (%)
Housing units in structures - Owners - 10 to 19 (%)
Housing units in structures - Owners - 20 to 49 (%)
Housing units in structures - Owners - 50 or more (%)
Housing units in structures - Owners - Mobile home (%)
Housing units in structures - Owners - Boat, RV, van, etc. (%)
Housing units in structures - Renters - 1, detached (%)
Housing units in structures - Renters - 1, attached (%)
Housing units in structures - Renters - 2 (%)
Housing units in structures - Renters - 3 or 4 (%)
Housing units in structures - Renters - 5 to 9 (%)
Housing units in structures - Renters - 10 to 19 (%)
Housing units in structures - Renters - 20 to 49 (%)
Housing units in structures - Renters - 50 or more (%)
Housing units in structures - Renters - Mobile home (%)
Housing units in structures - Renters - Boat, RV, van, etc. (%)
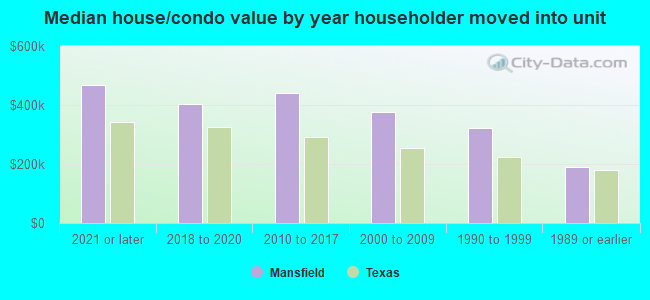
House/condo owner moved in on average (years ago)
Renter moved in on average (years ago)
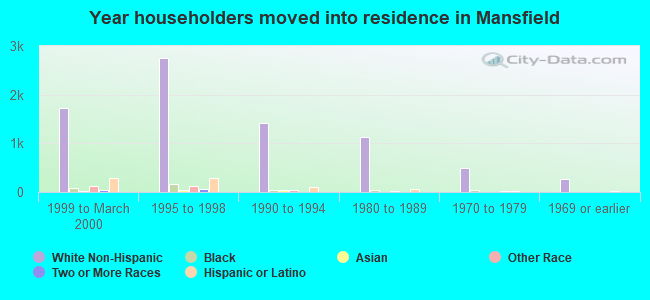
Year householder moved into unit - Moved in 1999 to March 2000 (%)
Year householder moved into unit - Moved in 1999 to March 2000 (%) - White
Year householder moved into unit - Moved in 1999 to March 2000 (%) - Black or African American
Year householder moved into unit - Moved in 1999 to March 2000 (%) - Asian
Year householder moved into unit - Moved in 1999 to March 2000 (%) - Hispanic or Latino
Year householder moved into unit - Moved in 1999 to March 2000 (%) - American Indian and Alaska Native
Year householder moved into unit - Moved in 1999 to March 2000 (%) - Multirace
Year householder moved into unit - Moved in 1999 to March 2000 (%) - Other Race
Year householder moved into unit - Moved in 1995 to 1998 (%)
Year householder moved into unit - Moved in 1995 to 1998 (%) - White
Year householder moved into unit - Moved in 1995 to 1998 (%) - Black or African American
Year householder moved into unit - Moved in 1995 to 1998 (%) - Asian
Year householder moved into unit - Moved in 1995 to 1998 (%) - Hispanic or Latino
Year householder moved into unit - Moved in 1995 to 1998 (%) - American Indian and Alaska Native
Year householder moved into unit - Moved in 1995 to 1998 (%) - Multirace
Year householder moved into unit - Moved in 1995 to 1998 (%) - Other Race
Year householder moved into unit - Moved in 1990 to 1994 (%)
Year householder moved into unit - Moved in 1990 to 1994 (%) - White
Year householder moved into unit - Moved in 1990 to 1994 (%) - Black or African American
Year householder moved into unit - Moved in 1990 to 1994 (%) - Asian
Year householder moved into unit - Moved in 1990 to 1994 (%) - Hispanic or Latino
Year householder moved into unit - Moved in 1990 to 1994 (%) - American Indian and Alaska Native
Year householder moved into unit - Moved in 1990 to 1994 (%) - Multirace
Year householder moved into unit - Moved in 1990 to 1994 (%) - Other Race
Year householder moved into unit - Moved in 1980 to 1989 (%)
Year householder moved into unit - Moved in 1980 to 1989 (%) - White
Year householder moved into unit - Moved in 1980 to 1989 (%) - Black or African American
Year householder moved into unit - Moved in 1980 to 1989 (%) - Asian
Year householder moved into unit - Moved in 1980 to 1989 (%) - Hispanic or Latino
Year householder moved into unit - Moved in 1980 to 1989 (%) - American Indian and Alaska Native
Year householder moved into unit - Moved in 1980 to 1989 (%) - Multirace
Year householder moved into unit - Moved in 1980 to 1989 (%) - Other Race
Year householder moved into unit - Moved in 1970 to 1979 (%)
Year householder moved into unit - Moved in 1970 to 1979 (%) - White
Year householder moved into unit - Moved in 1970 to 1979 (%) - Black or African American
Year householder moved into unit - Moved in 1970 to 1979 (%) - Asian
Year householder moved into unit - Moved in 1970 to 1979 (%) - Hispanic or Latino
Year householder moved into unit - Moved in 1970 to 1979 (%) - American Indian and Alaska Native
Year householder moved into unit - Moved in 1970 to 1979 (%) - Multirace
Year householder moved into unit - Moved in 1970 to 1979 (%) - Other Race
Year householder moved into unit - Moved in 1969 or earlier (%)
Year householder moved into unit - Moved in 1969 or earlier (%) - White
Year householder moved into unit - Moved in 1969 or earlier (%) - Black or African American
Year householder moved into unit - Moved in 1969 or earlier (%) - Asian
Year householder moved into unit - Moved in 1969 or earlier (%) - Hispanic or Latino
Year householder moved into unit - Moved in 1969 or earlier (%) - American Indian and Alaska Native
Year householder moved into unit - Moved in 1969 or earlier (%) - Multirace
Year householder moved into unit - Moved in 1969 or earlier (%) - Other Race
Housing units lacking complete plumbing facilities (%)
Housing units lacking complete kitchen facilities (%)
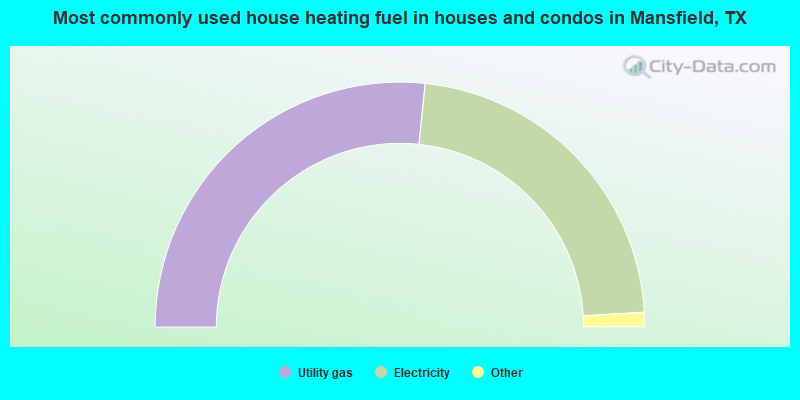
House heating fuel used in houses and condos - Utility gas (%)
House heating fuel used in houses and condos - Bottled, tank, or LP gas (%)
House heating fuel used in houses and condos - Electricity (%)
House heating fuel used in houses and condos - Fuel oil, kerosene, etc. (%)
House heating fuel used in houses and condos - Coal or coke (%)
House heating fuel used in houses and condos - Wood (%)
House heating fuel used in houses and condos - Solar energy (%)
House heating fuel used in houses and condos - Other fuel (%)
House heating fuel used in houses and condos - No fuel used (%)
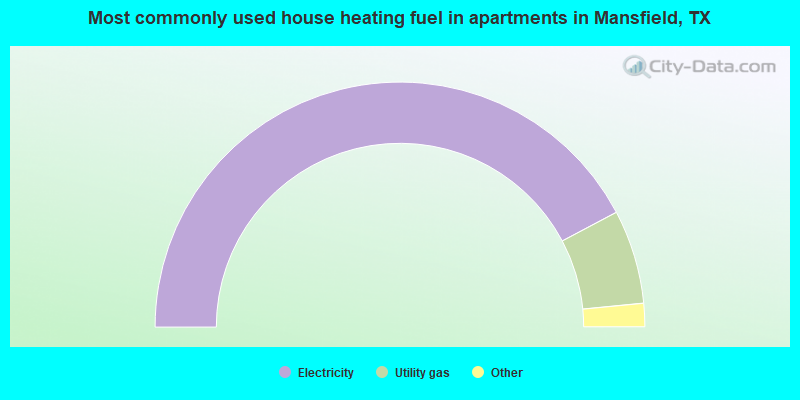
House heating fuel used in apartments - Utility gas (%)
House heating fuel used in apartments - Bottled, tank, or LP gas (%)
House heating fuel used in apartments - Electricity (%)
House heating fuel used in apartments - Fuel oil, kerosene, etc. (%)
House heating fuel used in apartments - Coal or coke (%)
House heating fuel used in apartments - Wood (%)
House heating fuel used in apartments - Solar energy (%)
House heating fuel used in apartments - Other fuel (%)
House heating fuel used in apartments - No fuel used (%)
Latest news about housing in Mansfield, TX collected exclusively by city-data.com from local newspapers, TV, and radio stations
Median year house/condo built: 2004Median year apartment built: 2007Household type by relationship:
Households: 76,586
Male householders: 12,249 (1,363 living alone ), Female householders: 11,896 (2,594 living alone )15,192 spouses (15,104 opposite-sex spouses ), 1,189 unmarried partners , (969 opposite-sex unmarried partners ), 27,084 children (25,486 natural , 71 adopted , 1,527 stepchildren ), 2,405 grandchildren , 579 brothers or sisters , 1,277 parents , 174 foster children , 1,304 other relatives , 2,914 non-relatives In group quarters: 323
Size of family households: 5,852 2-persons , 5,011 3-persons , 4,793 4-persons , 1,828 5-persons , 778 6-persons , 615 7-or-more-persons .
Size of nonfamily households: 3,957 1-person , 735 2-persons , 215 3-persons , 361 5-persons .
14,573 married couples with children. single-parent households (1,025 men , 2,815 women ).
80.7% of residents of Mansfield speak English at home. of residents speak Spanish at home (74% speak English very well , 15% speak English well , 9% speak English not well , 2% don't speak English at all ).of residents speak other Indo-European language at home (60% speak English very well , 30% speak English well , 9% speak English not well ).of residents speak Asian or Pacific Island language at home (47% speak English very well , 39% speak English well , 14% speak English not well ).of residents speak other language at home (79% speak English very well , 9% speak English well , 12% speak English not well , 1% don't speak English at all ).
Foreign born population: 9,976 (13.0%)of them are naturalized citizens )
Median number of rooms in houses and condos:
Median number of rooms in apartments
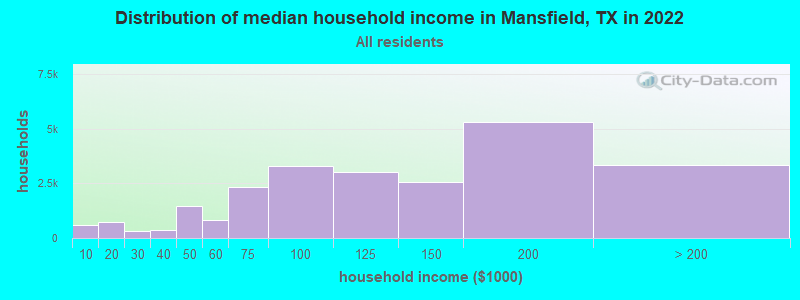
Mansfield, TX household income distribution 583 Less than $10,000729 $10,000 to $19,999308 $20,000 to $29,999374 $30,000 to $39,9991,486 $40,000 to $49,999815 $50,000 to $59,9992,332 $60,000 to $74,9993,300 $75,000 to $99,9993,006 $100,000 to $124,9992,564 $125,000 to $149,9995,321 $150,000 to $199,9993,327 $200,000 or more
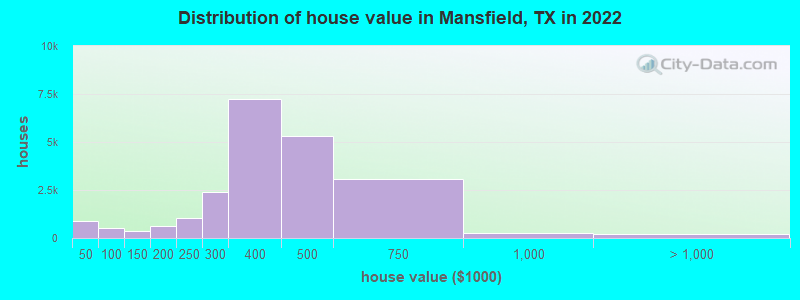
Home value of owner - occupied houses in 2022 in Mansfield, TX 373 Less than $10,00031 $10,000 to $14,99983 $15,000 to $19,99916 $20,000 to $24,999139 $25,000 to $29,99964 $30,000 to $34,99934 $35,000 to $39,999158 $40,000 to $49,99986 $50,000 to $59,999131 $60,000 to $69,99942 $70,000 to $79,99960 $80,000 to $89,99932 $90,000 to $99,999263 $100,000 to $124,999116 $125,000 to $149,999191 $150,000 to $174,999431 $175,000 to $199,9991,039 $200,000 to $249,9992,403 $250,000 to $299,9997,222 $300,000 to $399,9995,314 $400,000 to $499,9993,059 $500,000 to $749,999279 $750,000 to $999,999172 $1,000,000 to $1,499,99924 $2,000,000 or moreRent paid by renters in 2022 in Mansfield, TX 3 Less than $10024 $100 to $14919 $200 to $2495 $250 to $29916 $300 to $3492 $350 to $39913 $400 to $44932 $500 to $54912 $550 to $59967 $600 to $64932 $700 to $74912 $750 to $79998 $800 to $899206 $900 to $9991,026 $1,000 to $1,2491,637 $1,250 to $1,4991,563 $1,500 to $1,9991,219 $2,000 to $2,499211 $2,500 to $2,99989 $3,000 to $3,49946 $3,500 or more55 No cash rent
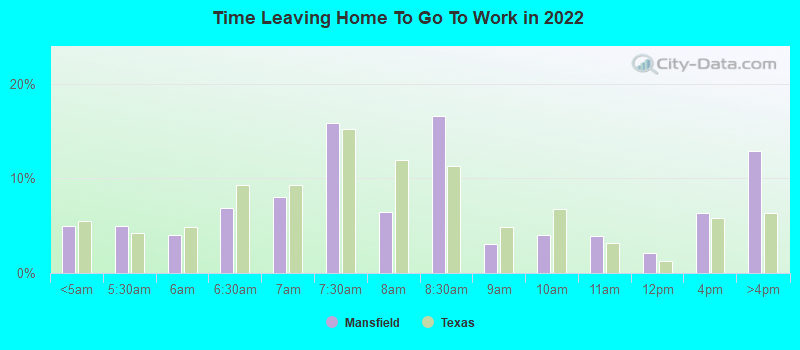
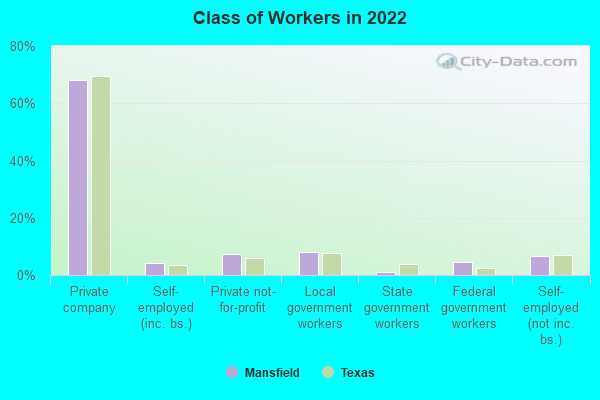
Percentage of workers working in this county: 70.6%Number of people working at home: 6,932 (17.6% of all workers )
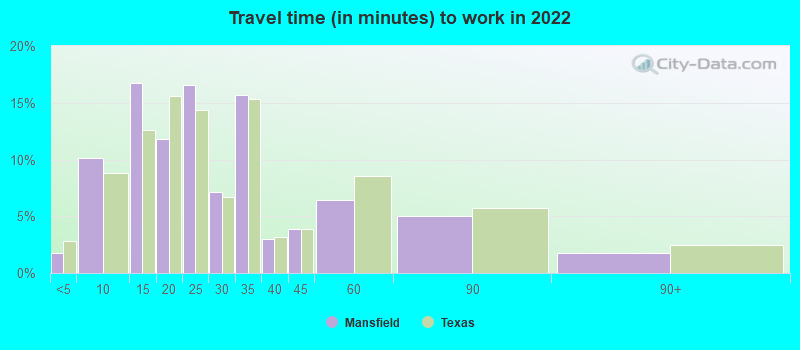
Travel time to work (commute)
Less than 5 minutes: 7065 to 9 minutes: 2,42810 to 14 minutes: 4,61815 to 19 minutes: 4,16220 to 24 minutes: 3,97525 to 29 minutes: 2,38830 to 34 minutes: 8,18735 to 39 minutes: 3,01240 to 44 minutes: 2,30245 to 59 minutes: 2,71360 to 89 minutes: 1,17190 or more minutes: 356
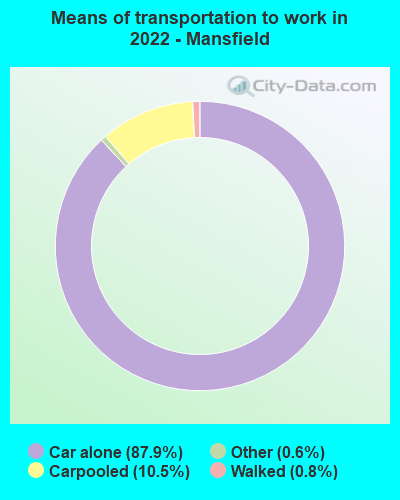
Means of transportation to work:
Drove a car alone: 26,012 (71.6%)Carpooled: 3,229 (8.9%)Bus : 16 (0.0%)Taxi: 230 (0.6%)Bicycle: 18 (0.0%)Walked: 234 (0.6%)Worked at home: 6,932 (19.1%)
Unemployment by race in 2022
Unemployment rate for White non-Hispanic residents 2.8% Males0.6% FemalesUnemployment rate for Black residents 3.5% Males1.5% FemalesUnemployment rate for American Indian and Alaska Native residents 7.4% Males11.8% FemalesUnemployment rate for Asian residents 5.7% Males0.8% FemalesUnemployment rate for other race residents 8.5% Males12.7% FemalesUnemployment rate for Hispanic or Latino residents 2.2% Males6.4% Females
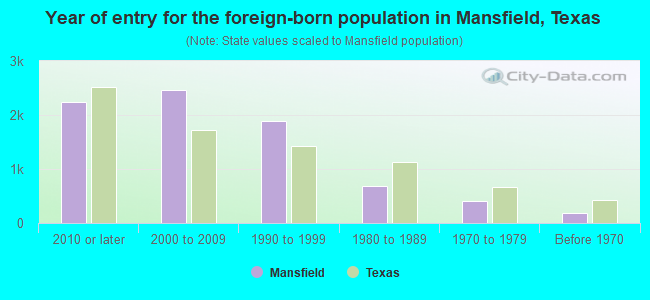
Year of entry for the foreign-born population in Mansfield, Texas
2,235 2010 or later 2,457 2000 to 2009 1,897 1990 to 1999 690 1980 to 1989 414 1970 to 1979 191 Before 1970
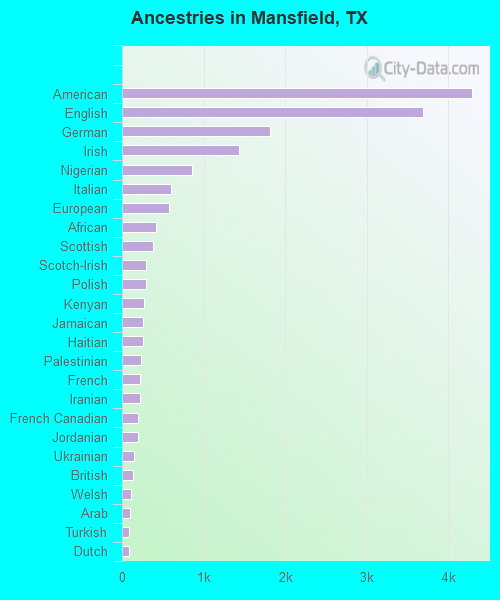
First ancestries reported:
American: 4,285 (10.5%)
English: 3,687 (9.1%)
German: 1,809 (4.5%)
Irish: 1,436 (3.5%)
Nigerian: 857 (2.1%)
Italian: 604 (1.5%)
European: 571 (1.4%)
African: 414 (1.0%)
Scottish: 383 (0.9%)
Scotch-Irish: 291 (0.7%)
Polish: 291 (0.7%)
Kenyan: 272 (0.7%)
Jamaican: 263 (0.6%)
Haitian: 258 (0.6%)
Palestinian: 234 (0.6%)
French: 216 (0.5%)
Iranian: 215 (0.5%)
French Canadian: 194 (0.5%)
Jordanian: 193 (0.5%)
Ukrainian: 146 (0.4%)
British: 140 (0.3%)
Welsh: 110 (0.3%)
Arab: 95 (0.2%)
Turkish: 83 (0.2%)
Dutch: 80 (0.2%)
Norwegian: 79 (0.2%)
Finnish: 72 (0.2%)
Czech: 72 (0.2%)
Northern European: 66 (0.2%)
Egyptian: 58 (0.1%)
Swedish: 53 (0.1%)
U.S. Virgin Islander: 53 (0.1%)
Brazilian: 51 (0.1%)
Russian: 46 (0.1%)
Greek: 40 (0.10%)
Lebanese: 37 (0.09%)
Danish: 37 (0.09%)
Canadian: 36 (0.09%)
Ghanaian: 33 (0.08%)
Portuguese: 32 (0.08%)
Iraqi: 27 (0.07%)
Swiss: 24 (0.06%)
Ethiopian: 22 (0.05%)
West Indian: 19 (0.05%)
Bahamian: 18 (0.04%)
Eastern European: 17 (0.04%)
Czechoslovakian: 14 (0.03%)
Cape Verdean: 13 (0.03%)
Scandinavian: 11 (0.03%)
Austrian: 10 (0.02%)
Hungarian: 9 (0.02%)
Croatian: 8 (0.02%)
Armenian: 6 (0.01%)
Romanian: 5 (0.01%)
Slovak: 4 (0.01%)
Most common places of birth for foreign-born residents (%): Mexico Mansfield:
23.9% (2,200)Texas:
48.4% (2,411,723)
Vietnam Mansfield:
10.7% (985)Texas:
3.7% (184,770)
Nigeria Mansfield:
8.3% (765)Texas:
1.9% (96,110)
Canada Mansfield:
5.7% (527)Texas:
1.1% (55,371)
India Mansfield:
5.2% (478)Texas:
6.1% (306,347)
Asia, n.e.c. Mansfield:
4.5% (412)Texas:
0.1% (4,638)
Colombia Mansfield:
3.2% (290)Texas:
1.2% (61,555)
Kenya Mansfield:
3.1% (284)Texas:
0.4% (20,458)
Afghanistan Mansfield:
3.0% (276)Texas:
0.3% (13,197)
Iran Mansfield:
2.3% (208)Texas:
0.6% (28,963)
Philippines Mansfield:
1.9% (174)Texas:
2.1% (103,148)
Germany Mansfield:
1.7% (161)Texas:
0.8% (37,989)
Place of birth for U.S.-born residents:
This state: 37,939Other state: 26,266Northeast: 4,558Midwest: 8,043South: 4,965West: 8,700 88.1% of Mansfield residents lived in the same house 1 years ago.
Out of people who lived in different houses, 35.3% lived in this county.
Out of people who lived in different counties, 56.9% lived in Texas.
Mansfield:
88.1%State average:
85.7%
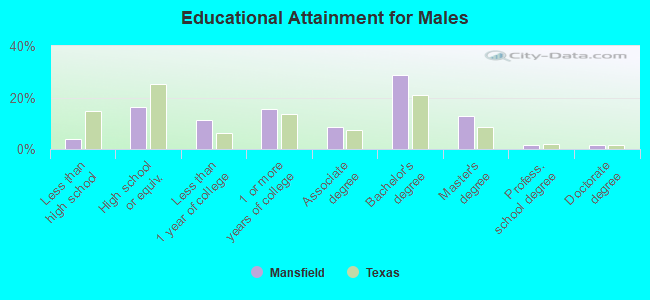
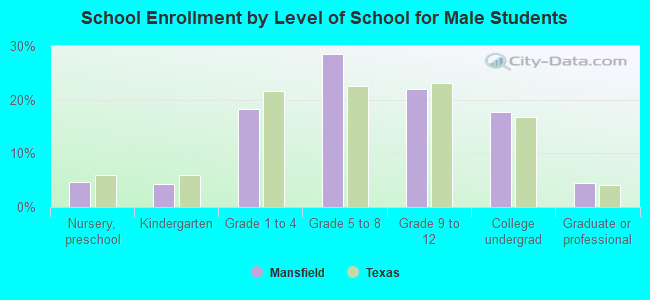
Education attainment for males 25 years and older:
No schooling: 196Nursery to 4th grade: 05th and 6th grade: 1717th and 8th grade: 09th grade: 5210th grade: 011th grade: 19112th grade, no diploma: 203High school graduate (or equivalency): 3,606Less than 1 year of college: 2,499Some college more than 1 year, no degree: 3,418Associate degree: 1,853Bachelor's degree: 6,292Master's degree: 2,827Professional school degree: 304Doctorate degree: 375
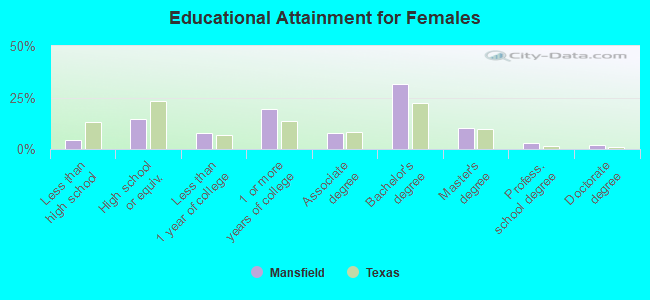
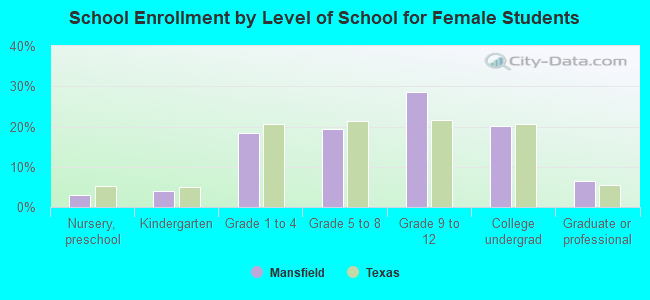
Education attainment for females 25 years and older:
No schooling: 188Nursery to 4th grade: 05th and 6th grade: 2207th and 8th grade: 09th grade: 9910th grade: 29711th grade: 16512th grade, no diploma: 120High school graduate (or equivalency): 3,796Less than 1 year of college: 2,014Some college more than 1 year, no degree: 5,001Associate degree: 1,991Bachelor's degree: 8,233Master's degree: 2,670Professional school degree: 705Doctorate degree: 508
Housing units in structures:
One, detached: 20,595One, attached: 3403 or 4: 1365 to 9: 31610 to 19: 93120 to 49: 1,12650 or more: 1,483Mobile homes: 1,112Median worth of mobile homes: $64,400
Housing units lacking complete kitchen facilities in 2022: 4.4%House/condo owner moved in on average 8 years ago
Renter moved in on average 1 years ago
Private vs. public school enrollment:
Students in private schools in grades 1 to 8 (elementary and middle school): 600 Students in private schools in grades 9 to 12 (high school): 200 Students in private undergraduate colleges: 854