Mechanicsville, VA (Virginia) Houses and Residents
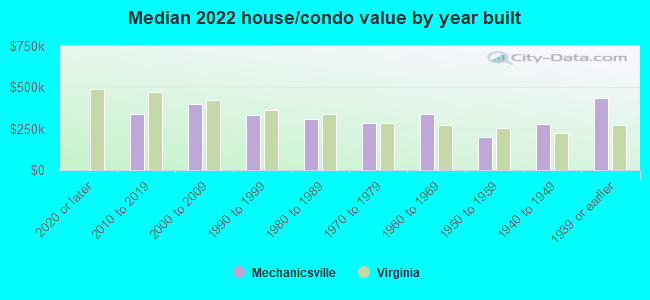
| Mechanicsville: | $319,907 |
| Virginia: | $365,700 |
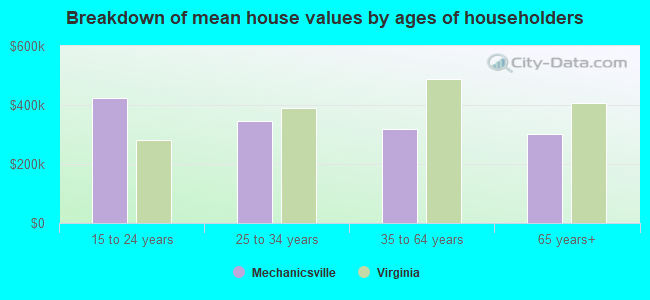
Mean price in 2022:
Detached houses: $349,680
Here: $349,680 State: $472,865 Townhouses or other attached units: $311,703
Here: $311,703 State: $457,437 In 5-or-more-unit structures: $248,136
Here: $248,136 State: $382,551
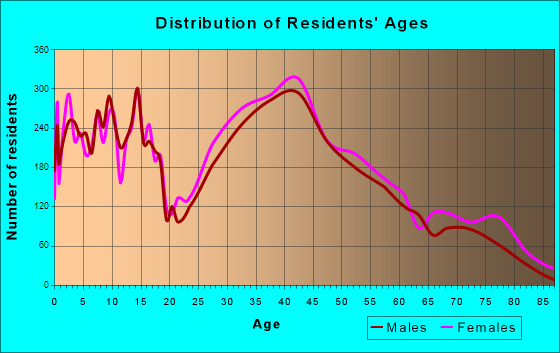
Total population: 36,348 (Urban population: 30,355, Rural population: 102 (all nonfarm))
Houses: 16,220 (15,535 occupied: 12,242 owner occupied, 3,485 renter occupied)
| % of renters here: | 22% |
| State: | 33% |
Housing density: 571 houses/condos per square mile
Median price asked for vacant for-sale houses and condos in 2022: $262,720.
Median contract rent in 2022: $1,209 (lower quartile is $954, upper quartile is $1,664)
Median rent asked for vacant for-rent units in 2022: $3,932
Median gross rent in Mechanicsville, VA in 2022: $1,406
Housing units in Mechanicsville with a mortgage: 8,659 (812 second mortgage, 18 home equity loan, 647 both second mortgage and home equity loan)
Houses without a mortgage: 207
Median household income for houses/condos with a mortgage: $110,896
Median household income for apartments without a mortgage: $77,416
Median monthly housing costs: $1,349
Compare current foreclosures in Mechanicsville, VA:
| Photo | Address | Area | Beds / Baths | Price | Details |
|---|---|---|---|---|---|

|
#1
Creekway Ct
Mechanicsville, VA 23111
|
2,510 sq. feet
|
2 baths 4 beds |
show details | |

|
#2
Huntington Woods Dr
Mechanicsville, VA 23116
|
2,270 sq. feet
|
3 baths 2 beds |
show details | |

|
#3
Colony Dr
Mechanicsville, VA 23111
|
1,326 sq. feet
|
1 baths 3 beds |
show details | |

|
#4
Sandy Valley Rd
Mechanicsville, VA 23111
|
1,296 sq. feet
|
2 baths 3 beds |
show details | |

|
#5
Wynbrook Ln
Mechanicsville, VA 23111
|
1,480 sq. feet
|
1 baths 3 beds |
show details | |

|
#6
Cold Harbor Rd
Mechanicsville, VA 23111
|
2,200 sq. feet
|
2 baths 4 beds |
show details | |

|
#7
Snaffle Ln
Mechanicsville, VA 23111
|
1,092 sq. feet
|
2 baths 3 beds |
show details | |

|
#8
Grace Ln
Mechanicsville, VA 23111
|
1,368 sq. feet
|
2 baths 4 beds |
show details | |

|
#9
Yellowrose Ln
Mechanicsville, VA 23111
|
1,380 sq. feet
|
2 baths 3 beds |
show details | |

|
#10
Old Cavalry Dr
Mechanicsville, VA 23111
|
2,071 sq. feet
|
2 baths 5 beds |
show details |
| Photo | Address | Area | Beds / Baths | Price | Details |
|---|---|---|---|---|---|

|
#11
Holly Ridge Rd
Mechanicsville, VA 23116
|
1,706 sq. feet
|
2 baths 3 beds |
show details | |

|
#12
Dutch Lily Ct
Mechanicsville, VA 23111
|
1,610 sq. feet
|
2 baths 4 beds |
show details | |

|
#13
Winding Hills Dr
Mechanicsville, VA 23111
|
1,428 sq. feet
|
2 baths 3 beds |
show details | |

|
#14
Jackson Arch Dr
Mechanicsville, VA 23111
|
1,600 sq. feet
|
3 baths 4 beds |
show details | |

|
#15
Pleasant Grove Rd
Mechanicsville, VA 23116
|
1,796 sq. feet
|
1 baths 3 beds |
show details | |

|
#16
Bartletts Bluff Rd
Mechanicsville, VA 23111
|
1,836 sq. feet
|
3 baths 3 beds |
show details | |

|
#17
Whippoorwill Rd
Mechanicsville, VA 23116
|
1,200 sq. feet
|
1 baths 2 beds |
show details | |

|
#18
Lake Haven Dr
Mechanicsville, VA 23111
|
2,638 sq. feet
|
2 baths 4 beds |
show details | |

|
#19
Shane Edmonds Ln
Mechanicsville, VA 23111
|
1,991 sq. feet
|
2 baths 4 beds |
show details | |

|
#20
Tammy Ln
Mechanicsville, VA 23111
|
1,456 sq. feet
|
2 baths 3 beds |
show details |
| Photo | Address | Area | Beds / Baths | Price | Details |
|---|---|---|---|---|---|

|
#21
Wendellshire Way
Mechanicsville, VA 23111
|
6,978 sq. feet
|
5 baths 6 beds |
show details | |

|
#22
Walnut Grove
Mechanicsville, VA 23111
|
1,296 sq. feet
|
1 baths 3 beds |
show details | |

|
#23
Mayetta Dr
Mechanicsville, VA 23111
|
1,404 sq. feet
|
2 baths 3 beds |
show details | |

|
#24
Academy Dr
Mechanicsville, VA 23116
|
896 sq. feet
|
1 baths 2 beds |
show details | |

|
#25
Aquarius Dr
Mechanicsville, VA 23111
|
936 sq. feet
|
1 baths 3 beds |
show details | |

|
#26
Camille Dr
Mechanicsville, VA 23111
|
1,140 sq. feet
|
2 baths 3 beds |
show details | |

|
#27
Senn Way
Mechanicsville, VA 23111
|
972 sq. feet
|
1 baths 3 beds |
show details | |

|
#28
Kenmore Dr
Mechanicsville, VA 23111
|
1,388 sq. feet
|
1 baths 3 beds |
show details | |

|
#29
Stonefield Ct
Mechanicsville, VA 23116
|
2,125 sq. feet
|
2 baths 4 beds |
show details | |

|
#30
Rosemary Dr
Mechanicsville, VA 23111
|
1,200 sq. feet
|
2 baths 3 beds |
show details |
| Photo | Address | Area | Beds / Baths | Price | Details |
|---|---|---|---|---|---|

|
#31
Sweetbay Ln
Mechanicsville, VA 23111
|
2,108 sq. feet
|
2 baths 4 beds |
show details | |

|
#32
Rose Dr
Mechanicsville, VA 23111
|
2,240 sq. feet
|
2 baths 3 beds |
show details | |

|
#33
Burnside Ct
Mechanicsville, VA 23116
|
1,482 sq. feet
|
2 baths 3 beds |
show details | |

|
#34
Stronghold Dr
Mechanicsville, VA 23111
|
1,448 sq. feet
|
2 baths 3 beds |
show details | |

|
#35
Carter Ln
Mechanicsville, VA 23111
|
1,161 sq. feet
|
1 baths 3 beds |
show details | |

|
#36
Marimel Ln
Mechanicsville, VA 23111
|
1,832 sq. feet
|
2 baths 4 beds |
show details | |

|
#37
Clark Cir
Mechanicsville, VA 23111
|
1,848 sq. feet
|
2 baths 3 beds |
show details | |

|
#38
Ryegate Pl
Mechanicsville, VA 23111
|
2,784 sq. feet
|
2 baths 4 beds |
show details | |

|
#39
Cornfield Ln
Mechanicsville, VA 23111
|
1,300 sq. feet
|
1 baths 3 beds |
show details | |

|
#40
Dress Blue Dr
Mechanicsville, VA 23116
|
3,143 sq. feet
|
2 baths 4 beds |
show details |
| Photo | Address | Area | Beds / Baths | Price | Details |
|---|---|---|---|---|---|

|
#41
Mill Valley Rd
Mechanicsville, VA 23111
|
1,208 sq. feet
|
2 baths 3 beds |
show details | |

|
#42
Howard Dr
Mechanicsville, VA 23116
|
3,125 sq. feet
|
3 baths 3 beds |
show details | |

|
#43
Thelma Lou Rd
Mechanicsville, VA 23111
|
2,048 sq. feet
|
2 baths 4 beds |
show details | |

|
#44
N Mayfield Ln
Mechanicsville, VA 23111
|
1,454 sq. feet
|
1 baths 3 beds |
show details | |

|
#45
Sugar Oak Ct
Mechanicsville, VA 23111
|
2,033 sq. feet
|
2 baths 4 beds |
show details | |

|
#46
Falling Leaf Ct
Mechanicsville, VA 23111
|
3,084 sq. feet
|
2 baths 4 beds |
show details | |

|
#47
Piping Tree Ferry Rd
Mechanicsville, VA 23111
|
2,328 sq. feet
|
3 baths 3 beds |
show details | |

|
#48
Gethsemane Ct
Mechanicsville, VA 23111
|
1,690 sq. feet
|
4 baths 8 beds |
show details | |

|
#49
Twin Oaks Rd
Mechanicsville, VA 23116
|
1,638 sq. feet
|
2 baths 3 beds |
show details | |

|
Check over 1 million property listings on Foreclosure.com!
|
browse all offers | |||

Latest news about housing in Mechanicsville, VA collected exclusively by city-data.com from local newspapers, TV, and radio stations

 | High concentration of condos/townhouses. (2 replies) |
| Apartments in safe neighborhoods (8 replies) |
| Midlothian or Mechanicsville (13 replies) |
| Over 55 - any local communities other than retirement homes? (8 replies) |
| Vacant retail/warehouse space Ashland, Hanover. Mechanicsville (2 replies) |
| Mechanicsville and beyond (2 replies) |
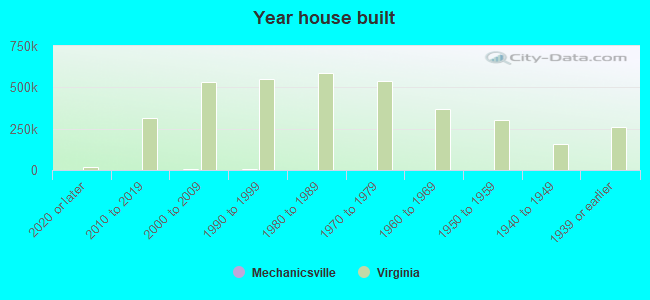
Median year apartment built: 1993
Household type by relationship:
Households: 39,169- Male householders: 7,168 (1,416 living alone), Female householders: 8,202 (2,756 living alone)
7,860 spouses (7,782 opposite-sex spouses), 1,135 unmarried partners, (1,109 opposite-sex unmarried partners), 11,629 children (10,520 natural, 464 adopted, 643 stepchildren), 818 grandchildren, 373 brothers or sisters, 539 parents, 13 foster children, 351 other relatives, 779 non-relatives
- In group quarters: 296
Size of family households: 5,171 2-persons, 2,656 3-persons, 1,941 4-persons, 755 5-persons, 297 6-persons, 80 7-or-more-persons.
Size of nonfamily households: 3,830 1-person, 672 2-persons, 155 3-persons, 13 4-persons.
5,838 married couples with children.
2,636 single-parent households (861 men, 1,775 women).
96.4% of residents of Mechanicsville speak English at home.
0.9% of residents speak Spanish at home (96% speak English very well, 4% speak English not well).
1.0% of residents speak other Indo-European language at home (53% speak English very well, 36% speak English well, 11% don't speak English at all).
1.1% of residents speak Asian or Pacific Island language at home (81% speak English very well, 4% speak English well, 15% speak English not well).
0.5% of residents speak other language at home (66% speak English very well, 14% speak English well, 12% speak English not well, 7% don't speak English at all).
Foreign born population: 1,159 (3.0%)
(50.4% of them are naturalized citizens)
| Here: | 7.0 |
| State: | 7.0 |
| Here: | 4.5 |
| State: | 4.3 |
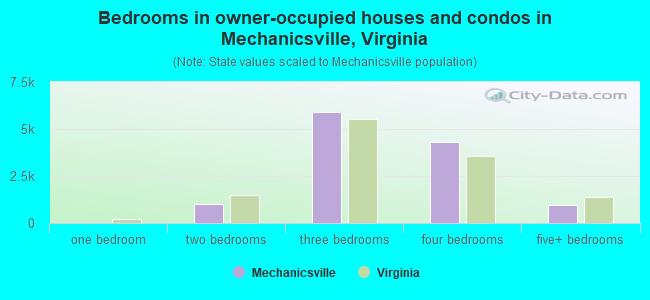
- Bedrooms in owner-occupied houses and condos in Mechanicsville, Virginia
- 0no bedroom
- 121 bedroom
- 1,0352 bedrooms
- 5,9133 bedrooms
- 4,3114 bedrooms
- 9715+ bedrooms
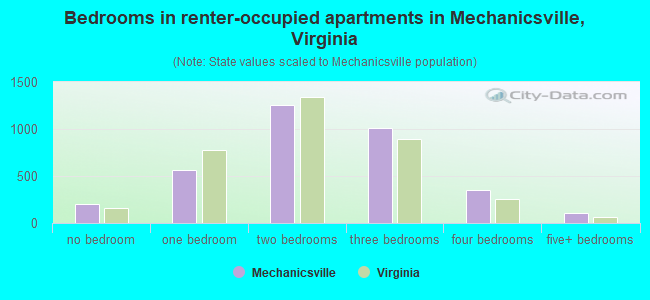
- Bedrooms in renter-occupied apartments in Mechanicsville, Virginia
- 198no bedroom
- 5641 bedroom
- 1,2542 bedrooms
- 1,0123 bedrooms
- 3514 bedrooms
- 1075+ bedrooms
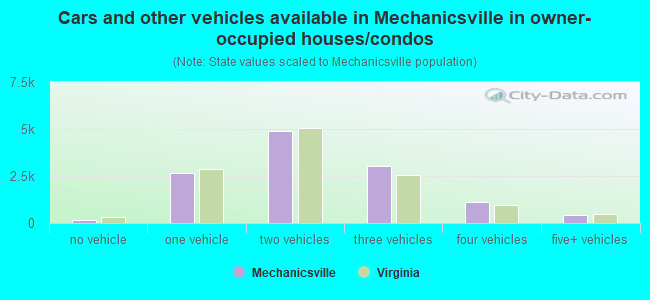
- Cars and other vehicles available in Mechanicsville in owner-occupied houses/condos
- 141no vehicle
- 2,6391 vehicle
- 4,8782 vehicles
- 3,0313 vehicles
- 1,1314 vehicles
- 4215+ vehicles
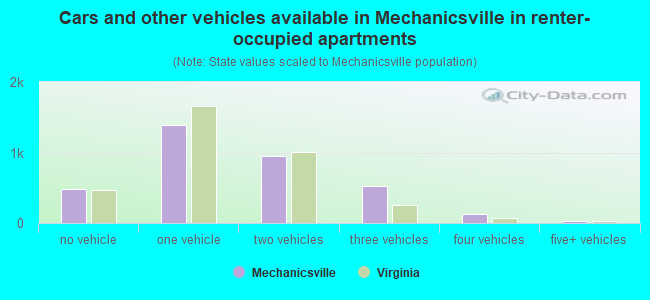
- Cars and other vehicles available in Mechanicsville in renter-occupied apartments
- 482no vehicle
- 1,3881 vehicle
- 9442 vehicles
- 5193 vehicles
- 1274 vehicles
- 265+ vehicles
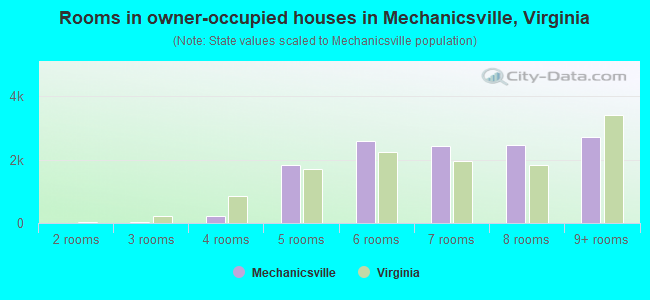
- Rooms in owner-occupied houses in Mechanicsville, Virginia
- 01 room
- 02 rooms
- 403 rooms
- 2184 rooms
- 1,8435 rooms
- 2,5836 rooms
- 2,4177 rooms
- 2,4488 rooms
- 2,6969+ rooms
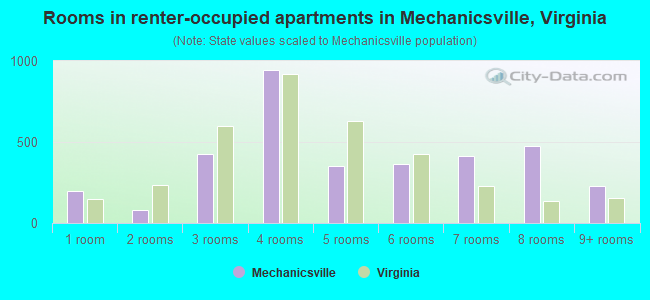
- Rooms in renter-occupied apartments in Mechanicsville, Virginia
- 1981 room
- 782 rooms
- 4263 rooms
- 9464 rooms
- 3545 rooms
- 3646 rooms
- 4147 rooms
- 4758 rooms
- 2309+ rooms
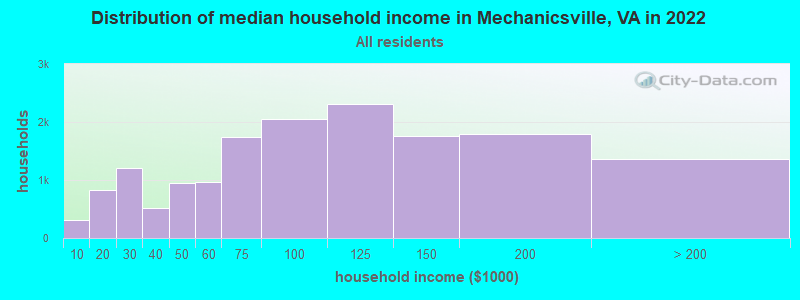
Mechanicsville, VA household income distribution

- 311Less than $10,000
- 829$10,000 to $19,999
- 1,214$20,000 to $29,999
- 518$30,000 to $39,999
- 954$40,000 to $49,999
- 964$50,000 to $59,999
- 1,747$60,000 to $74,999
- 2,054$75,000 to $99,999
- 2,310$100,000 to $124,999
- 1,762$125,000 to $149,999
- 1,794$150,000 to $199,999
- 1,357$200,000 or more
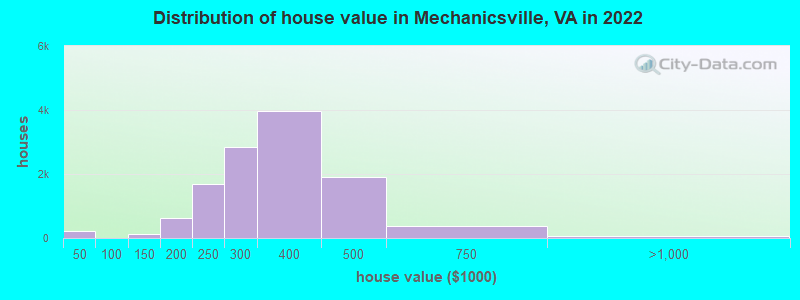
Home value of owner - occupied houses in 2022 in Mechanicsville, VA
-
- 9Less than $10,000
- 23$10,000 to $14,999
- 56$20,000 to $24,999
- 62$25,000 to $29,999
- 35$30,000 to $34,999
- 19$35,000 to $39,999
- 14$40,000 to $49,999
- 69$100,000 to $124,999
- 70$125,000 to $149,999
- 82$150,000 to $174,999
- 536$175,000 to $199,999
- 1,703$200,000 to $249,999
- 2,850$250,000 to $299,999
- 3,984$300,000 to $399,999
- 1,907$400,000 to $499,999
- 377$500,000 to $749,999
- 56$750,000 to $999,999
- 20$1,000,000 to $1,499,999
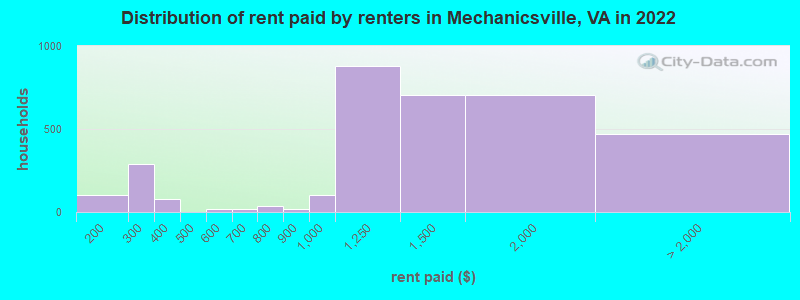
Rent paid by renters in 2022 in Mechanicsville, VA
-
- 8$100 to $149
- 93$150 to $199
- 292$200 to $249
- 67$300 to $349
- 8$350 to $399
- 20$550 to $599
- 7$600 to $649
- 12$650 to $699
- 37$700 to $749
- 20$800 to $899
- 99$900 to $999
- 882$1,000 to $1,249
- 705$1,250 to $1,499
- 702$1,500 to $1,999
- 162$2,000 to $2,499
- 142$3,500 or more
- 163No cash rent
Percentage of workers working in this county: 48.7%
Number of people working at home: 3,469 (17.2% of all workers)
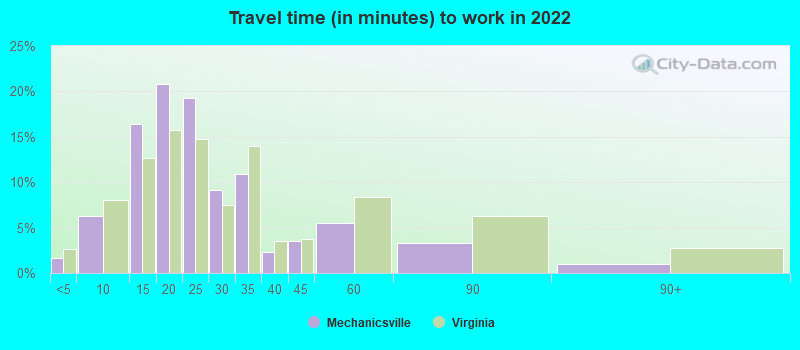
Travel time to work (commute)
- Less than 5 minutes: 279
- 5 to 9 minutes: 789
- 10 to 14 minutes: 1,962
- 15 to 19 minutes: 2,363
- 20 to 24 minutes: 4,881
- 25 to 29 minutes: 2,285
- 30 to 34 minutes: 2,723
- 35 to 39 minutes: 420
- 40 to 44 minutes: 627
- 45 to 59 minutes: 479
- 60 to 89 minutes: 191
- 90 or more minutes: 181
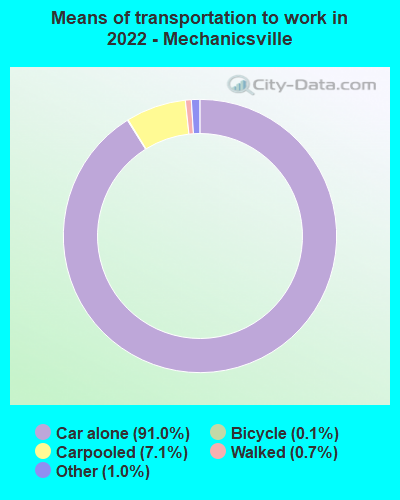
Means of transportation to work:
- Drove a car alone: 12,244 (72.9%)
- Carpooled: 971 (5.8%)
- Taxi: 170 (1.0%)
- Bicycle: 15 (0.1%)
- Walked: 99 (0.6%)
- Worked at home: 3,469 (20.7%)
- Unemployment by race in 2022
- Unemployment rate for White non-Hispanic residents
- 2.0%Males
- 0.5%Females
- Unemployment rate for Black residents
- 3.1%Males
- 1.7%Females
- Unemployment rate for Asian residents
- 3.6%Females
- Unemployment rate for two or more race residents
- 3.8%Males
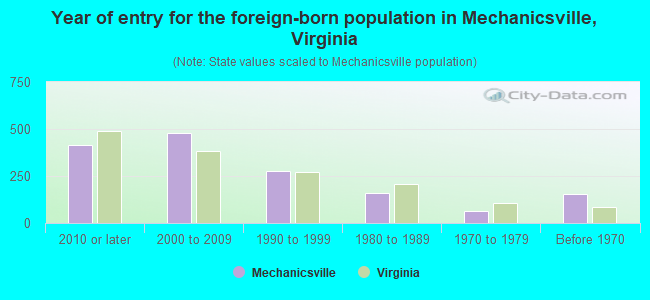
- Year of entry for the foreign-born population in Mechanicsville, Virginia
- 4142010 or later
- 4772000 to 2009
- 2771990 to 1999
- 1581980 to 1989
- 631970 to 1979
- 152Before 1970
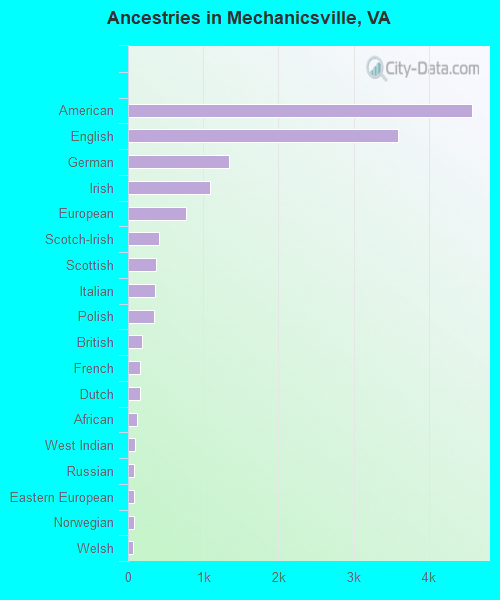
First ancestries reported:
- American: 4,569 (24.3%)
- English: 3,590 (19.1%)
- German: 1,346 (7.2%)
- Irish: 1,094 (5.8%)
- European: 765 (4.1%)
- Scotch-Irish: 416 (2.2%)
- Scottish: 375 (2.0%)
- Italian: 363 (1.9%)
- Polish: 352 (1.9%)
- British: 184 (1.0%)
- French: 163 (0.9%)
- Dutch: 153 (0.8%)
- African: 115 (0.6%)
- West Indian: 99 (0.5%)
- Russian: 80 (0.4%)
- Eastern European: 75 (0.4%)
- Norwegian: 74 (0.4%)
- Welsh: 72 (0.4%)
- Ukrainian: 35 (0.2%)
- Czech: 31 (0.2%)
- Romanian: 23 (0.1%)
- Egyptian: 21 (0.1%)
- French Canadian: 21 (0.1%)
- Swedish: 19 (0.1%)
- Ethiopian: 17 (0.09%)
- Arab: 14 (0.07%)
- Hungarian: 14 (0.07%)
- Austrian: 13 (0.07%)
- Cajun: 10 (0.05%)
- Canadian: 10 (0.05%)
- Slovak: 8 (0.04%)
- Jordanian: 7 (0.04%)
- Celtic: 7 (0.04%)
- Greek: 6 (0.03%)
- Lithuanian: 6 (0.03%)
- Latvian: 5 (0.03%)
- Portuguese: 5 (0.03%)
- Macedonian: 4 (0.02%)
- Croatian: 4 (0.02%)
- Lebanese: 2 (0.01%)
Most common places of birth for foreign-born residents (%):
| Mechanicsville: | 18.5% (287) |
| Virginia: | 0.9% (9,842) |
| Mechanicsville: | 7.4% (114) |
| Virginia: | 0.4% (4,747) |
| Mechanicsville: | 6.2% (96) |
| Virginia: | 1.2% (12,984) |
| Mechanicsville: | 5.9% (92) |
| Virginia: | 9.0% (97,830) |
| Mechanicsville: | 5.7% (89) |
| Virginia: | 4.8% (52,629) |
| Mechanicsville: | 4.0% (62) |
| Virginia: | 1.3% (14,435) |
| Mechanicsville: | 4.0% (62) |
| Virginia: | 0.9% (9,440) |
| Mechanicsville: | 3.9% (60) |
| Virginia: | 1.7% (18,227) |
| Mechanicsville: | 3.9% (60) |
| Virginia: | 0.1% (846) |
| Mechanicsville: | 3.4% (53) |
| Virginia: | 0.1% (999) |
| Mechanicsville: | 2.9% (45) |
| Virginia: | 4.2% (45,750) |
| Mechanicsville: | 2.8% (44) |
| Virginia: | 0.7% (8,081) |
| Mechanicsville: | 2.5% (39) |
| Virginia: | 0.8% (8,513) |
| Mechanicsville: | 2.5% (39) |
| Virginia: | 0.5% (5,147) |
| Mechanicsville: | 2.2% (34) |
| Virginia: | 0.3% (3,713) |
| Mechanicsville: | 2.1% (33) |
| Virginia: | 0.4% (4,301) |
| Mechanicsville: | 2.0% (31) |
| Virginia: | 0.3% (3,058) |
| Mechanicsville: | 1.7% (26) |
| Virginia: | 0.1% (1,592) |
| Mechanicsville: | 1.6% (25) |
| Virginia: | 0.8% (8,805) |
| Mechanicsville: | 1.5% (24) |
| Virginia: | 2.3% (24,582) |
Place of birth for U.S.-born residents:
- This state: 28,127
- Other state: 9,407
- Northeast: 3,118
- Midwest: 1,763
- South: 3,563
- West: 944
92.1% of Mechanicsville residents lived in the same house 1 years ago.
Out of people who lived in different houses, 40.6% lived in this county.
Out of people who lived in different counties, 79.6% lived in Virginia.
| Mechanicsville: | 92.1% |
| State average: | 86.6% |
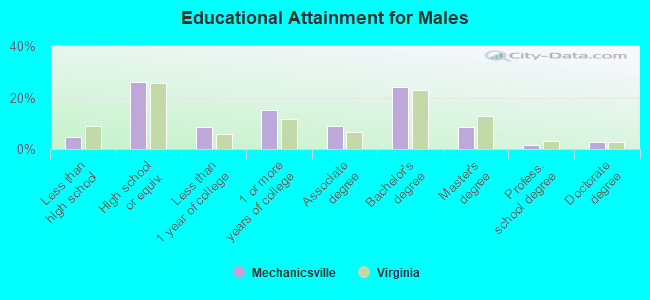
Education attainment for males 25 years and older:
- No schooling: 63
- Nursery to 4th grade: 0
- 5th and 6th grade: 25
- 7th and 8th grade: 58
- 9th grade: 142
- 10th grade: 121
- 11th grade: 116
- 12th grade, no diploma: 66
- High school graduate (or equivalency): 3,322
- Less than 1 year of college: 1,100
- Some college more than 1 year, no degree: 1,962
- Associate degree: 1,122
- Bachelor's degree: 3,089
- Master's degree: 1,103
- Professional school degree: 175
- Doctorate degree: 370
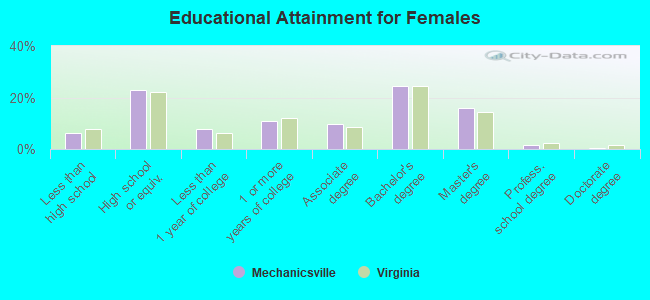
Education attainment for females 25 years and older:
- No schooling: 180
- Nursery to 4th grade: 47
- 5th and 6th grade: 0
- 7th and 8th grade: 35
- 9th grade: 32
- 10th grade: 54
- 11th grade: 197
- 12th grade, no diploma: 361
- High school graduate (or equivalency): 3,356
- Less than 1 year of college: 1,151
- Some college more than 1 year, no degree: 1,572
- Associate degree: 1,395
- Bachelor's degree: 3,565
- Master's degree: 2,342
- Professional school degree: 209
- Doctorate degree: 79
Housing units in structures:
- One, detached: 12,988
- One, attached: 1,048
- Two: 24
- 3 or 4: 210
- 5 to 9: 500
- 10 to 19: 864
- 20 to 49: 40
- 50 or more: 525
- Mobile homes: 16
Housing units lacking complete kitchen facilities in 2022: 2.4%
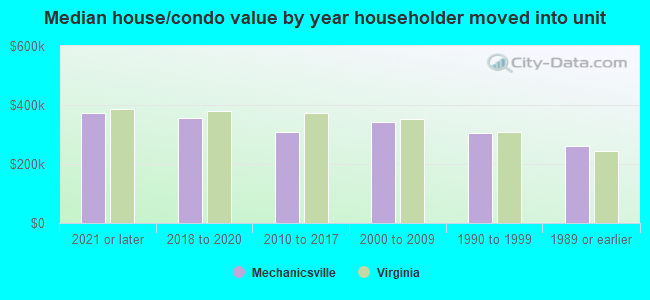
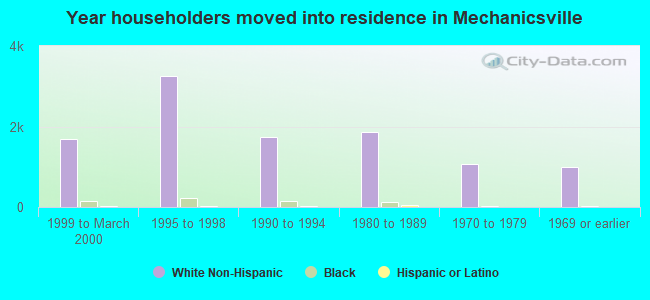
House/condo owner moved in on average 12 years ago
Renter moved in on average 2 years ago
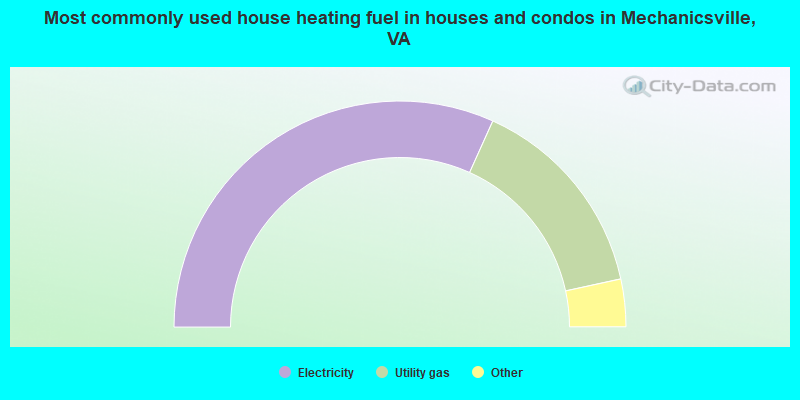
- 63.5%Electricity
- 29.7%Utility gas
- 3.4%Fuel oil, kerosene, etc.
- 2.5%Bottled, tank, or LP gas
- 0.4%No fuel used
- 0.2%Other fuel
- 0.1%Wood
- 0.1%Solar energy
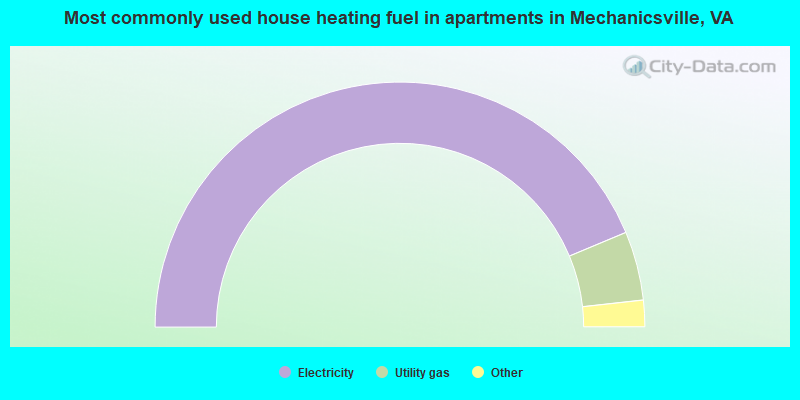
- 87.4%Electricity
- 9.1%Utility gas
- 1.6%Fuel oil, kerosene, etc.
- 1.0%Bottled, tank, or LP gas
- 0.6%Wood
- 0.4%No fuel used
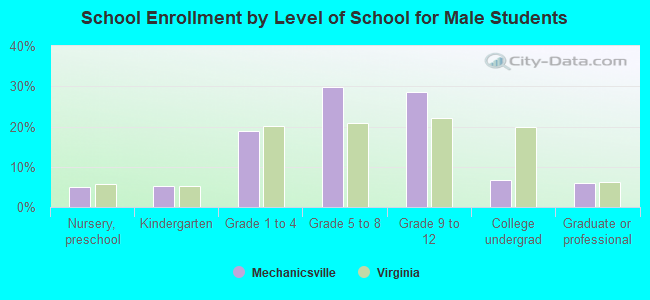
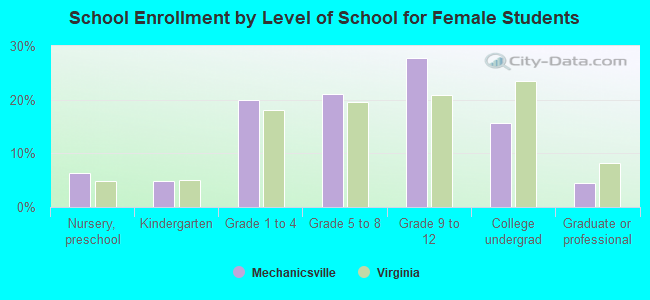
Private vs. public school enrollment:
| Here: | 7.1% |
| Virginia: | 13.2% |
| Here: | 11.8% |
| Virginia: | 10.2% |
| Here: | 36.0% |
| Virginia: | 18.7% |