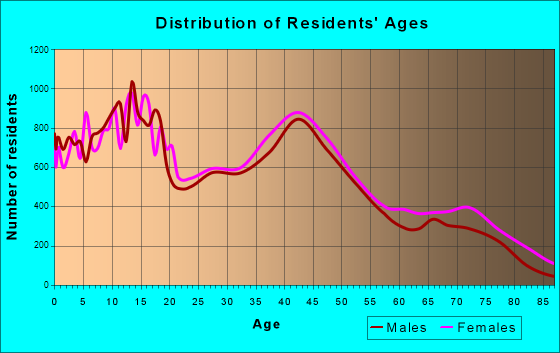
Midland, TX (Texas) Houses and Residents
Estimated median house or condo value in 2022: $289,200 (it was $71,400 in 2000 )
Midland:
$289,200Texas:
$275,400
Lower value quartile - upper value quartile: $198,700 - $390,500Total population: 128,037 (Urban population: 93,688, Rural population: 1,467 (all nonfarm) )
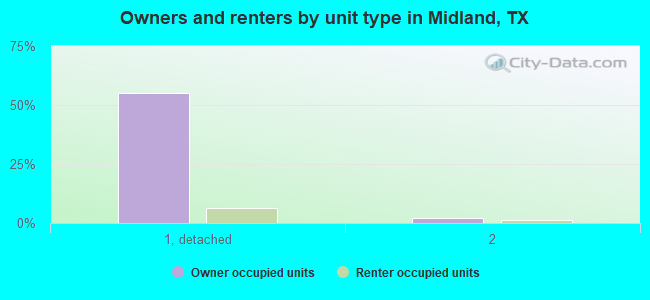
Houses: 57,877 (54,838 occupied: 33,860 owner occupied, 20,978 renter occupied )
% of renters here:
38%State:
38%
Housing density: 869 houses/condos per square mile
Median price asked for vacant for-sale houses and condos in 2022: $393,779.
Median contract rent in 2022: $1,135 (lower quartile is $873, upper quartile is $1,409)
Median rent asked for vacant for-rent units in 2022: $956
Median gross rent in Midland, TX in 2022: $1,270
Housing units in Midland with a mortgage: 19,114 (446 second mortgage, 0 home equity loan, 350 both second mortgage and home equity loan )Houses without a mortgage: 142
Median household income for houses/condos with a mortgage: $118,669
Median household income for apartments without a mortgage: $84,059
Median monthly housing costs: $1,304
Data:
Median house or condo value ($)
Median house or condo value ($ change since 2000)
Median house or condo value ($) - White
Median house or condo value ($) - Black or African American
Median house or condo value ($) - Asian
Median house or condo value ($) - Hispanic or Latino
Median house or condo value ($) - American Indian and Alaska Native
Median house or condo value ($) - Multirace
Median house or condo value ($) - Other Race
Median price asked for mobile homes ($)
Household density (households per square mile)
Mean house or condo value by units in structure - 1, detached ($)
Mean house or condo value by units in structure - 1, attached ($)
Mean house or condo value by units in structure - 2 ($)
Mean house or condo value by units in structure by units in structure - 3 or 4 ($)
Mean house or condo value by units in structure - 5 or more ($)
Mean house or condo value by units in structure - Boat, RV, van, etc. ($)
Mean house or condo value by units in structure - Mobile home ($)
Median contract rent ($)
Median contract rent - Lower quartile ($)
Median contract rent - Upper quartile ($)
Median gross rent ($)
Urban houses (%)
Rural houses (%)
Houses occupied (%)
Houses occupied (% change since 2000)
Houses owner occupied (%)
Houses owner occupied (% change since 2000)
Houses renter occupied (%)
Houses renter occupied (% change since 2000)
Vacant housing units - For rent (%)
Vacant housing units - For rent (% change since 2000)
Vacant housing units - For sale only (%)
Vacant housing units - For sale only (% change since 2000)
Vacant housing units - Rented or sold, not occupied (%)
Vacant housing units - Rented or sold, not occupied (% change since 2000)
Vacant housing units - For seasonal, recreational, or occasional use (%)
Vacant housing units - For seasonal, recreational, or occasional use (% change since 2000)
Vacant housing units - For migrant workers (%)
Vacant housing units - For migrant workers (% change since 2000)
Vacant housing units - Other vacant (%)
Vacant housing units - Other vacant (% change since 2000)
Median monthly housing costs ($)
Median household income for houses/condos with a mortgage ($)
Median household income for houses/condos without a mortgage ($)
Median household income ($)
Median household income ($) - White
Median household income ($) - Black or African American
Median household income ($) - Asian
Median household income ($) - Hispanic or Latino
Median household income ($) - American Indian and Alaska Native
Median household income ($) - Multirace
Median household income ($) - Other Race
Mortgage status - with mortgage (%)
Mortgage status - with second mortgage (%)
Mortgage status - with home equity loan (%)
Mortgage status - with both second mortgage and home equity loan (%)
Mortgage status - without a mortgage (%)
Median year house/condo built
Median year apartment built
Household type by relationship - Male householder living alone (%)
Household type by relationship - Male householder not living alone (%)
Household type by relationship - Female householder living alone (%)
Household type by relationship - Female householder not living alone (%)
Household type by relationship - Opposite-Sex spouse (%)
Household type by relationship - Same-Sex spouse (%)
Household type by relationship - Opposite-Sex unmarried partner (%)
Household type by relationship - Same-Sex unmarried partner (%)
Household type by relationship - In group quarters (%)
Size of family households - 2-person household (%)
Size of family households - 3-person household (%)
Size of family households - 4-person household (%)
Size of family households - 5-person household (%)
Size of family households - 6-person household (%)
Size of family households - 7-or-more-person household (%)
Size of nonfamily households - 1-person household (%)
Size of nonfamily households - 2-person household (%)
Size of nonfamily households - 3-person household (%)
Size of nonfamily households - 4-person household (%)
Size of nonfamily households - 5-person household (%)
Size of nonfamily households - 6-person household (%)
Size of nonfamily households - 7-or-moreperson household (%)
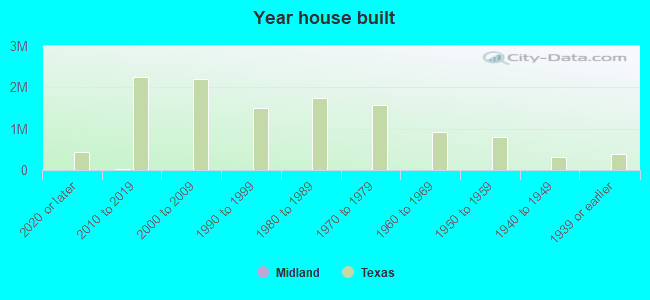
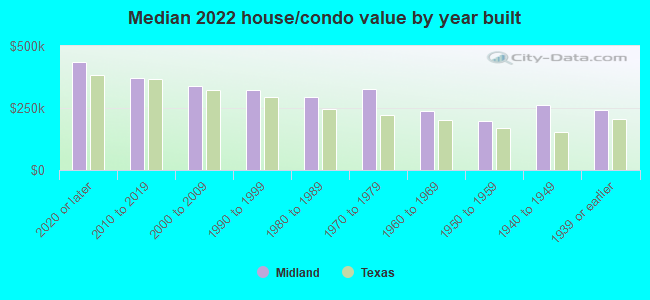
Year house built - Built 2010 or later (%)
Year house built - Built 2000 to 2009 (%)
Year house built - Built 1990 to 1999 (%)
Year house built - Built 1980 to 1989 (%)
Year house built - Built 1970 to 1979 (%)
Year house built - Built 1960 to 1969 (%)
Year house built - Built 1950 to 1959 (%)
Year house built - Built 1940 to 1949 (%)
Year house built - Built 1939 or earlier (%)
Median number of rooms in houses and condos
Median number of rooms in apartments
Median number of bedrooms in owner occupied houses
Mean number of bedrooms in owner occupied houses
Median number of bedrooms in renter occupied houses
Mean number of bedrooms in renter occupied houses
Median number of vehichles in owner occupied houses
Mean number of vehichles in owner occupied houses
Median number of vehichles in renter occupied houses
Mean number of vehichles in renter occupied houses
Rooms in owner-occupied houses - 1 room (%)
Rooms in owner-occupied houses - 2 rooms (%)
Rooms in owner-occupied houses - 3 rooms (%)
Rooms in owner-occupied houses - 4 rooms (%)
Rooms in owner-occupied houses - 5 rooms (%)
Rooms in owner-occupied houses - 6 rooms (%)
Rooms in owner-occupied houses - 7 rooms (%)
Rooms in owner-occupied houses - 8 rooms (%)
Rooms in owner-occupied houses - 9+ rooms (%)
Rooms in renter-occupied houses - 1 room (%)
Rooms in renter-occupied houses - 2 rooms (%)
Rooms in renter-occupied houses - 3 rooms (%)
Rooms in renter-occupied houses - 4 rooms (%)
Rooms in renter-occupied houses - 5 rooms (%)
Rooms in renter-occupied houses - 6 rooms (%)
Rooms in renter-occupied houses - 7 rooms (%)
Rooms in renter-occupied houses - 8 rooms (%)
Rooms in renter-occupied houses - 9+ rooms (%)
Bedrooms in owner-occupied houses - no bedrooms (%)
Bedrooms in owner-occupied houses - 1 bedroom (%)
Bedrooms in owner-occupied houses - 2 bedrooms (%)
Bedrooms in owner-occupied houses - 3 bedrooms (%)
Bedrooms in owner-occupied houses - 4 bedrooms (%)
Bedrooms in owner-occupied houses - 5+ bedrooms (%)
Bedrooms in renter-occupied houses - no bedrooms (%)
Bedrooms in renter-occupied houses - 1 bedroom (%)
Bedrooms in renter-occupied houses - 2 bedrooms (%)
Bedrooms in renter-occupied houses - 3 bedrooms (%)
Bedrooms in renter-occupied houses - 4 bedrooms (%)
Bedrooms in renter-occupied houses - 5+ bedrooms (%)
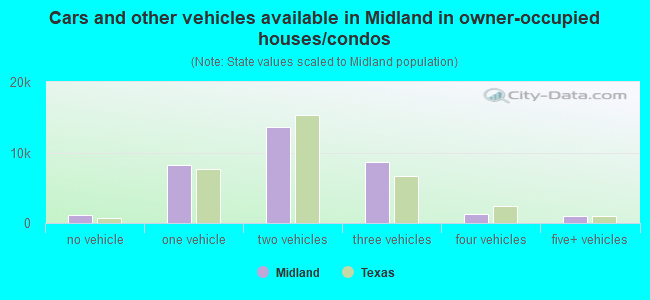
Vehicles available in owner-occupied houses - no vehicle available (%)
Vehicles available in owner-occupied houses - 1 vehicle available(%)
Vehicles available in owner-occupied houses - 2 Vehicles available (%)
Vehicles available in owner-occupied houses - 3 Vehicles available (%)
Vehicles available in owner-occupied houses - 4 Vehicles available (%)
Vehicles available in owner-occupied houses - 5+ Vehicles available (%)
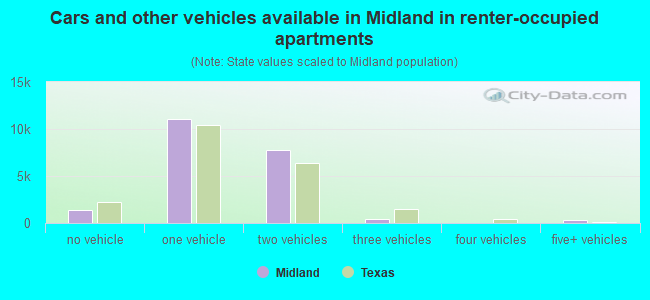
Vehicles available in renter-occupied houses - no vehicle available (%)
Vehicles available in renter-occupied houses - 1 vehicle available (%)
Vehicles available in renter-occupied houses - 2 Vehicles available (%)
Vehicles available in renter-occupied houses - 3 Vehicles available (%)
Vehicles available in renter-occupied houses - 4 Vehicles available (%)
Vehicles available in renter-occupied houses - 5+ Vehicles available (%)
Housing units in structures - 1, detached (%)
Housing units in structures - 1, attached (%)
Housing units in structures - 2 (%)
Housing units in structures - 3 or 4 (%)
Housing units in structures - 5 to 9 (%)
Housing units in structures - 10 to 19 (%)
Housing units in structures - 20 to 49 (%)
Housing units in structures - 50 or more (%)
Housing units in structures - Mobile home (%)
Housing units in structures - Boat, RV, van, etc. (%)
Housing units in structures - Owners - 1, detached (%)
Housing units in structures - Owners - 1, attached (%)
Housing units in structures - Owners - 2 (%)
Housing units in structures - Owners - 3 or 4 (%)
Housing units in structures - Owners - 5 to 9 (%)
Housing units in structures - Owners - 10 to 19 (%)
Housing units in structures - Owners - 20 to 49 (%)
Housing units in structures - Owners - 50 or more (%)
Housing units in structures - Owners - Mobile home (%)
Housing units in structures - Owners - Boat, RV, van, etc. (%)
Housing units in structures - Renters - 1, detached (%)
Housing units in structures - Renters - 1, attached (%)
Housing units in structures - Renters - 2 (%)
Housing units in structures - Renters - 3 or 4 (%)
Housing units in structures - Renters - 5 to 9 (%)
Housing units in structures - Renters - 10 to 19 (%)
Housing units in structures - Renters - 20 to 49 (%)
Housing units in structures - Renters - 50 or more (%)
Housing units in structures - Renters - Mobile home (%)
Housing units in structures - Renters - Boat, RV, van, etc. (%)
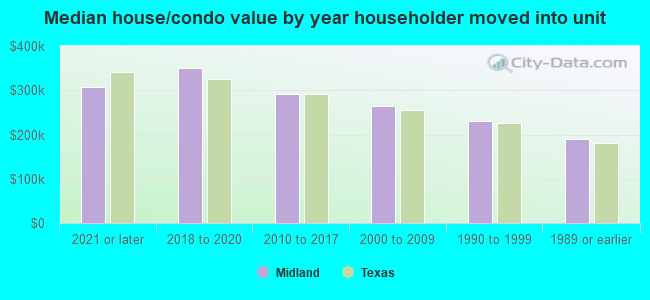
House/condo owner moved in on average (years ago)
Renter moved in on average (years ago)
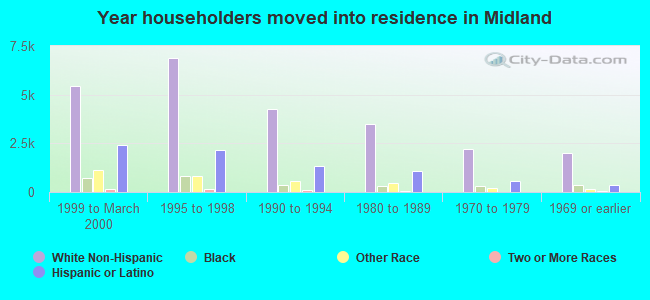
Year householder moved into unit - Moved in 1999 to March 2000 (%)
Year householder moved into unit - Moved in 1999 to March 2000 (%) - White
Year householder moved into unit - Moved in 1999 to March 2000 (%) - Black or African American
Year householder moved into unit - Moved in 1999 to March 2000 (%) - Asian
Year householder moved into unit - Moved in 1999 to March 2000 (%) - Hispanic or Latino
Year householder moved into unit - Moved in 1999 to March 2000 (%) - American Indian and Alaska Native
Year householder moved into unit - Moved in 1999 to March 2000 (%) - Multirace
Year householder moved into unit - Moved in 1999 to March 2000 (%) - Other Race
Year householder moved into unit - Moved in 1995 to 1998 (%)
Year householder moved into unit - Moved in 1995 to 1998 (%) - White
Year householder moved into unit - Moved in 1995 to 1998 (%) - Black or African American
Year householder moved into unit - Moved in 1995 to 1998 (%) - Asian
Year householder moved into unit - Moved in 1995 to 1998 (%) - Hispanic or Latino
Year householder moved into unit - Moved in 1995 to 1998 (%) - American Indian and Alaska Native
Year householder moved into unit - Moved in 1995 to 1998 (%) - Multirace
Year householder moved into unit - Moved in 1995 to 1998 (%) - Other Race
Year householder moved into unit - Moved in 1990 to 1994 (%)
Year householder moved into unit - Moved in 1990 to 1994 (%) - White
Year householder moved into unit - Moved in 1990 to 1994 (%) - Black or African American
Year householder moved into unit - Moved in 1990 to 1994 (%) - Asian
Year householder moved into unit - Moved in 1990 to 1994 (%) - Hispanic or Latino
Year householder moved into unit - Moved in 1990 to 1994 (%) - American Indian and Alaska Native
Year householder moved into unit - Moved in 1990 to 1994 (%) - Multirace
Year householder moved into unit - Moved in 1990 to 1994 (%) - Other Race
Year householder moved into unit - Moved in 1980 to 1989 (%)
Year householder moved into unit - Moved in 1980 to 1989 (%) - White
Year householder moved into unit - Moved in 1980 to 1989 (%) - Black or African American
Year householder moved into unit - Moved in 1980 to 1989 (%) - Asian
Year householder moved into unit - Moved in 1980 to 1989 (%) - Hispanic or Latino
Year householder moved into unit - Moved in 1980 to 1989 (%) - American Indian and Alaska Native
Year householder moved into unit - Moved in 1980 to 1989 (%) - Multirace
Year householder moved into unit - Moved in 1980 to 1989 (%) - Other Race
Year householder moved into unit - Moved in 1970 to 1979 (%)
Year householder moved into unit - Moved in 1970 to 1979 (%) - White
Year householder moved into unit - Moved in 1970 to 1979 (%) - Black or African American
Year householder moved into unit - Moved in 1970 to 1979 (%) - Asian
Year householder moved into unit - Moved in 1970 to 1979 (%) - Hispanic or Latino
Year householder moved into unit - Moved in 1970 to 1979 (%) - American Indian and Alaska Native
Year householder moved into unit - Moved in 1970 to 1979 (%) - Multirace
Year householder moved into unit - Moved in 1970 to 1979 (%) - Other Race
Year householder moved into unit - Moved in 1969 or earlier (%)
Year householder moved into unit - Moved in 1969 or earlier (%) - White
Year householder moved into unit - Moved in 1969 or earlier (%) - Black or African American
Year householder moved into unit - Moved in 1969 or earlier (%) - Asian
Year householder moved into unit - Moved in 1969 or earlier (%) - Hispanic or Latino
Year householder moved into unit - Moved in 1969 or earlier (%) - American Indian and Alaska Native
Year householder moved into unit - Moved in 1969 or earlier (%) - Multirace
Year householder moved into unit - Moved in 1969 or earlier (%) - Other Race
Housing units lacking complete plumbing facilities (%)
Housing units lacking complete kitchen facilities (%)
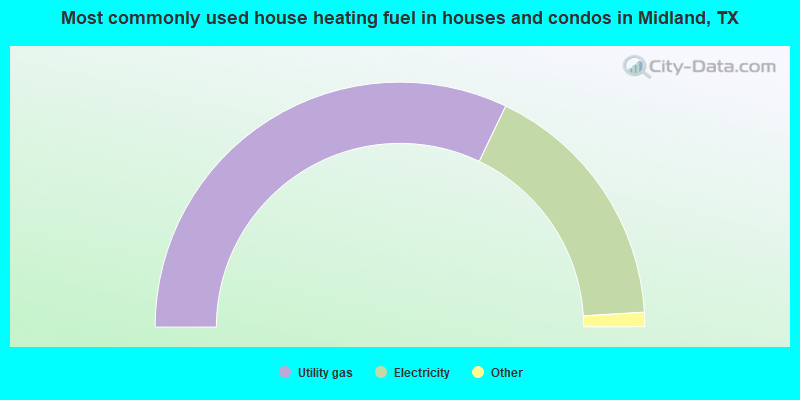
House heating fuel used in houses and condos - Utility gas (%)
House heating fuel used in houses and condos - Bottled, tank, or LP gas (%)
House heating fuel used in houses and condos - Electricity (%)
House heating fuel used in houses and condos - Fuel oil, kerosene, etc. (%)
House heating fuel used in houses and condos - Coal or coke (%)
House heating fuel used in houses and condos - Wood (%)
House heating fuel used in houses and condos - Solar energy (%)
House heating fuel used in houses and condos - Other fuel (%)
House heating fuel used in houses and condos - No fuel used (%)
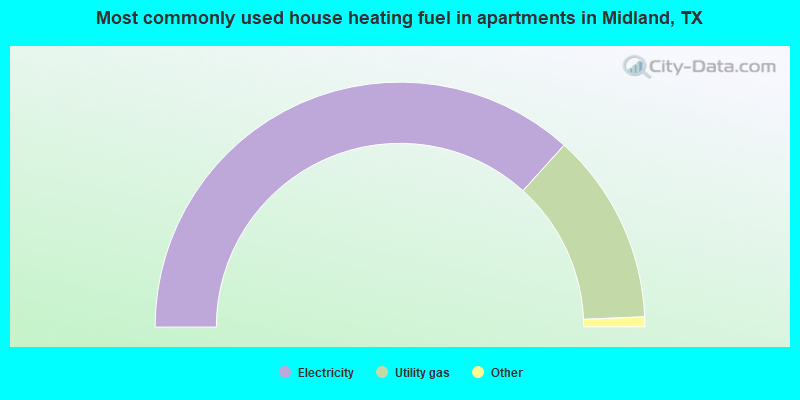
House heating fuel used in apartments - Utility gas (%)
House heating fuel used in apartments - Bottled, tank, or LP gas (%)
House heating fuel used in apartments - Electricity (%)
House heating fuel used in apartments - Fuel oil, kerosene, etc. (%)
House heating fuel used in apartments - Coal or coke (%)
House heating fuel used in apartments - Wood (%)
House heating fuel used in apartments - Solar energy (%)
House heating fuel used in apartments - Other fuel (%)
House heating fuel used in apartments - No fuel used (%)
Latest news about housing in Midland, TX collected exclusively by city-data.com from local newspapers, TV, and radio stations
Median year house/condo built: 1986Median year apartment built: 1999Household type by relationship:
Households: 134,398
Male householders: 26,807 (9,243 living alone ), Female householders: 28,031 (8,947 living alone )25,719 spouses (25,719 opposite-sex spouses ), 3,806 unmarried partners , (3,411 opposite-sex unmarried partners ), 41,510 children (38,599 natural , 1,288 adopted , 1,623 stepchildren ), 4,541 grandchildren , 450 brothers or sisters , 738 parents , 0 foster children , 273 other relatives , 889 non-relatives In group quarters: 1,634
Size of family households: 11,268 2-persons , 8,199 3-persons , 8,256 4-persons , 4,455 5-persons , 1,848 6-persons , 438 7-or-more-persons .
Size of nonfamily households: 18,190 1-person , 2,072 2-persons , 43 3-persons , 69 4-persons .
28,224 married couples with children. single-parent households (1,668 men , 7,400 women ).
68.0% of residents of Midland speak English at home. of residents speak Spanish at home (65% speak English very well , 17% speak English well , 11% speak English not well , 7% don't speak English at all ).of residents speak other Indo-European language at home (86% speak English very well , 14% speak English well ).of residents speak Asian or Pacific Island language at home (53% speak English very well , 22% speak English well , 15% speak English not well , 10% don't speak English at all ).of residents speak other language at home (74% speak English very well , 14% speak English well , 9% speak English not well , 4% don't speak English at all ).
Foreign born population: 15,012 (11.2%)of them are naturalized citizens )
Median number of rooms in houses and condos:
Median number of rooms in apartments
Owner-occupied Renter-occupied
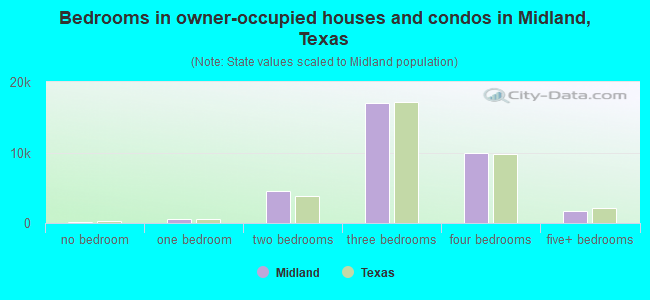
Bedrooms in owner-occupied houses and condos in Midland, Texas
193 no bedroom 538 1 bedroom 4,516 2 bedrooms 16,994 3 bedrooms 9,980 4 bedrooms 1,639 5+ bedrooms
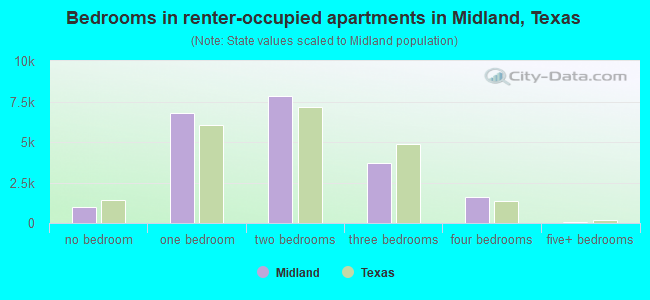
Bedrooms in renter-occupied apartments in Midland, Texas
984 no bedroom 6,804 1 bedroom 7,833 2 bedrooms 3,707 3 bedrooms 1,587 4 bedrooms 63 5+ bedrooms
Owner-occupied Renter-occupied
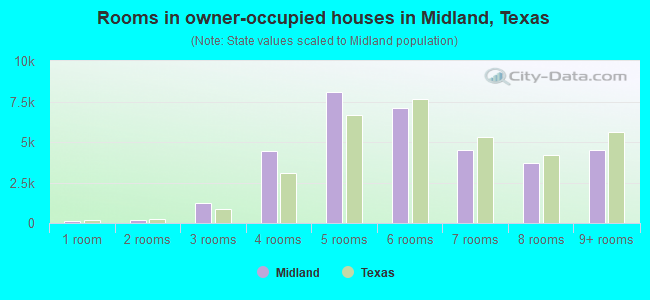
Rooms in owner-occupied houses in Midland, Texas
94 1 room 192 2 rooms 1,235 3 rooms 4,415 4 rooms 8,097 5 rooms 7,111 6 rooms 4,504 7 rooms 3,678 8 rooms 4,534 9+ rooms
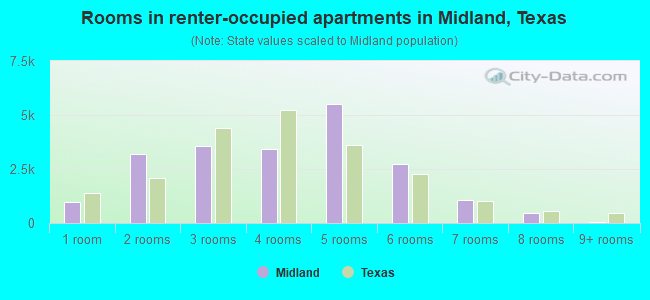
Rooms in renter-occupied apartments in Midland, Texas
984 1 room 3,196 2 rooms 3,543 3 rooms 3,434 4 rooms 5,505 5 rooms 2,709 6 rooms 1,084 7 rooms 460 8 rooms 63 9+ rooms
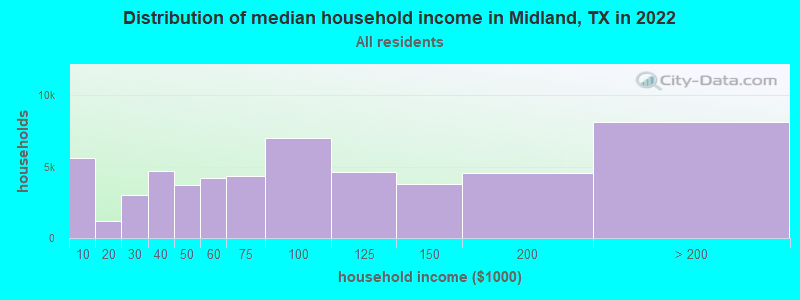
Midland, TX household income distribution 5,617 Less than $10,0001,207 $10,000 to $19,9992,999 $20,000 to $29,9994,689 $30,000 to $39,9993,692 $40,000 to $49,9994,184 $50,000 to $59,9994,366 $60,000 to $74,9997,007 $75,000 to $99,9994,647 $100,000 to $124,9993,758 $125,000 to $149,9994,534 $150,000 to $199,9998,138 $200,000 or more
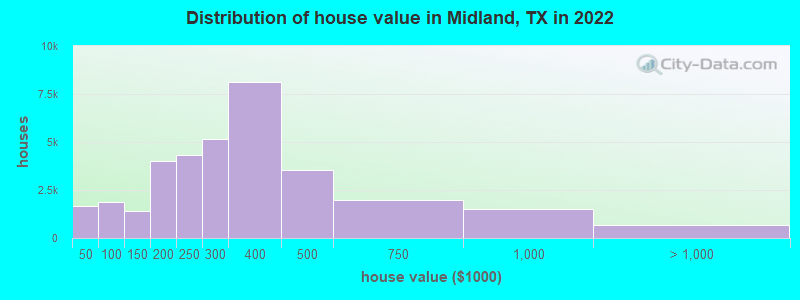
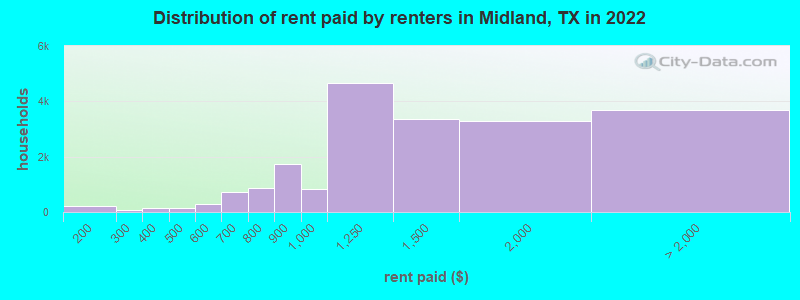
Home value of owner - occupied houses in 2022 in Midland, TX 213 Less than $10,000364 $10,000 to $14,999184 $15,000 to $19,999128 $20,000 to $24,999356 $25,000 to $29,99976 $35,000 to $39,999332 $40,000 to $49,999262 $50,000 to $59,999278 $60,000 to $69,999814 $80,000 to $89,999174 $90,000 to $99,999290 $100,000 to $124,9991,119 $125,000 to $149,9991,619 $150,000 to $174,9992,379 $175,000 to $199,9994,309 $200,000 to $249,9995,139 $250,000 to $299,9998,128 $300,000 to $399,9993,545 $400,000 to $499,9991,967 $500,000 to $749,9991,520 $750,000 to $999,999554 $1,000,000 to $1,499,99947 $1,500,000 to $1,999,99963 $2,000,000 or moreRent paid by renters in 2022 in Midland, TX 190 $100 to $14930 $150 to $19940 $200 to $24929 $250 to $299126 $300 to $34922 $350 to $39916 $400 to $449112 $450 to $499146 $500 to $549147 $550 to $599442 $600 to $649294 $650 to $699461 $700 to $749416 $750 to $7991,722 $800 to $899825 $900 to $9994,654 $1,000 to $1,2493,349 $1,250 to $1,4993,290 $1,500 to $1,9991,942 $2,000 to $2,499680 $2,500 to $2,99949 $3,000 to $3,49972 $3,500 or more949 No cash rent
Percentage of workers working in this county: 91.1%Number of people working at home: 5,186 (7.4% of all workers )
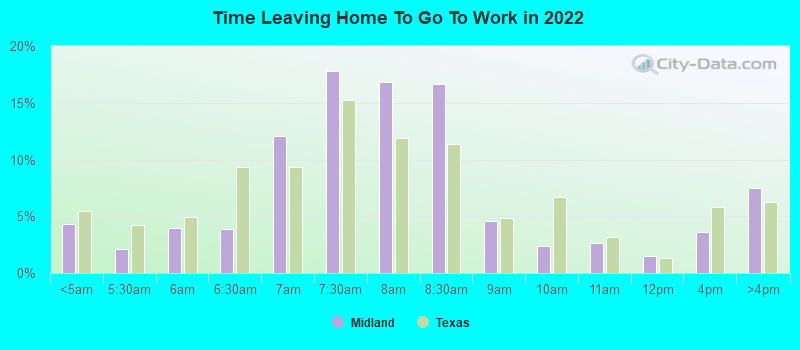
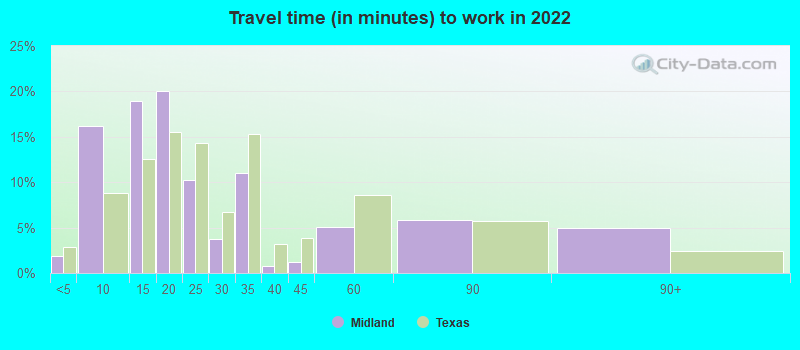
Travel time to work (commute)
Less than 5 minutes: 1,1395 to 9 minutes: 11,05410 to 14 minutes: 13,03915 to 19 minutes: 15,02020 to 24 minutes: 7,60425 to 29 minutes: 1,32130 to 34 minutes: 4,97735 to 39 minutes: 63640 to 44 minutes: 77745 to 59 minutes: 1,59060 to 89 minutes: 1,87790 or more minutes: 2,105
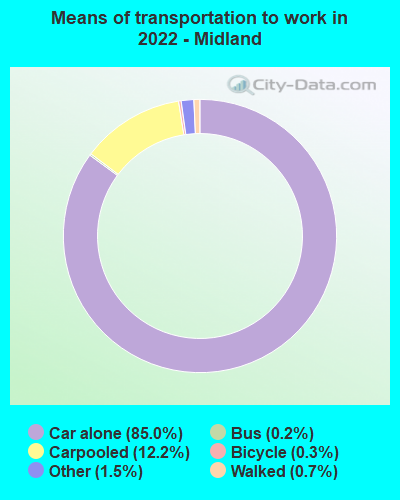
Means of transportation to work:
Drove a car alone: 62,624 (76.7%)Carpooled: 9,799 (12.0%)Bus : 129 (0.2%)Taxi: 1,405 (1.7%)Bicycle: 238 (0.3%)Walked: 562 (0.7%)Worked at home: 5,186 (6.4%)
Unemployment by race in 2022
Unemployment rate for White non-Hispanic residents 2.6% Males2.0% FemalesUnemployment rate for Black residents 3.4% Males2.1% FemalesUnemployment rate for American Indian and Alaska Native residents 6.4% MalesUnemployment rate for Asian residents 9.2% Males7.7% FemalesUnemployment rate for other race residents 1.2% Males2.0% FemalesUnemployment rate for two or more race residents 4.4% Males5.0% FemalesUnemployment rate for Hispanic or Latino residents 3.6% Males5.9% Females
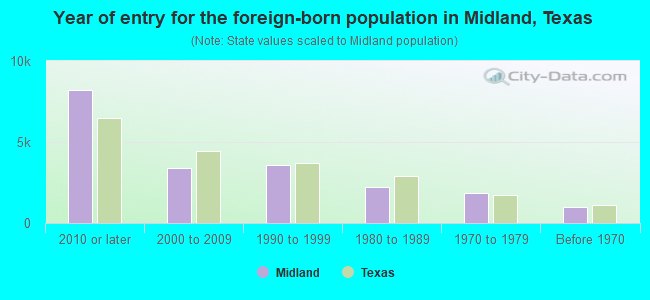
Year of entry for the foreign-born population in Midland, Texas
8,229 2010 or later 3,407 2000 to 2009 3,585 1990 to 1999 2,249 1980 to 1989 1,880 1970 to 1979 959 Before 1970
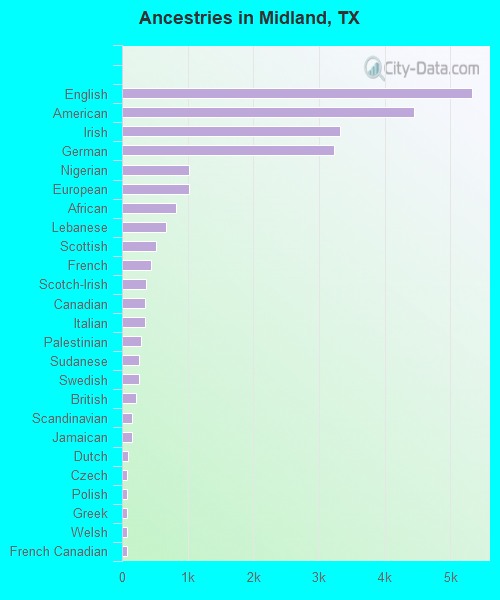
First ancestries reported:
English: 5,325 (6.6%)
American: 4,456 (5.5%)
Irish: 3,320 (4.1%)
German: 3,227 (4.0%)
Nigerian: 1,026 (1.3%)
European: 1,014 (1.3%)
African: 826 (1.0%)
Lebanese: 669 (0.8%)
Scottish: 524 (0.6%)
French: 436 (0.5%)
Scotch-Irish: 361 (0.4%)
Canadian: 357 (0.4%)
Italian: 354 (0.4%)
Palestinian: 294 (0.4%)
Sudanese: 255 (0.3%)
Swedish: 254 (0.3%)
British: 208 (0.3%)
Scandinavian: 158 (0.2%)
Jamaican: 145 (0.2%)
Dutch: 87 (0.1%)
Czech: 82 (0.1%)
Polish: 80 (0.10%)
Greek: 76 (0.09%)
Welsh: 71 (0.09%)
French Canadian: 69 (0.09%)
West Indian: 60 (0.07%)
Guyanese: 57 (0.07%)
Eastern European: 57 (0.07%)
Norwegian: 56 (0.07%)
Northern European: 53 (0.07%)
Russian: 47 (0.06%)
South African: 46 (0.06%)
Czechoslovakian: 36 (0.04%)
Ukrainian: 36 (0.04%)
Slovak: 34 (0.04%)
Australian: 28 (0.03%)
Cajun: 27 (0.03%)
Hungarian: 26 (0.03%)
Ghanaian: 26 (0.03%)
Iranian: 26 (0.03%)
Albanian: 23 (0.03%)
Bermudan: 23 (0.03%)
Romanian: 19 (0.02%)
Egyptian: 15 (0.02%)
Danish: 14 (0.02%)
Brazilian: 10 (0.01%)
Austrian: 7 (0.01%)
Croatian: 6 (0.01%)
Most common places of birth for foreign-born residents (%): Mexico Midland:
56.2% (10,918)Texas:
48.4% (2,411,723)
Cuba Midland:
6.9% (1,337)Texas:
1.3% (62,978)
Canada Midland:
4.0% (784)Texas:
1.1% (55,371)
Nigeria Midland:
3.5% (680)Texas:
1.9% (96,110)
Cambodia Midland:
2.9% (564)Texas:
0.2% (9,997)
China, excluding Hong Kong and Taiwan Midland:
2.7% (529)Texas:
2.3% (115,558)
El Salvador Midland:
2.0% (380)Texas:
4.5% (224,455)
Philippines Midland:
1.8% (353)Texas:
2.1% (103,148)
Venezuela Midland:
1.8% (344)Texas:
1.5% (72,413)
Place of birth for U.S.-born residents:
This state: 93,358Other state: 24,471Northeast: 1,703Midwest: 5,375South: 6,245West: 11,148 83.3% of Midland residents lived in the same house 1 years ago.
Out of people who lived in different houses, 32.9% lived in this county.
Out of people who lived in different counties, 72.3% lived in Texas.
Midland:
83.3%State average:
85.7%
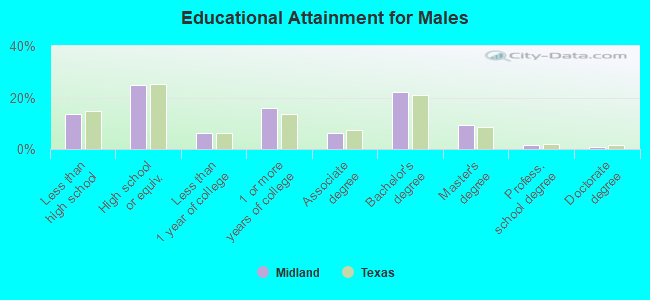
Education attainment for males 25 years and older:
No schooling: 1,343Nursery to 4th grade: 7555th and 6th grade: 6457th and 8th grade: 4669th grade: 33710th grade: 18711th grade: 91012th grade, no diploma: 893High school graduate (or equivalency): 10,057Less than 1 year of college: 2,517Some college more than 1 year, no degree: 6,433Associate degree: 2,461Bachelor's degree: 9,002Master's degree: 3,773Professional school degree: 609Doctorate degree: 303
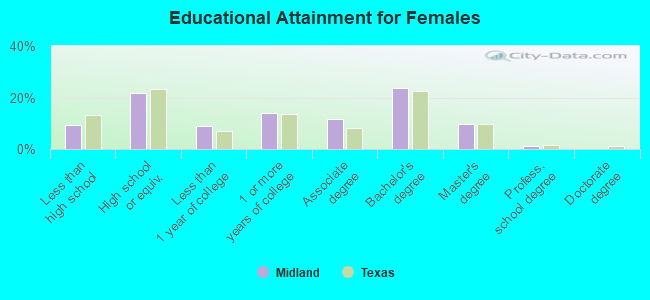
Education attainment for females 25 years and older:
No schooling: 591Nursery to 4th grade: 835th and 6th grade: 5097th and 8th grade: 1009th grade: 92510th grade: 67211th grade: 34212th grade, no diploma: 664High school graduate (or equivalency): 9,142Less than 1 year of college: 3,741Some college more than 1 year, no degree: 5,842Associate degree: 4,916Bachelor's degree: 9,884Master's degree: 3,985Professional school degree: 428Doctorate degree: 42
Housing units in structures:
One, detached: 34,691One, attached: 1,824Two: 1,8963 or 4: 2,5985 to 9: 5,37810 to 19: 3,55220 to 49: 1,72150 or more: 4,936Mobile homes: 1,281Median worth of mobile homes: $92,341
Housing units lacking complete plumbing facilities in 2022: 1.5%Housing units lacking complete kitchen facilities in 2022: 1.7%House/condo owner moved in on average 7 years ago
Renter moved in on average 0 years ago
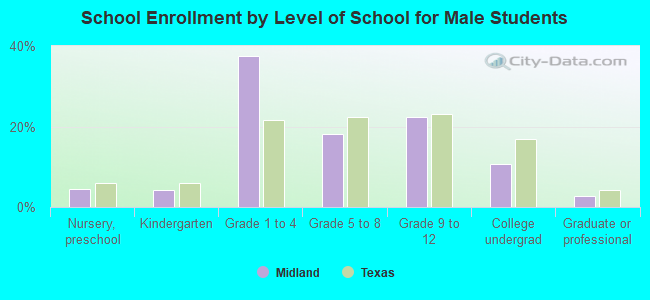
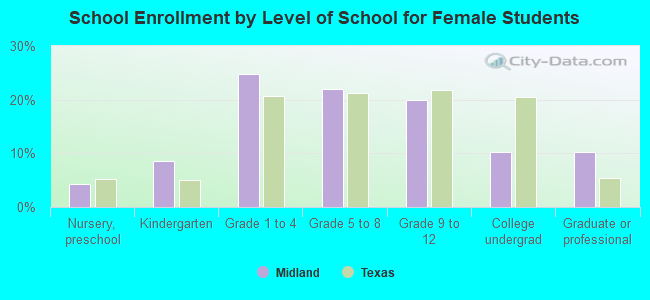
Private vs. public school enrollment:
Students in private schools in grades 1 to 8 (elementary and middle school): 2,946 Students in private schools in grades 9 to 12 (high school): 1,099 Students in private undergraduate colleges: 195