Midlothian, IL (Illinois) Houses and Residents
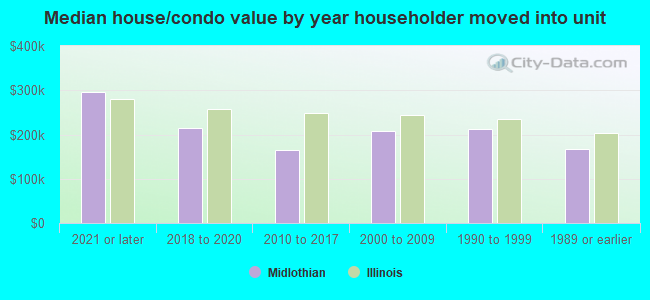
| Midlothian: | $187,079 |
| Illinois: | $251,600 |
Total population: 14,911 (Urban population: 14,222, Rural population: 0)
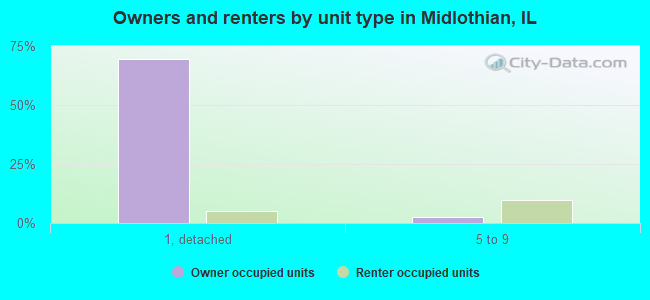
Houses: 5,988 (5,771 occupied: 4,519 owner occupied, 1,350 renter occupied)
| % of renters here: | 23% |
| State: | 33% |
Housing density: 2,116 houses/condos per square mile
Median price asked for vacant for-sale houses and condos in 2022: $1,537,775.
Median contract rent in 2022: $955 (lower quartile is $849, upper quartile is $1,243)
Median rent asked for vacant for-rent units in 2022: $808
Median gross rent in Midlothian, IL in 2022: $1,146
Housing units in Midlothian with a mortgage: 2,941 (191 second mortgage, 0 home equity loan, 181 both second mortgage and home equity loan)
Houses without a mortgage: 47
Median household income for houses/condos with a mortgage: $88,323
Median household income for apartments without a mortgage: $55,553
Median monthly housing costs: $1,227
Compare current foreclosures in Midlothian, IL:
| Photo | Address | Area | Beds / Baths | Price | Details |
|---|---|---|---|---|---|

|
#1
145th St
Midlothian, IL 60445
|
2,000 sq. feet
|
1 baths 3 beds |
$199,900
|
show details |

|
#2
Kedvale Ave
Midlothian, IL 60445
|
1,800 sq. feet
|
2 baths 3 beds |
show details | |

|
#3
Long Ave
Midlothian, IL 60445
|
1,051 sq. feet
|
1 baths - beds |
show details | |

|
#4
Kildare Ave
Midlothian, IL 60445
|
957 sq. feet
|
1 baths - beds |
show details | |

|
#5
Karlov Ave
Midlothian, IL 60445
|
1,132 sq. feet
|
1 baths - beds |
show details | |

|
#6
Ridgeway Ave
Midlothian, IL 60445
|
999 sq. feet
|
1 baths - beds |
show details | |

|
#7
Parkview Ct
Midlothian, IL 60445
|
1,808 sq. feet
|
2 baths - beds |
show details | |

|
#8
152nd St
Midlothian, IL 60445
|
1,087 sq. feet
|
1 baths - beds |
show details | |

|
#9
Kildare Ave
Midlothian, IL 60445
|
1,596 sq. feet
|
1 baths - beds |
show details | |

|
#10
144th Ct
Midlothian, IL 60445
|
1,201 sq. feet
|
1 baths - beds |
show details |
| Photo | Address | Area | Beds / Baths | Price | Details |
|---|---|---|---|---|---|

|
#11
Springfield Ave
Midlothian, IL 60445
|
1,219 sq. feet
|
1 baths - beds |
show details | |

|
#12
Millard Ave
Midlothian, IL 60445
|
1,024 sq. feet
|
1 baths - beds |
show details | |

|
#13
Keeler Ave
Midlothian, IL 60445
|
1,379 sq. feet
|
1 baths - beds |
show details | |

|
#14
Concordia Ct
Midlothian, IL 60445
|
1,209 sq. feet
|
2 baths - beds |
show details | |

|
#15
145th St
Midlothian, IL 60445
|
1,343 sq. feet
|
1 baths - beds |
show details | |

|
#16
Saint Louis Ave
Midlothian, IL 60445
|
1,107 sq. feet
|
1 baths - beds |
show details | |

|
#17
Hamlin Ave
Midlothian, IL 60445
|
1,002 sq. feet
|
1 baths - beds |
show details | |

|
#18
148th St
Midlothian, IL 60445
|
3,505 sq. feet
|
1 baths - beds |
show details | |

|
#19
147th St
Midlothian, IL 60445
|
1,268 sq. feet
|
2 baths - beds |
show details | |

|
#20
Kenneth Ave
Midlothian, IL 60445
|
1,184 sq. feet
|
1 baths - beds |
show details |
| Photo | Address | Area | Beds / Baths | Price | Details |
|---|---|---|---|---|---|

|
#21
Trumbull Ave
Midlothian, IL 60445
|
750 sq. feet
|
1 baths - beds |
show details | |

|
#22
Kenton Ave
Midlothian, IL 60445
|
1,166 sq. feet
|
1 baths - beds |
show details | |

|
#23
135th St
Midlothian, IL 60445
|
2,244 sq. feet
|
2 baths - beds |
show details | |

|
#24
Clifton Park Ave
Midlothian, IL 60445
|
1,107 sq. feet
|
1 baths - beds |
show details | |

|
#25
Tripp Ave
Midlothian, IL 60445
|
832 sq. feet
|
1 baths - beds |
show details | |

|
#26
Saint Louis Ave
Midlothian, IL 60445
|
1,358 sq. feet
|
1 baths - beds |
show details | |

|
#27
Millard Ave
Midlothian, IL 60445
|
1,021 sq. feet
|
1 baths - beds |
show details | |

|
#28
Kostner Ave
Midlothian, IL 60445
|
1,132 sq. feet
|
1 baths - beds |
show details | |

|
#29
Tripp Ave
Midlothian, IL 60445
|
1,040 sq. feet
|
1 baths - beds |
show details | |

|
#30
Tripp Ave
Midlothian, IL 60445
|
1,040 sq. feet
|
1 baths - beds |
show details |
| Photo | Address | Area | Beds / Baths | Price | Details |
|---|---|---|---|---|---|

|
#31
Sawyer Ave
Midlothian, IL 60445
|
1,459 sq. feet
|
2 baths - beds |
show details | |

|
#32
Trumbull Ave
Midlothian, IL 60445
|
880 sq. feet
|
1 baths - beds |
show details | |

|
#33
Kolin Ave
Midlothian, IL 60445
|
1,241 sq. feet
|
1 baths - beds |
show details | |

|
#34
Karlov Ave
Midlothian, IL 60445
|
1,132 sq. feet
|
2 baths - beds |
show details | |

|
#35
Knox Ave
Midlothian, IL 60445
|
1,022 sq. feet
|
2 baths - beds |
show details | |

|
#36
148th St
Midlothian, IL 60445
|
1,203 sq. feet
|
1 baths - beds |
show details | |

|
#37
151st St
Midlothian, IL 60445
|
1,290 sq. feet
|
1 baths - beds |
show details | |

|
#38
Ridgeway Ave
Midlothian, IL 60445
|
992 sq. feet
|
1 baths - beds |
show details | |

|
#39
Trumbull Ave
Midlothian, IL 60445
|
650 sq. feet
|
1 baths - beds |
show details | |

|
#40
Cottage Row
Midlothian, IL 60445
|
6,285 sq. feet
|
4 baths - beds |
show details |
| Photo | Address | Area | Beds / Baths | Price | Details |
|---|---|---|---|---|---|

|
#41
Kostner Ave
Midlothian, IL 60445
|
1,374 sq. feet
|
1 baths - beds |
show details | |

|
#42
Homan Ave
Midlothian, IL 60445
|
1,245 sq. feet
|
1 baths - beds |
show details | |

|
#43
148th Pl
Midlothian, IL 60445
|
588 sq. feet
|
1 baths - beds |
show details | |

|
#44
Kolmar Ave
Midlothian, IL 60445
|
711 sq. feet
|
2 baths - beds |
show details | |

|
#45
James Ln Apt 1404
Midlothian, IL 60445
|
- sq. feet
|
- baths - beds |
show details | |

|
#46
153rd St
Midlothian, IL 60445
|
- sq. feet
|
- baths - beds |
show details | |

|
#47
Crestview Ct
Midlothian, IL 60445
|
- sq. feet
|
- baths - beds |
show details | |

|
#48
Lamon Ave Apt 106
Midlothian, IL 60445
|
- sq. feet
|
- baths - beds |
show details | |

|
#49
143rd St
Midlothian, IL 60445
|
- sq. feet
|
- baths - beds |
show details | |

|
Check over 1 million property listings on Foreclosure.com!
|
browse all offers | |||

Latest news about housing in Midlothian, IL collected exclusively by city-data.com from local newspapers, TV, and radio stations

 | Very weak housing market in Highland Park (66 replies) |
| Tinley Park, Homewood or Midlothian? (21 replies) |
| The southern suburbs in the next 10-20 years. (257 replies) |
| Opinion on Algonquin/Carpentersville homes off Randall Rd (21 replies) |
| Most affordable suburbs for a single family home (single person) (13 replies) |
| Buying a place-100k budget (7 replies) |

Median year apartment built: 1972
Household type by relationship:
Households: 13,884- Male householders: 3,013 (711 living alone), Female householders: 2,605 (980 living alone)
2,597 spouses (2,589 opposite-sex spouses), 433 unmarried partners, (433 opposite-sex unmarried partners), 4,231 children (4,060 natural, 81 adopted, 89 stepchildren), 196 grandchildren, 119 brothers or sisters, 206 parents, 19 foster children, 137 other relatives, 232 non-relatives
- In group quarters: 89
Size of family households: 1,639 2-persons, 614 3-persons, 1,151 4-persons, 261 5-persons, 37 6-persons, 58 7-or-more-persons.
Size of nonfamily households: 1,818 1-person, 267 2-persons, 18 3-persons.
1,914 married couples with children.
860 single-parent households (348 men, 512 women).
74.0% of residents of Midlothian speak English at home.
19.7% of residents speak Spanish at home (56% speak English very well, 18% speak English well, 23% speak English not well, 3% don't speak English at all).
0.8% of residents speak other Indo-European language at home (72% speak English very well, 7% speak English well, 21% speak English not well).
4.1% of residents speak Asian or Pacific Island language at home (88% speak English very well, 12% speak English well).
1.4% of residents speak other language at home (100% speak English very well).
Foreign born population: 2,536 (18.3%)
(57.0% of them are naturalized citizens)
| Here: | 6.1 |
| State: | 6.4 |
| Here: | 4.2 |
| State: | 4.1 |
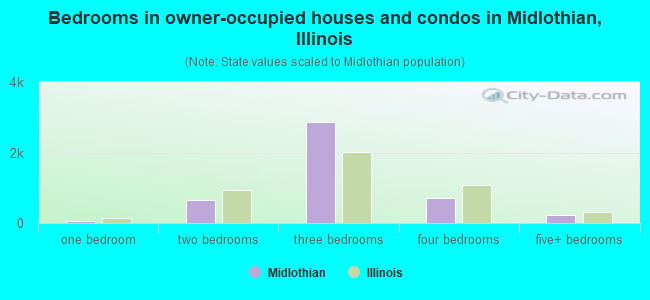
- Bedrooms in owner-occupied houses and condos in Midlothian, Illinois
- 0no bedroom
- 601 bedroom
- 6532 bedrooms
- 2,8723 bedrooms
- 6984 bedrooms
- 2375+ bedrooms
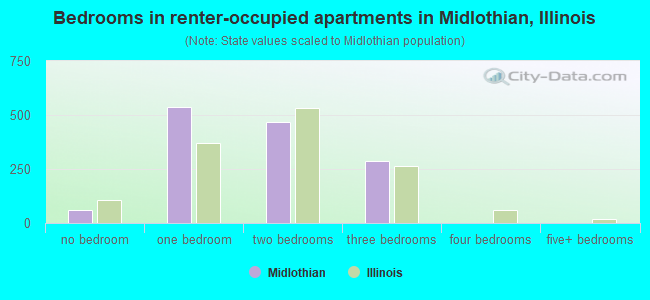
- Bedrooms in renter-occupied apartments in Midlothian, Illinois
- 60no bedroom
- 5361 bedroom
- 4672 bedrooms
- 2873 bedrooms
- 04 bedrooms
- 05+ bedrooms
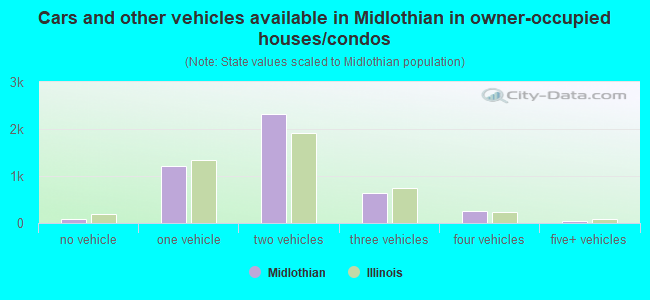
- Cars and other vehicles available in Midlothian in owner-occupied houses/condos
- 83no vehicle
- 1,2041 vehicle
- 2,3152 vehicles
- 6373 vehicles
- 2484 vehicles
- 335+ vehicles
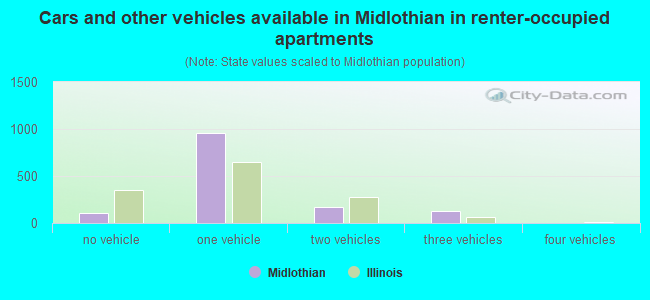
- Cars and other vehicles available in Midlothian in renter-occupied apartments
- 104no vehicle
- 9531 vehicle
- 1712 vehicles
- 1233 vehicles
- 04 vehicles
- 05+ vehicles
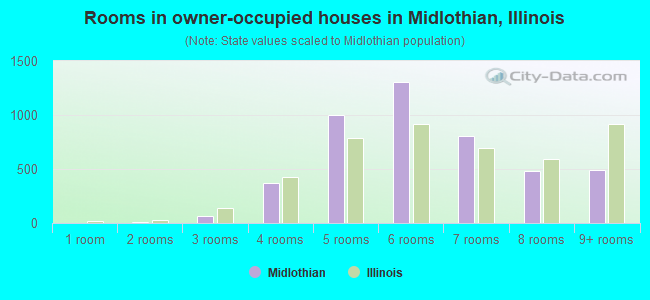
- Rooms in owner-occupied houses in Midlothian, Illinois
- 01 room
- 72 rooms
- 633 rooms
- 3674 rooms
- 1,0025 rooms
- 1,3026 rooms
- 8047 rooms
- 4858 rooms
- 4899+ rooms
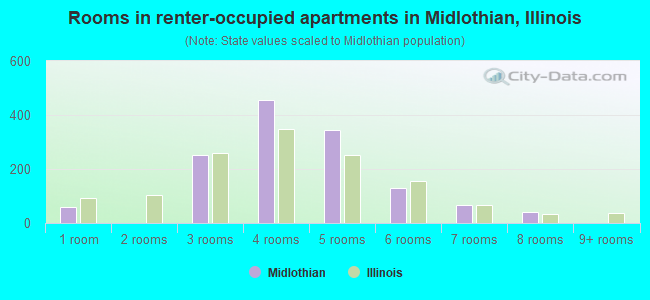
- Rooms in renter-occupied apartments in Midlothian, Illinois
- 601 room
- 02 rooms
- 2513 rooms
- 4574 rooms
- 3455 rooms
- 1296 rooms
- 667 rooms
- 428 rooms
- 09+ rooms
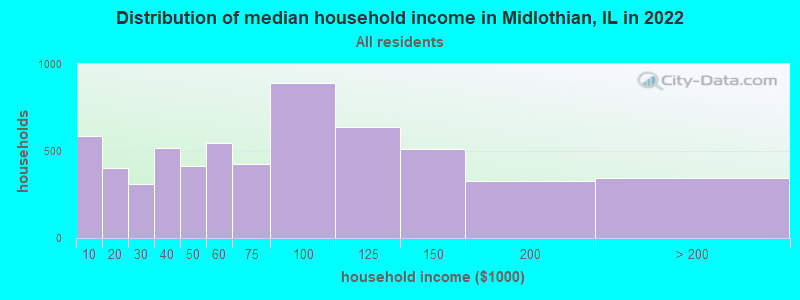
Midlothian, IL household income distribution

- 586Less than $10,000
- 400$10,000 to $19,999
- 310$20,000 to $29,999
- 515$30,000 to $39,999
- 415$40,000 to $49,999
- 546$50,000 to $59,999
- 427$60,000 to $74,999
- 893$75,000 to $99,999
- 637$100,000 to $124,999
- 514$125,000 to $149,999
- 329$150,000 to $199,999
- 347$200,000 or more
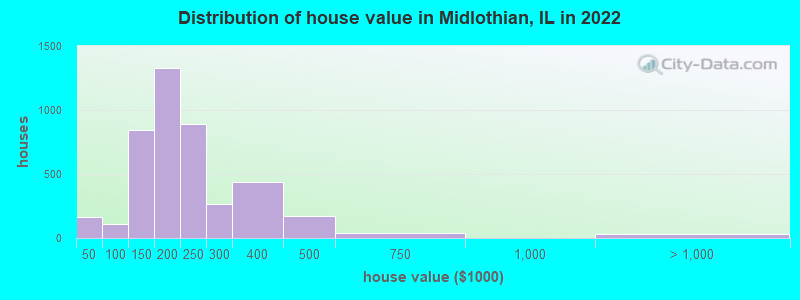
Home value of owner - occupied houses in 2022 in Midlothian, IL
-
- 79Less than $10,000
- 30$15,000 to $19,999
- 23$20,000 to $24,999
- 28$35,000 to $39,999
- 20$60,000 to $69,999
- 27$70,000 to $79,999
- 19$80,000 to $89,999
- 45$90,000 to $99,999
- 343$100,000 to $124,999
- 500$125,000 to $149,999
- 833$150,000 to $174,999
- 493$175,000 to $199,999
- 887$200,000 to $249,999
- 267$250,000 to $299,999
- 435$300,000 to $399,999
- 168$400,000 to $499,999
- 42$500,000 to $749,999
- 13$1,000,000 to $1,499,999
- 17$1,500,000 to $1,999,999
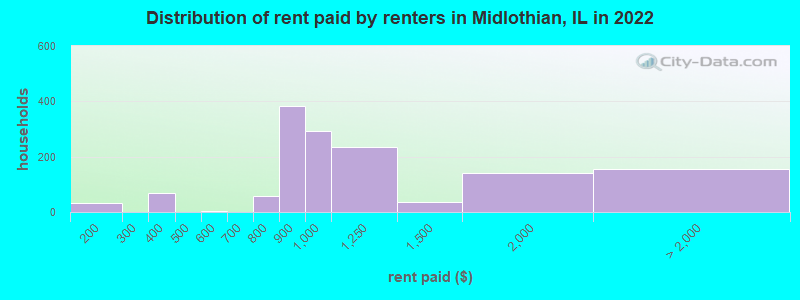
Rent paid by renters in 2022 in Midlothian, IL
-
- 31$100 to $149
- 67$350 to $399
- 4$550 to $599
- 30$700 to $749
- 28$750 to $799
- 382$800 to $899
- 292$900 to $999
- 236$1,000 to $1,249
- 34$1,250 to $1,499
- 141$1,500 to $1,999
- 147$2,000 to $2,499
- 8No cash rent
Percentage of workers working in this county: 84.7%
Number of people working at home: 769 (11.8% of all workers)
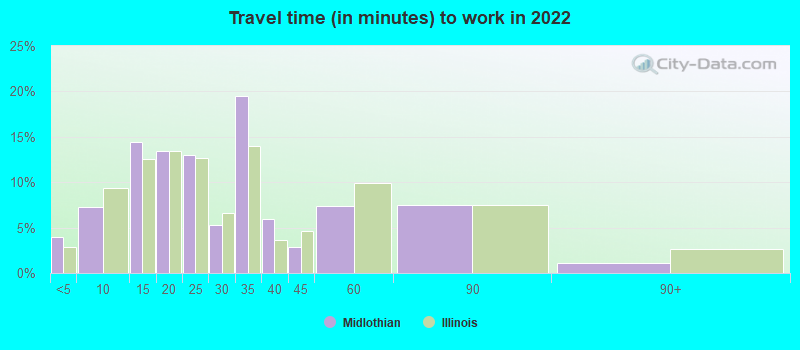
Travel time to work (commute)
- Less than 5 minutes: 113
- 5 to 9 minutes: 315
- 10 to 14 minutes: 620
- 15 to 19 minutes: 840
- 20 to 24 minutes: 776
- 25 to 29 minutes: 404
- 30 to 34 minutes: 761
- 35 to 39 minutes: 253
- 40 to 44 minutes: 212
- 45 to 59 minutes: 635
- 60 to 89 minutes: 536
- 90 or more minutes: 177
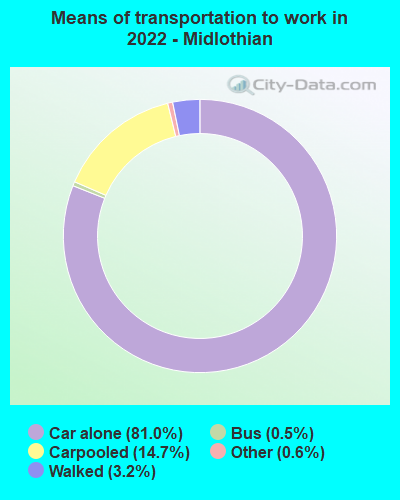
Means of transportation to work:
- Drove a car alone: 1,911 (63.7%)
- Carpooled: 372 (12.4%)
- Bus: 11 (0.4%)
- Taxi: 13 (0.4%)
- Walked: 77 (2.6%)
- Worked at home: 769 (25.6%)
- Unemployment by race in 2022
- Unemployment rate for White non-Hispanic residents
- 7.0%Males
- 1.1%Females
- Unemployment rate for Black residents
- 11.5%Females
- Unemployment rate for other race residents
- 6.4%Males
- 14.1%Females
- Unemployment rate for two or more race residents
- 2.3%Females
- Unemployment rate for Hispanic or Latino residents
- 5.2%Males
- 4.7%Females
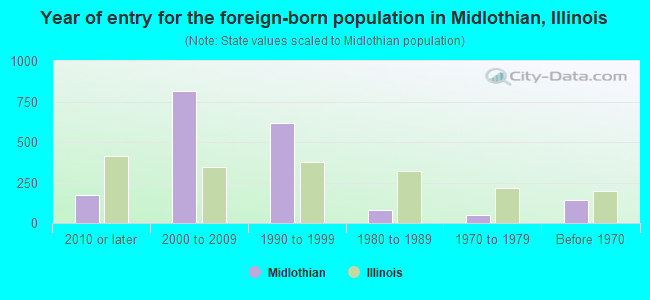
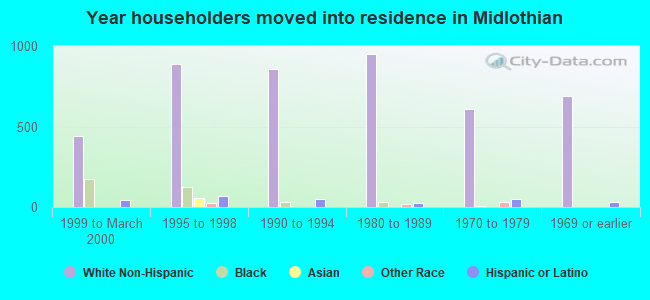
- Year of entry for the foreign-born population in Midlothian, Illinois
- 1702010 or later
- 8142000 to 2009
- 6151990 to 1999
- 781980 to 1989
- 501970 to 1979
- 145Before 1970
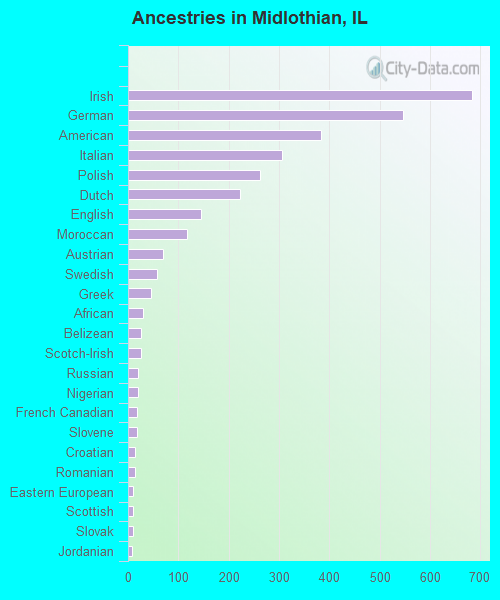
First ancestries reported:
- Irish: 683 (8.5%)
- German: 546 (6.8%)
- American: 383 (4.8%)
- Italian: 305 (3.8%)
- Polish: 263 (3.3%)
- Dutch: 222 (2.8%)
- English: 145 (1.8%)
- Moroccan: 117 (1.5%)
- Austrian: 70 (0.9%)
- Swedish: 58 (0.7%)
- Greek: 45 (0.6%)
- African: 29 (0.4%)
- Belizean: 26 (0.3%)
- Scotch-Irish: 25 (0.3%)
- Russian: 19 (0.2%)
- Nigerian: 19 (0.2%)
- French Canadian: 18 (0.2%)
- Slovene: 17 (0.2%)
- Croatian: 13 (0.2%)
- Romanian: 13 (0.2%)
- Eastern European: 9 (0.1%)
- Scottish: 9 (0.1%)
- Slovak: 9 (0.1%)
- Jordanian: 8 (0.10%)
- Czechoslovakian: 6 (0.07%)
- Hungarian: 4 (0.05%)
Most common places of birth for foreign-born residents (%):
| Midlothian: | 62.1% (1,574) |
| Illinois: | 34.7% (626,958) |
| Midlothian: | 10.0% (253) |
| Illinois: | 9.2% (166,409) |
| Midlothian: | 9.6% (243) |
| Illinois: | 5.2% (93,003) |
| Midlothian: | 4.1% (105) |
| Illinois: | 0.2% (3,781) |
| Midlothian: | 2.8% (70) |
| Illinois: | 0.9% (16,844) |
| Midlothian: | 2.0% (50) |
| Illinois: | 0.3% (4,639) |
Place of birth for U.S.-born residents:
- This state: 10,166
- Other state: 1,076
- Northeast: 58
- Midwest: 396
- South: 347
- West: 262
94.3% of Midlothian residents lived in the same house 1 years ago.
Out of people who lived in different houses, 47.6% lived in this county.
Out of people who lived in different counties, 68.4% lived in Illinois.
| Midlothian: | 94.3% |
| State average: | 88.3% |
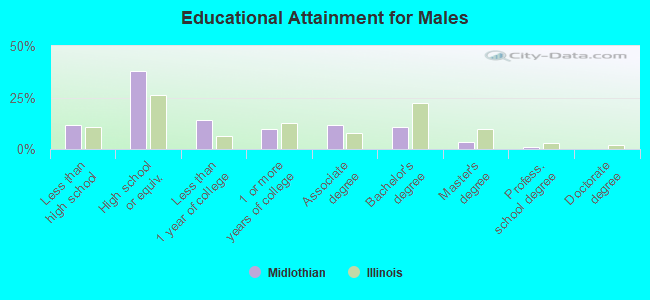
Education attainment for males 25 years and older:
- No schooling: 63
- Nursery to 4th grade: 0
- 5th and 6th grade: 224
- 7th and 8th grade: 56
- 9th grade: 16
- 10th grade: 58
- 11th grade: 8
- 12th grade, no diploma: 146
- High school graduate (or equivalency): 1,818
- Less than 1 year of college: 683
- Some college more than 1 year, no degree: 471
- Associate degree: 558
- Bachelor's degree: 521
- Master's degree: 166
- Professional school degree: 43
- Doctorate degree: 0
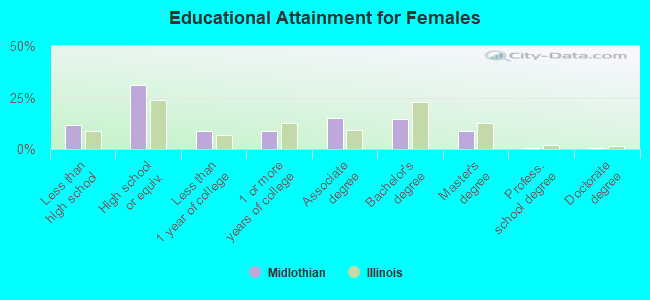
Education attainment for females 25 years and older:
- No schooling: 109
- Nursery to 4th grade: 27
- 5th and 6th grade: 72
- 7th and 8th grade: 124
- 9th grade: 0
- 10th grade: 53
- 11th grade: 48
- 12th grade, no diploma: 124
- High school graduate (or equivalency): 1,510
- Less than 1 year of college: 429
- Some college more than 1 year, no degree: 420
- Associate degree: 738
- Bachelor's degree: 714
- Master's degree: 417
- Professional school degree: 22
- Doctorate degree: 29


Housing units in structures:
- One, detached: 4,587
- One, attached: 131
- Two: 32
- 3 or 4: 89
- 5 to 9: 721
- 10 to 19: 171
- 20 to 49: 32
- 50 or more: 222
Housing units lacking complete kitchen facilities in 2022: 1.8%
House/condo owner moved in on average 12 years ago
Renter moved in on average 3 years ago
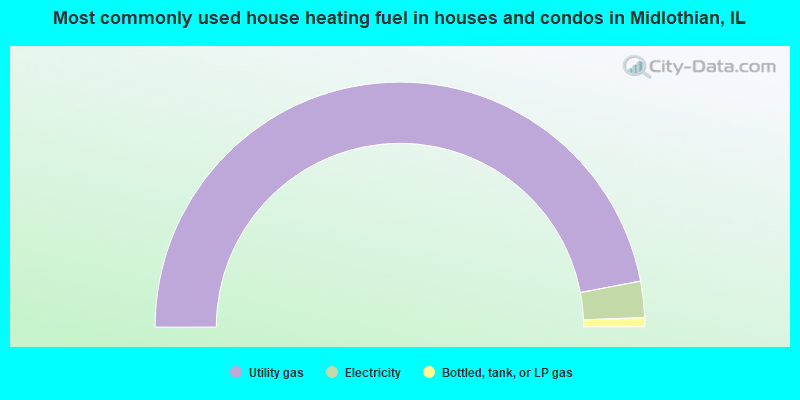
- 94.0%Utility gas
- 4.8%Electricity
- 1.2%Bottled, tank, or LP gas
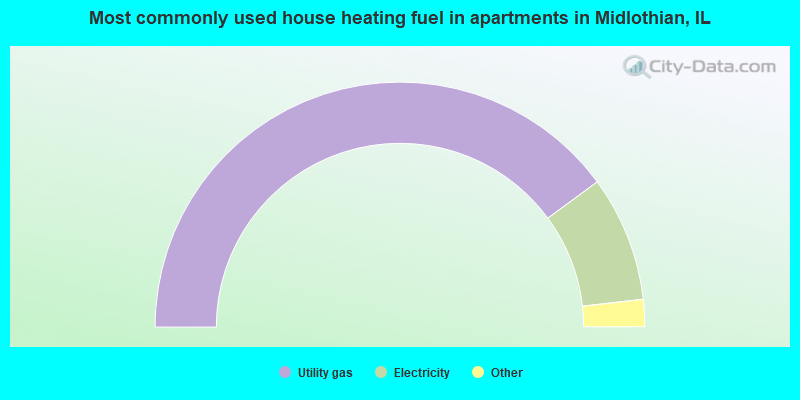
- 79.9%Utility gas
- 16.6%Electricity
- 1.4%Bottled, tank, or LP gas
- 1.4%No fuel used
- 0.7%Other fuel
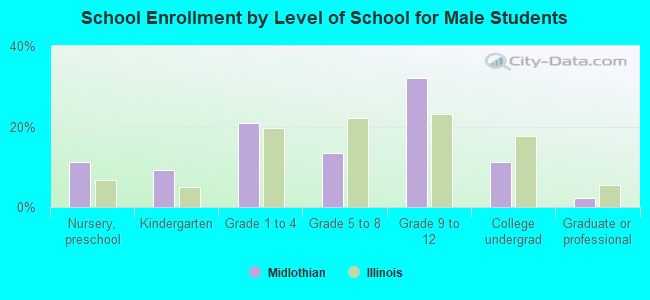
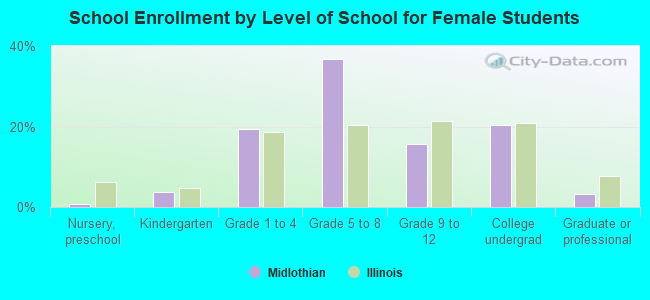
Private vs. public school enrollment:
| Here: | 11.5% |
| Illinois: | 13.3% |
| Here: | 2.3% |
| Illinois: | 9.9% |
| Here: | 26.0% |
| Illinois: | 27.4% |