Mill Valley, CA (California) Houses and Residents
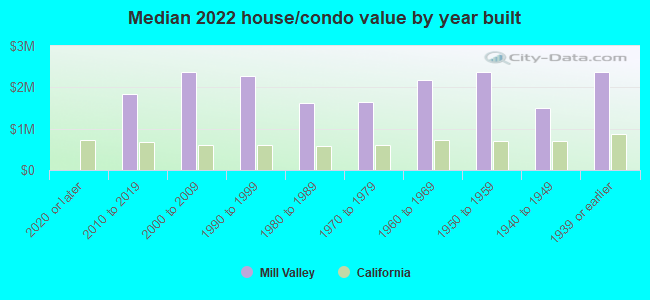
| Mill Valley: | $2,270,476 |
| California: | $715,900 |
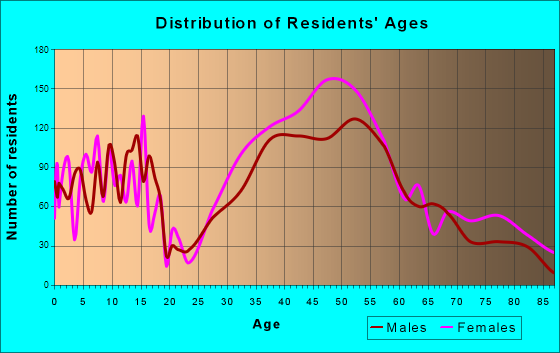
Total population: 14,403 (Urban population: 13,560, Rural population: 0)
Houses: 6,340 (5,606 occupied: 3,683 owner occupied, 1,885 renter occupied)
| % of renters here: | 34% |
| State: | 44% |
Housing density: 1,344 houses/condos per square mile
Median price asked for vacant for-sale houses and condos in 2022: $10,143,394.
Median contract rent in 2022: over $2,000 (lower quartile is $1,772, upper quartile is over $2,000)
Median rent asked for vacant for-rent units in 2022: $4,231
Median gross rent in Mill Valley, CA in 2022: over $2,000
Housing units in Mill Valley with a mortgage: 2,536 (465 second mortgage, 13 home equity loan, 378 both second mortgage and home equity loan)
Houses without a mortgage: 0
Median household income for houses/condos with a mortgage: $263,303
Median household income for apartments without a mortgage: $225,897
Median monthly housing costs: $3,601
Compare current foreclosures near Mill Valley, CA:
| Photo | Address | Area | Beds / Baths | Price | Details |
|---|---|---|---|---|---|

|
#1
California Ave
Mill Valley, CA 94941
|
2,678 sq. feet
|
3 baths 3 beds |
show details | |

|
#2
Sequoia Valley Rd
Mill Valley, CA 94941
|
2,177 sq. feet
|
2 baths 3 beds |
show details | |

|
#3
California Ave
Mill Valley, CA 94941
|
2,678 sq. feet
|
3 baths 3 beds |
show details | |

|
#4
Seaver Dr
Mill Valley, CA 94941
|
- sq. feet
|
- baths - beds |
show details | |

|
#5
Creekside Way
Mill Valley, CA 94941
|
- sq. feet
|
- baths - beds |
show details | |

|
#6
Seminary Dr Apt B
Mill Valley, CA 94941
|
- sq. feet
|
- baths - beds |
show details | |

|
#7
2nd St
Richmond, CA 94801
|
887 sq. feet
|
1 baths 3 beds |
$364,000
|
show details |

|
#8
Thorndale Dr Apt 435
San Rafael, CA 94903
|
1,096 sq. feet
|
2 baths 2 beds |
$179,900
|
show details |

|
#9
Thorndale Dr Apt 206
San Rafael, CA 94903
|
660 sq. feet
|
1 baths 1 beds |
$59,900
|
show details |

|
#10
El Portal Dr Apt D
San Pablo, CA 94806
|
1,058 sq. feet
|
2 baths 2 beds |
show details |
| Photo | Address | Area | Beds / Baths | Price | Details |
|---|---|---|---|---|---|

|
#11
Kelsey St
Richmond, CA 94801
|
1,080 sq. feet
|
3 baths 4 beds |
show details | |

|
#12
Balboa St
San Francisco, CA 94118
|
2,410 sq. feet
|
1 baths 3 beds |
show details | |

|
#13
Los Angeles St
Emeryville, CA 94608
|
803 sq. feet
|
1 baths 2 beds |
show details | |

|
#14
Portola Ave
Lagunitas, CA 94938
|
1,188 sq. feet
|
2 baths 2 beds |
show details | |

|
#15
Kelvin Rd
El Sobrante, CA 94803
|
1,718 sq. feet
|
1 baths 3 beds |
show details | |

|
#16
Summer Ln
San Pablo, CA 94806
|
1,819 sq. feet
|
3 baths 3 beds |
show details | |

|
#17
Crucero Ave
San Pablo, CA 94806
|
1,264 sq. feet
|
2 baths 3 beds |
show details | |

|
#18
Sunny Cove Dr
Novato, CA 94949
|
2,568 sq. feet
|
2 baths 4 beds |
show details | |

|
#19
El Dorado Ave
Berkeley, CA 94707
|
2,370 sq. feet
|
2 baths 4 beds |
show details | |

|
#20
W Cavour St
Daly City, CA 94014
|
1,180 sq. feet
|
1 baths 2 beds |
show details |
| Photo | Address | Area | Beds / Baths | Price | Details |
|---|---|---|---|---|---|

|
#21
Hollister Ave
San Francisco, CA 94124
|
1,000 sq. feet
|
3 baths 5 beds |
show details | |

|
#22
Dorian Way
San Rafael, CA 94901
|
3,459 sq. feet
|
4 baths 4 beds |
show details | |

|
#23
Ivy Lane
Woodacre, CA 94973
|
2,251 sq. feet
|
2 baths 3 beds |
show details | |

|
#24
Marin Oaks Dr
Novato, CA 94949
|
2,370 sq. feet
|
2 baths 5 beds |
show details | |

|
#25
Virginia St
Berkeley, CA 94702
|
1,690 sq. feet
|
2 baths 3 beds |
show details | |

|
#26
Garfield St
San Francisco, CA 94132
|
1,355 sq. feet
|
1 baths 3 beds |
show details | |

|
#27
Vermont St
San Francisco, CA 94107
|
1,520 sq. feet
|
2 baths 2 beds |
show details | |

|
#28
Cedar Ct
Daly City, CA 94014
|
1,200 sq. feet
|
2 baths 3 beds |
show details | |

|
#29
Orange Blossom Ln
San Rafael, CA 94903
|
1,892 sq. feet
|
2 baths 3 beds |
show details | |

|
#30
Lobos St
San Francisco, CA 94112
|
750 sq. feet
|
1 baths 2 beds |
show details |
| Photo | Address | Area | Beds / Baths | Price | Details |
|---|---|---|---|---|---|

|
#31
Madrid St
San Francisco, CA 94112
|
1,745 sq. feet
|
2 baths 3 beds |
show details | |

|
#32
Harkness Ave
San Francisco, CA 94134
|
1,412 sq. feet
|
2 baths 3 beds |
show details | |

|
#33
Carberry Ave
Oakland, CA 94609
|
2,832 sq. feet
|
3 baths 4 beds |
show details | |

|
#34
Raymond Ave
San Francisco, CA 94134
|
975 sq. feet
|
1 baths 3 beds |
show details | |

|
#35
Madrid St
San Francisco, CA 94112
|
1,018 sq. feet
|
1 baths 4 beds |
show details | |

|
#36
47th Ave
San Francisco, CA 94121
|
1,284 sq. feet
|
1 baths 2 beds |
show details | |

|
#37
Byxbee St
San Francisco, CA 94132
|
800 sq. feet
|
1 baths 1 beds |
show details | |

|
#38
Olima St
Sausalito, CA 94965
|
- sq. feet
|
2 baths 4 beds |
show details | |

|
#39
31st Ave
San Francisco, CA 94116
|
1,115 sq. feet
|
1 baths 2 beds |
show details | |

|
#40
Harmon Rd
El Sobrante, CA 94803
|
1,031 sq. feet
|
1 baths 3 beds |
show details |
| Photo | Address | Area | Beds / Baths | Price | Details |
|---|---|---|---|---|---|

|
#41
Holloway Ave
San Francisco, CA 94132
|
1,110 sq. feet
|
5 baths 1 beds |
show details | |

|
#42
Heide Ct
El Sobrante, CA 94803
|
4,151 sq. feet
|
3 baths 5 beds |
show details | |

|
#43
Warner Ct
San Rafael, CA 94901
|
1,664 sq. feet
|
2 baths 4 beds |
show details | |

|
#44
36th St
Richmond, CA 94805
|
1,116 sq. feet
|
1 baths 2 beds |
show details | |

|
#45
Munich St
San Francisco, CA 94112
|
1,103 sq. feet
|
1 baths 2 beds |
show details | |

|
#46
Beverly Pl
Berkeley, CA 94707
|
1,308 sq. feet
|
1 baths 2 beds |
show details | |

|
#47
Overland Ave
Emeryville, CA 94608
|
- sq. feet
|
- baths - beds |
$72,950
|
show details |

|
#48
3rd St
San Rafael, CA 94901
|
1,304 sq. feet
|
1 baths 2 beds |
show details | |

|
#49
Greenwich St Apt 3
San Francisco, CA 94109
|
998 sq. feet
|
1 baths 1 beds |
show details | |

|
Check over 1 million property listings on Foreclosure.com!
|
browse all offers | |||


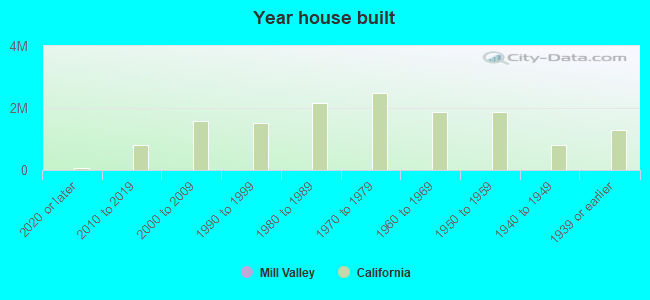
Median year apartment built: 1958
Household type by relationship:
Households: 13,955- Male householders: 2,550 (401 living alone), Female householders: 2,945 (965 living alone)
3,069 spouses (3,036 opposite-sex spouses), 376 unmarried partners, (351 opposite-sex unmarried partners), 4,166 children (3,912 natural, 160 adopted, 93 stepchildren), 80 grandchildren, 18 brothers or sisters, 72 parents, 0 foster children, 87 other relatives, 518 non-relatives
- In group quarters: 68
Size of family households: 1,543 2-persons, 911 3-persons, 1,005 4-persons, 227 5-persons, 16 6-persons.
Size of nonfamily households: 1,483 1-person, 327 2-persons, 23 3-persons, 5 4-persons.
2,278 married couples with children.
537 single-parent households (111 men, 426 women).
84.9% of residents of Mill Valley speak English at home.
1.0% of residents speak Spanish at home (99% speak English very well, 1% speak English not well).
11.7% of residents speak other Indo-European language at home (83% speak English very well, 12% speak English well, 5% speak English not well).
2.5% of residents speak Asian or Pacific Island language at home (50% speak English very well, 50% speak English well).
0.1% of residents speak other language at home (100% speak English very well).
Foreign born population: 2,336 (16.7%)
(74.7% of them are naturalized citizens)
| Here: | 6.9 |
| State: | 6.0 |
| Here: | 3.8 |
| State: | 3.9 |
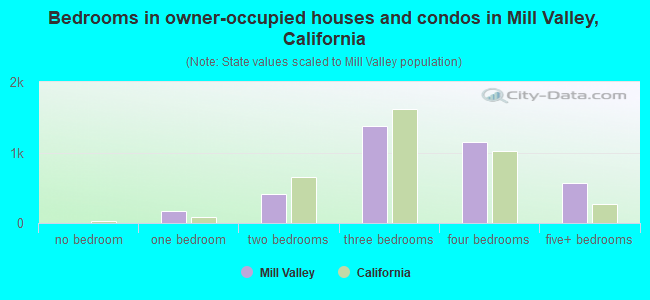
- Bedrooms in owner-occupied houses and condos in Mill Valley, California
- 0no bedroom
- 1741 bedroom
- 4142 bedrooms
- 1,3813 bedrooms
- 1,1534 bedrooms
- 5615+ bedrooms
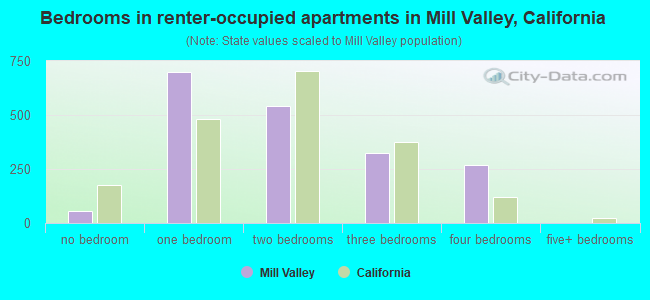
- Bedrooms in renter-occupied apartments in Mill Valley, California
- 55no bedroom
- 6971 bedroom
- 5432 bedrooms
- 3243 bedrooms
- 2674 bedrooms
- 05+ bedrooms
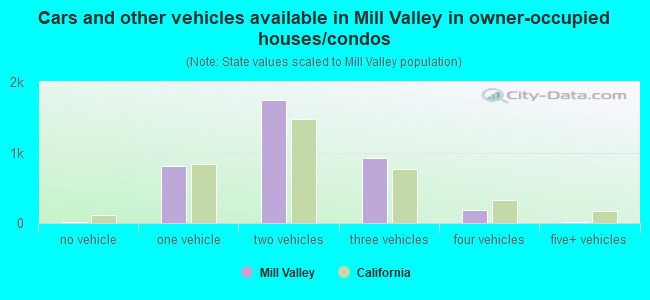
- Cars and other vehicles available in Mill Valley in owner-occupied houses/condos
- 9no vehicle
- 8061 vehicle
- 1,7512 vehicles
- 9183 vehicles
- 1814 vehicles
- 195+ vehicles
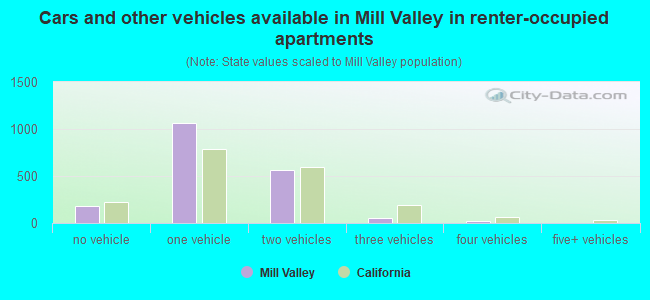
- Cars and other vehicles available in Mill Valley in renter-occupied apartments
- 181no vehicle
- 1,0621 vehicle
- 5612 vehicles
- 583 vehicles
- 244 vehicles
- 05+ vehicles
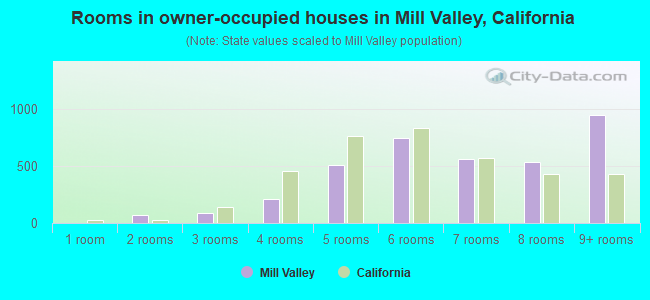
- Rooms in owner-occupied houses in Mill Valley, California
- 01 room
- 732 rooms
- 863 rooms
- 2154 rooms
- 5085 rooms
- 7496 rooms
- 5657 rooms
- 5408 rooms
- 9499+ rooms
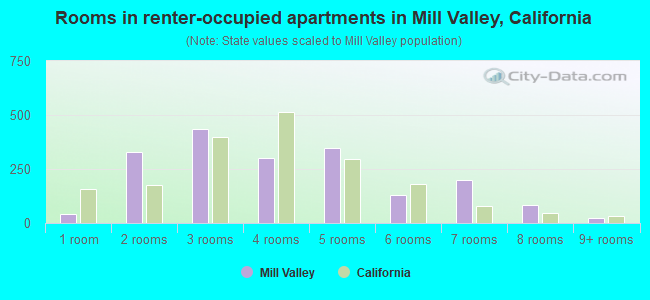
- Rooms in renter-occupied apartments in Mill Valley, California
- 401 room
- 3312 rooms
- 4343 rooms
- 3034 rooms
- 3455 rooms
- 1306 rooms
- 1987 rooms
- 828 rooms
- 239+ rooms
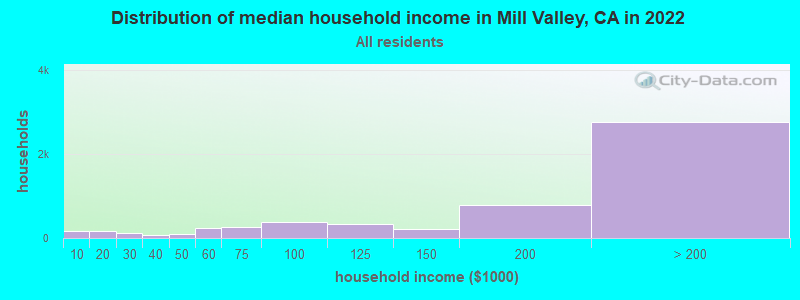
Mill Valley, CA household income distribution

- 170Less than $10,000
- 162$10,000 to $19,999
- 108$20,000 to $29,999
- 60$30,000 to $39,999
- 102$40,000 to $49,999
- 227$50,000 to $59,999
- 267$60,000 to $74,999
- 387$75,000 to $99,999
- 328$100,000 to $124,999
- 220$125,000 to $149,999
- 783$150,000 to $199,999
- 2,756$200,000 or more
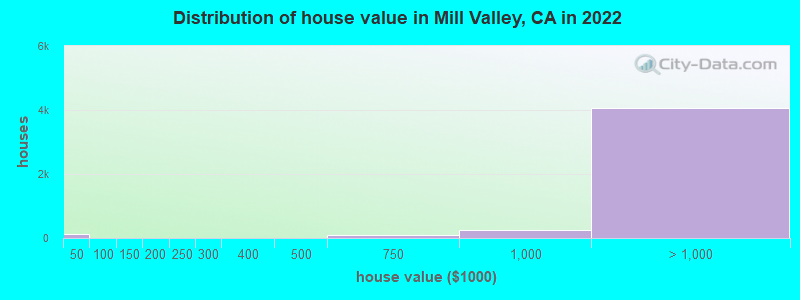
Home value of owner - occupied houses in 2022 in Mill Valley, CA
-
- 111Less than $10,000
- 5$100,000 to $124,999
- 8$150,000 to $174,999
- 7$250,000 to $299,999
- 11$300,000 to $399,999
- 101$500,000 to $749,999
- 252$750,000 to $999,999
- 682$1,000,000 to $1,499,999
- 915$1,500,000 to $1,999,999
- 2,452$2,000,000 or more
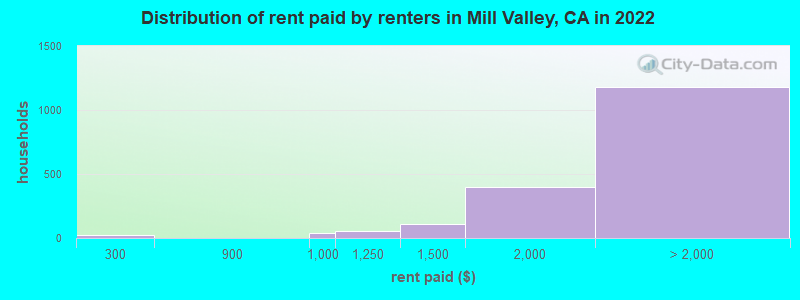
Rent paid by renters in 2022 in Mill Valley, CA
-
- 22$250 to $299
- 39$900 to $999
- 56$1,000 to $1,249
- 110$1,250 to $1,499
- 402$1,500 to $1,999
- 161$2,000 to $2,499
- 209$2,500 to $2,999
- 186$3,000 to $3,499
- 574$3,500 or more
- 45No cash rent
Percentage of workers working in this county: 73.2%
Number of people working at home: 2,285 (35.9% of all workers)
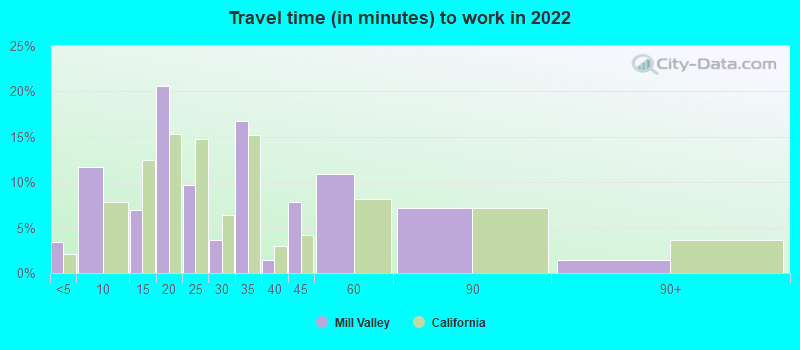
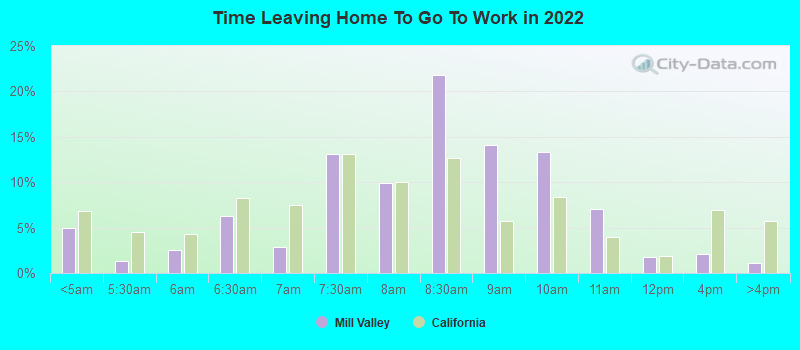
Travel time to work (commute)
- Less than 5 minutes: 96
- 5 to 9 minutes: 591
- 10 to 14 minutes: 552
- 15 to 19 minutes: 758
- 20 to 24 minutes: 370
- 25 to 29 minutes: 150
- 30 to 34 minutes: 266
- 35 to 39 minutes: 104
- 40 to 44 minutes: 246
- 45 to 59 minutes: 345
- 60 to 89 minutes: 493
- 90 or more minutes: 157
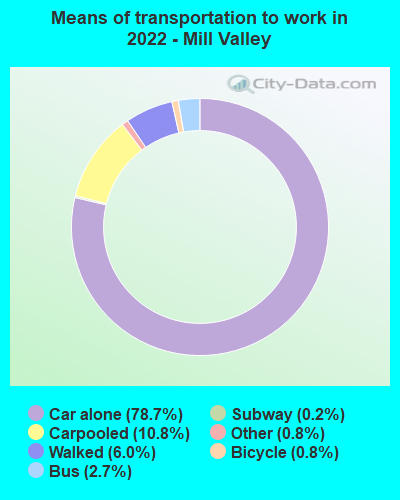
Means of transportation to work:
- Drove a car alone: 3,818 (52.3%)
- Carpooled: 500 (6.9%)
- Bus: 179 (2.5%)
- Long-distance train or commuter rail: 16 (0.2%)
- Taxi: 63 (0.9%)
- Bicycle: 76 (1.0%)
- Walked: 373 (5.1%)
- Worked at home: 2,285 (31.3%)
- Unemployment by race in 2022
- Unemployment rate for White non-Hispanic residents
- 10.8%Males
- 1.5%Females
- Unemployment rate for Asian residents
- 10.7%Males
- 22.6%Females
- Unemployment rate for two or more race residents
- 4.1%Males
- Unemployment rate for Hispanic or Latino residents
- 26.5%Males
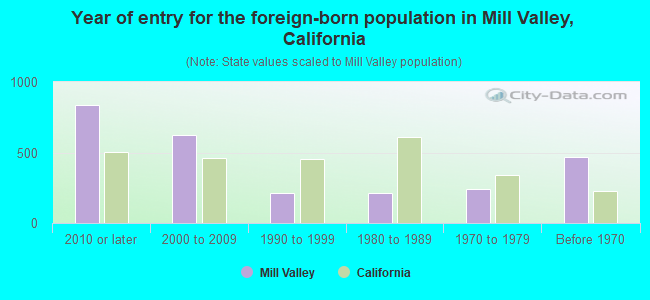
- Year of entry for the foreign-born population in Mill Valley, California
- 8372010 or later
- 6272000 to 2009
- 2121990 to 1999
- 2121980 to 1989
- 2421970 to 1979
- 465Before 1970
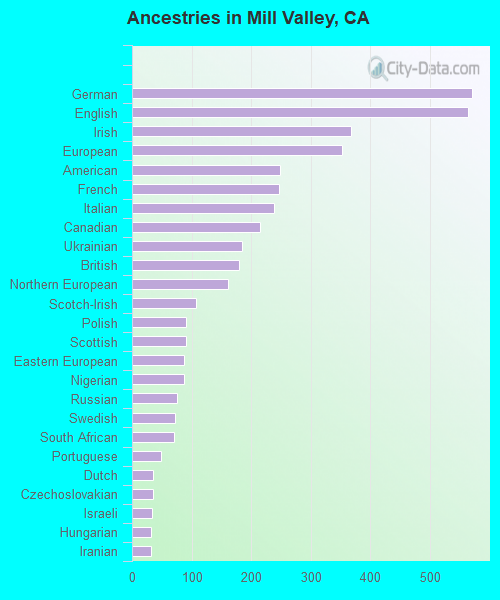
First ancestries reported:
- German: 571 (9.5%)
- English: 564 (9.4%)
- Irish: 367 (6.1%)
- European: 352 (5.9%)
- American: 248 (4.1%)
- French: 247 (4.1%)
- Italian: 238 (4.0%)
- Canadian: 215 (3.6%)
- Ukrainian: 184 (3.1%)
- British: 179 (3.0%)
- Northern European: 161 (2.7%)
- Scotch-Irish: 108 (1.8%)
- Polish: 91 (1.5%)
- Scottish: 91 (1.5%)
- Eastern European: 87 (1.5%)
- Nigerian: 87 (1.5%)
- Russian: 76 (1.3%)
- Swedish: 73 (1.2%)
- South African: 70 (1.2%)
- Portuguese: 48 (0.8%)
- Dutch: 36 (0.6%)
- Czechoslovakian: 35 (0.6%)
- Israeli: 34 (0.6%)
- Hungarian: 32 (0.5%)
- Iranian: 32 (0.5%)
- Austrian: 30 (0.5%)
- Croatian: 29 (0.5%)
- Danish: 29 (0.5%)
- Swiss: 25 (0.4%)
- Norwegian: 22 (0.4%)
- Greek: 20 (0.3%)
- Lithuanian: 16 (0.3%)
- Romanian: 12 (0.2%)
- Australian: 11 (0.2%)
- Lebanese: 10 (0.2%)
- Welsh: 10 (0.2%)
- Slovak: 8 (0.1%)
- Armenian: 7 (0.1%)
Most common places of birth for foreign-born residents (%):
| Mill Valley: | 13.9% (328) |
| California: | 1.2% (127,477) |
| Mill Valley: | 9.6% (225) |
| California: | 0.6% (65,335) |
| Mill Valley: | 9.5% (223) |
| California: | 0.6% (60,582) |
| Mill Valley: | 8.5% (199) |
| California: | 5.2% (539,184) |
| Mill Valley: | 8.3% (195) |
| California: | 0.6% (60,761) |
| Mill Valley: | 6.8% (160) |
| California: | 0.4% (40,224) |
| Mill Valley: | 5.0% (118) |
| California: | 0.7% (73,304) |
| Mill Valley: | 4.4% (104) |
| California: | 0.6% (57,953) |
| Mill Valley: | 3.1% (72) |
| California: | 6.6% (684,672) |
| Mill Valley: | 3.0% (71) |
| California: | 0.1% (12,221) |
| Mill Valley: | 2.6% (62) |
| California: | 3.0% (315,248) |
| Mill Valley: | 2.6% (61) |
| California: | 2.0% (206,004) |
| Mill Valley: | 2.5% (59) |
| California: | 0.2% (20,614) |
| Mill Valley: | 2.2% (51) |
| California: | 0.1% (8,444) |
| Mill Valley: | 1.9% (44) |
| California: | 0.1% (9,159) |
| Mill Valley: | 1.7% (39) |
| California: | 1.0% (103,575) |
Place of birth for U.S.-born residents:
- This state: 5,822
- Other state: 5,299
- Northeast: 2,282
- Midwest: 1,527
- South: 958
- West: 518
87.4% of Mill Valley residents lived in the same house 1 years ago.
Out of people who lived in different houses, 29.2% lived in this county.
Out of people who lived in different counties, 61.0% lived in California.
| Mill Valley: | 87.4% |
| State average: | 88.9% |
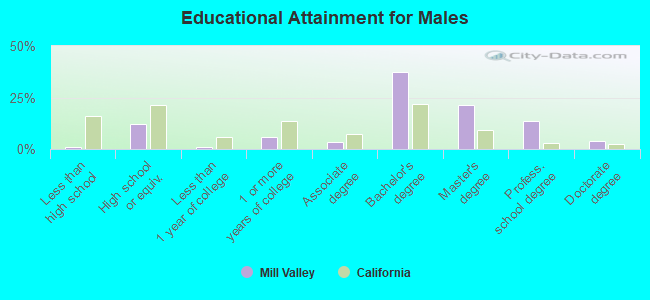
Education attainment for males 25 years and older:
- No schooling: 0
- Nursery to 4th grade: 0
- 5th and 6th grade: 0
- 7th and 8th grade: 3
- 9th grade: 0
- 10th grade: 0
- 11th grade: 33
- 12th grade, no diploma: 20
- High school graduate (or equivalency): 595
- Less than 1 year of college: 57
- Some college more than 1 year, no degree: 293
- Associate degree: 178
- Bachelor's degree: 1,842
- Master's degree: 1,048
- Professional school degree: 684
- Doctorate degree: 192
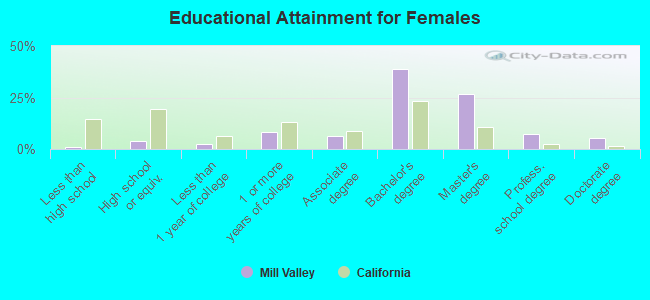
Education attainment for females 25 years and older:
- No schooling: 9
- Nursery to 4th grade: 0
- 5th and 6th grade: 0
- 7th and 8th grade: 18
- 9th grade: 0
- 10th grade: 0
- 11th grade: 0
- 12th grade, no diploma: 29
- High school graduate (or equivalency): 214
- Less than 1 year of college: 146
- Some college more than 1 year, no degree: 471
- Associate degree: 360
- Bachelor's degree: 2,167
- Master's degree: 1,490
- Professional school degree: 403
- Doctorate degree: 299
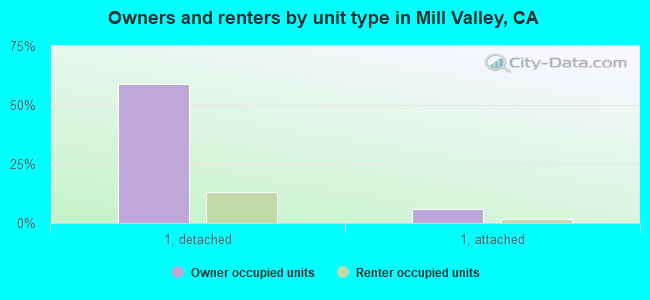
Housing units in structures:
- One, detached: 4,527
- One, attached: 504
- Two: 301
- 3 or 4: 162
- 5 to 9: 242
- 10 to 19: 276
- 20 to 49: 170
- 50 or more: 154
Housing units lacking complete kitchen facilities in 2022: 3.4%
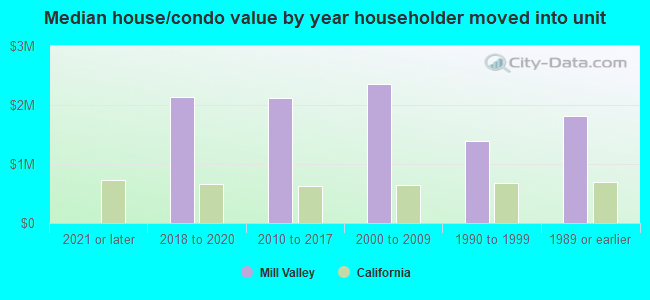
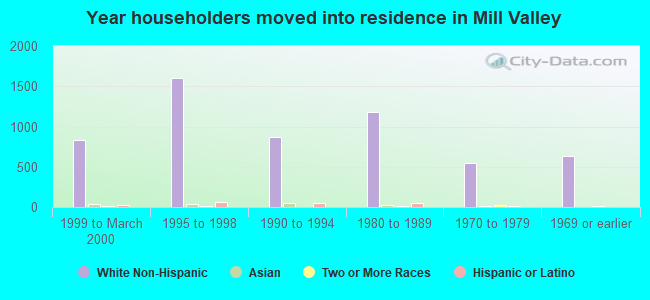
House/condo owner moved in on average 17 years ago
Renter moved in on average 6 years ago
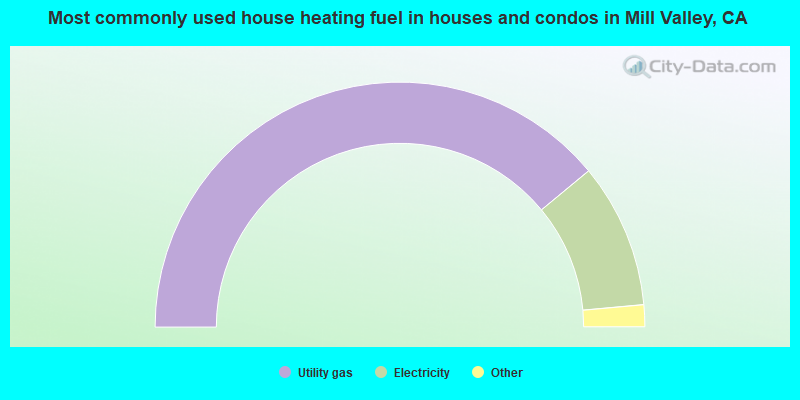
- 78.0%Utility gas
- 19.1%Electricity
- 2.2%Solar energy
- 0.7%Bottled, tank, or LP gas
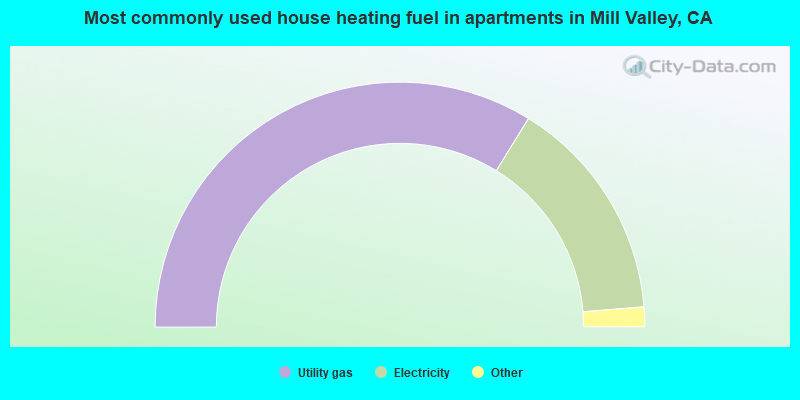
- 67.6%Utility gas
- 29.8%Electricity
- 1.1%Bottled, tank, or LP gas
- 0.8%No fuel used
- 0.6%Solar energy
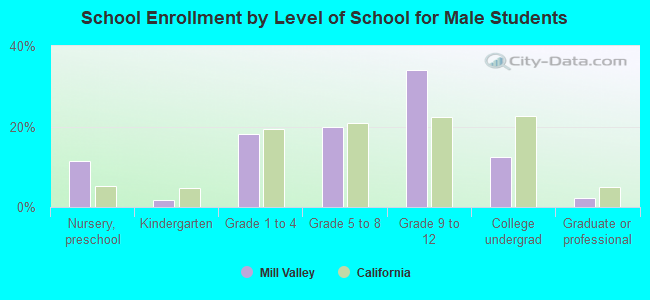
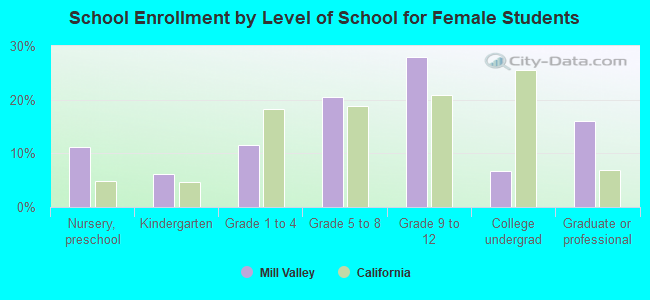
Private vs. public school enrollment:
| Here: | 34.6% |
| California: | 10.5% |
| Here: | 30.2% |
| California: | 8.5% |
| Here: | 24.4% |
| California: | 15.9% |