Millington, MI (Michigan) Houses and Residents
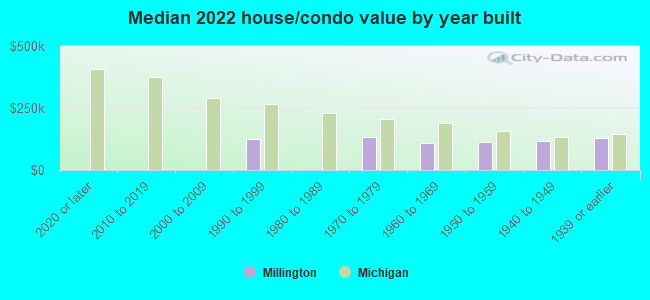
| Millington: | $125,535 |
| Michigan: | $224,400 |
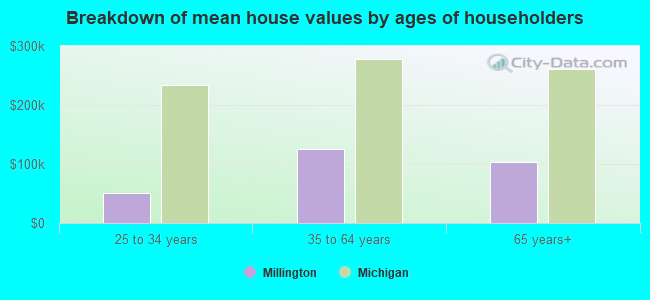
Mean price in 2022:
Detached houses: $127,255
Here: $127,255 State: $280,038
Total population: 1,043 (Urban population: 0, Rural population: 1,106 (all nonfarm))
Houses: 552 (499 occupied: 352 owner occupied, 154 renter occupied)
| % of renters here: | 30% |
| State: | 27% |
Housing density: 535 houses/condos per square mile
Median price asked for vacant for-sale houses and condos in 2022: $218,534.
Median contract rent in 2022: $649 (lower quartile is $589, upper quartile is $750)
Median rent asked for vacant for-rent units in 2022: $1,369
Median gross rent in Millington, MI in 2022: $849
Housing units in Millington with a mortgage: 187 (3 second mortgage, 0 home equity loan, 0 both second mortgage and home equity loan)
Houses without a mortgage: 18
Median household income for houses/condos with a mortgage: $80,326
Median household income for apartments without a mortgage: $39,481
Median monthly housing costs: $767
Compare current foreclosures near Millington, MI:
| Photo | Address | Area | Beds / Baths | Price | Details |
|---|---|---|---|---|---|

|
#1
Center Rd
Millington, MI 48746
|
1,480 sq. feet
|
1 baths 3 beds |
show details | |

|
#2
Belsay Rd
Millington, MI 48746
|
- sq. feet
|
- baths - beds |
show details | |

|
#3
Woodvalley Dr # 142
Millington, MI 48746
|
- sq. feet
|
- baths - beds |
show details | |

|
#4
Plainfield Ave
Flint, MI 48506
|
941 sq. feet
|
1 baths 3 beds |
$95,500
|
show details |

|
#5
Murphy Lake Rd
Millington, MI 48746
|
- sq. feet
|
- baths - beds |
show details | |

|
#6
Vassar Rd
Millington, MI 48746
|
- sq. feet
|
- baths - beds |
show details | |

|
#7
Irish Rd
Millington, MI 48746
|
- sq. feet
|
- baths - beds |
show details | |

|
#8
Birch Run Rd
Millington, MI 48746
|
- sq. feet
|
- baths - beds |
show details | |

|
#9
Irish Rd
Millington, MI 48746
|
- sq. feet
|
- baths - beds |
show details | |

|
#10
Barnes Rd
Millington, MI 48746
|
- sq. feet
|
- baths - beds |
show details |
| Photo | Address | Area | Beds / Baths | Price | Details |
|---|---|---|---|---|---|

|
#11
Arbela Rd
Millington, MI 48746
|
- sq. feet
|
- baths - beds |
show details | |

|
#12
Willard Rd
Millington, MI 48746
|
- sq. feet
|
- baths - beds |
show details | |

|
#13
Arbela Rd
Millington, MI 48746
|
- sq. feet
|
- baths - beds |
show details | |

|
#14
Murphy Lake Rd
Millington, MI 48746
|
- sq. feet
|
- baths - beds |
show details | |

|
#15
Millington Rd
Millington, MI 48746
|
- sq. feet
|
- baths - beds |
show details | |

|
#16
Millington Rd
Millington, MI 48746
|
- sq. feet
|
- baths - beds |
show details | |

|
#17
Fulmer Rd
Millington, MI 48746
|
- sq. feet
|
- baths - beds |
show details | |

|
#18
Harris Rd
Millington, MI 48746
|
- sq. feet
|
- baths - beds |
show details | |

|
#19
W Stanley Rd
Mount Morris, MI 48458
|
1,560 sq. feet
|
2 baths 3 beds |
show details | |

|
#20
S Reese Rd
Reese, MI 48757
|
1,403 sq. feet
|
1 baths 3 beds |
show details |
| Photo | Address | Area | Beds / Baths | Price | Details |
|---|---|---|---|---|---|

|
#21
W Wilson Rd
Clio, MI 48420
|
1,916 sq. feet
|
2 baths 4 beds |
show details | |

|
#22
Merlyn Ct
Clio, MI 48420
|
1,636 sq. feet
|
2 baths 4 beds |
show details | |

|
#23
Roosevelt Ave
Mount Morris, MI 48458
|
1,432 sq. feet
|
1 baths 4 beds |
show details | |

|
#24
Rotterdam Dr # 69
Clio, MI 48420
|
1,283 sq. feet
|
2 baths 2 beds |
show details | |

|
#25
Colonial Woods Dr
Clio, MI 48420
|
2,010 sq. feet
|
1 baths 5 beds |
show details | |

|
#26
E Mount Morris Rd
Mount Morris, MI 48458
|
1,412 sq. feet
|
1 baths 3 beds |
show details | |

|
#27
N Jennings Rd
Clio, MI 48420
|
1,736 sq. feet
|
1 baths 3 beds |
show details | |

|
#28
N Belsay Rd
Flint, MI 48506
|
1,404 sq. feet
|
1 baths 4 beds |
show details | |

|
#29
Byrnes Dr
Clio, MI 48420
|
744 sq. feet
|
1 baths 2 beds |
show details | |

|
#30
Richfield Rd
Flint, MI 48506
|
944 sq. feet
|
1 baths 2 beds |
show details |
| Photo | Address | Area | Beds / Baths | Price | Details |
|---|---|---|---|---|---|

|
#31
Kirk Rd
Vassar, MI 48768
|
1,700 sq. feet
|
2 baths 3 beds |
show details | |

|
#32
Mcgrandy Rd
Bridgeport, MI 48722
|
1,316 sq. feet
|
1 baths 3 beds |
show details | |

|
#33
Central St
Columbiaville, MI 48421
|
1,729 sq. feet
|
2 baths 5 beds |
show details | |

|
#34
N Averill Ave
Flint, MI 48506
|
- sq. feet
|
1 baths 3 beds |
show details | |

|
#35
Huggins Ave
Flint, MI 48506
|
1,020 sq. feet
|
1 baths 3 beds |
show details | |

|
#36
Alcott St
Burton, MI 48509
|
2,184 sq. feet
|
2 baths 5 beds |
show details | |

|
#37
Pinkerton Rd
Vassar, MI 48768
|
1,200 sq. feet
|
1 baths 3 beds |
show details | |

|
#38
Eckinger St
Flint, MI 48506
|
1,120 sq. feet
|
1 baths 3 beds |
show details | |

|
#39
Huggins Ave
Flint, MI 48506
|
1,296 sq. feet
|
1 baths 3 beds |
show details | |

|
#40
E Pierson Rd
Flint, MI 48506
|
- sq. feet
|
2 baths 4 beds |
show details |
| Photo | Address | Area | Beds / Baths | Price | Details |
|---|---|---|---|---|---|

|
#41
Maple Dr
Columbiaville, MI 48421
|
- sq. feet
|
2 baths 3 beds |
show details | |

|
#42
W Burnside Rd
Fostoria, MI 48435
|
- sq. feet
|
2 baths 3 beds |
show details | |

|
#43
Tuscola Rd
Clio, MI 48420
|
- sq. feet
|
2 baths 3 beds |
show details | |

|
#44
Canada Rd
Birch Run, MI 48415
|
1,356 sq. feet
|
1 baths 2 beds |
show details | |

|
#45
E Ruth Ave
Flint, MI 48505
|
1,320 sq. feet
|
1 baths 4 beds |
show details | |

|
#46
E Russell Ave
Flint, MI 48505
|
1,468 sq. feet
|
1 baths 3 beds |
show details | |

|
#47
Wilton Pl
Flint, MI 48506
|
1,327 sq. feet
|
2 baths 3 beds |
show details | |

|
#48
Dixie Hwy
Birch Run, MI 48415
|
2,265 sq. feet
|
2 baths 3 beds |
show details | |

|
#49
Country Run Dr
Birch Run, MI 48415
|
1,505 sq. feet
|
2 baths 3 beds |
show details | |

|
Check over 1 million property listings on Foreclosure.com!
|
browse all offers | |||

Latest news about housing in Millington, MI collected exclusively by city-data.com from local newspapers, TV, and radio stations

 | Clio? (7 replies) |
| Where to live in MI??? (52 replies) |
| Moving a little west from Port Huron area (14 replies) |
| Frankenmuth and Birch Run nice places!! (9 replies) |
| poor ole Flint, Michigan! (8 replies) |
Median year apartment built: 1970
Household type by relationship:
Households: 1,094- Male householders: 208 (62 living alone), Female householders: 287 (139 living alone)
171 spouses (171 opposite-sex spouses), 53 unmarried partners, (53 opposite-sex unmarried partners), 307 children (272 natural, 5 adopted, 28 stepchildren), 20 grandchildren, 3 brothers or sisters, 4 parents, 0 foster children, 4 other relatives, 30 non-relatives
Size of family households: 112 2-persons, 73 3-persons, 42 4-persons, 22 5-persons, 8 6-persons.
Size of nonfamily households: 210 1-person, 21 2-persons, 17 3-persons.
115 married couples with children.
85 single-parent households (40 men, 45 women).
98.2% of residents of Millington speak English at home.
1.3% of residents speak Spanish at home (100% speak English very well).
0.4% of residents speak other Indo-European language at home (100% speak English very well).
Foreign born population: 20 (1.8%)
(100.0% of them are naturalized citizens)
| Here: | 6.1 |
| State: | 6.5 |
| Here: | 4.5 |
| State: | 4.3 |
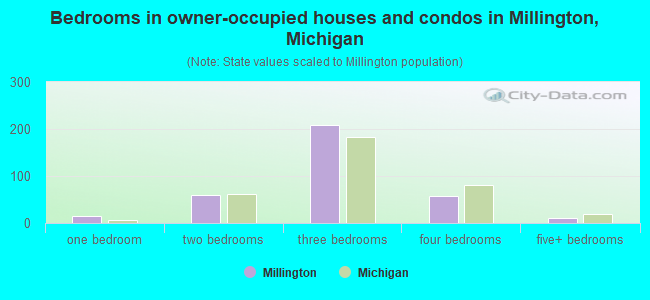
- Bedrooms in owner-occupied houses and condos in Millington, Michigan
- 0no bedroom
- 151 bedroom
- 602 bedrooms
- 2083 bedrooms
- 584 bedrooms
- 115+ bedrooms
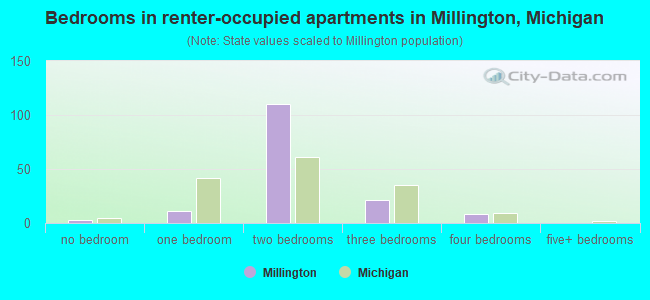
- Bedrooms in renter-occupied apartments in Millington, Michigan
- 3no bedroom
- 111 bedroom
- 1102 bedrooms
- 213 bedrooms
- 84 bedrooms
- 05+ bedrooms
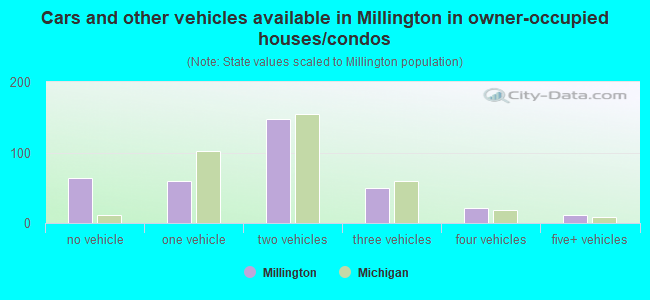
- Cars and other vehicles available in Millington in owner-occupied houses/condos
- 64no vehicle
- 601 vehicle
- 1472 vehicles
- 493 vehicles
- 214 vehicles
- 115+ vehicles
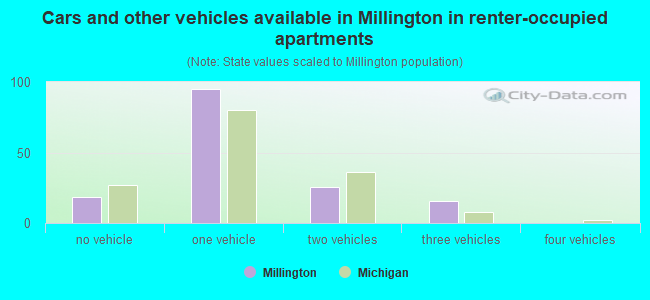
- Cars and other vehicles available in Millington in renter-occupied apartments
- 18no vehicle
- 951 vehicle
- 262 vehicles
- 153 vehicles
- 04 vehicles
- 05+ vehicles
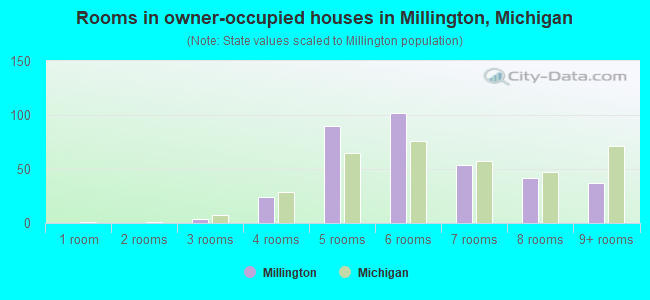
- Rooms in owner-occupied houses in Millington, Michigan
- 01 room
- 02 rooms
- 43 rooms
- 244 rooms
- 905 rooms
- 1026 rooms
- 547 rooms
- 428 rooms
- 379+ rooms
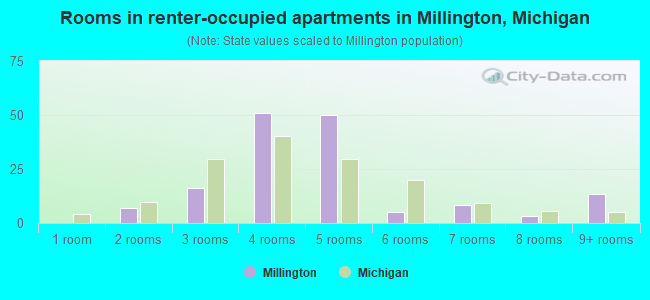
- Rooms in renter-occupied apartments in Millington, Michigan
- 01 room
- 72 rooms
- 163 rooms
- 514 rooms
- 505 rooms
- 56 rooms
- 87 rooms
- 38 rooms
- 139+ rooms
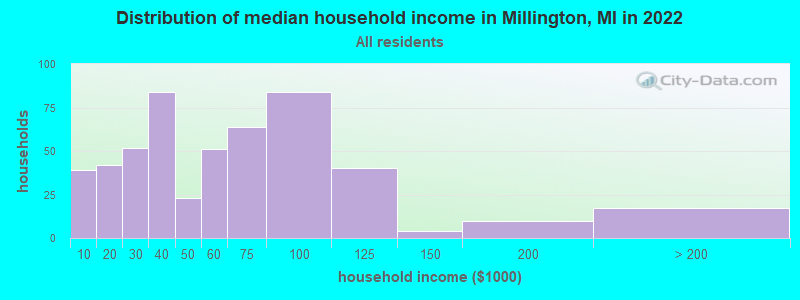
Millington, MI household income distribution

- 39Less than $10,000
- 42$10,000 to $19,999
- 52$20,000 to $29,999
- 84$30,000 to $39,999
- 23$40,000 to $49,999
- 51$50,000 to $59,999
- 64$60,000 to $74,999
- 84$75,000 to $99,999
- 40$100,000 to $124,999
- 4$125,000 to $149,999
- 10$150,000 to $199,999
- 17$200,000 or more
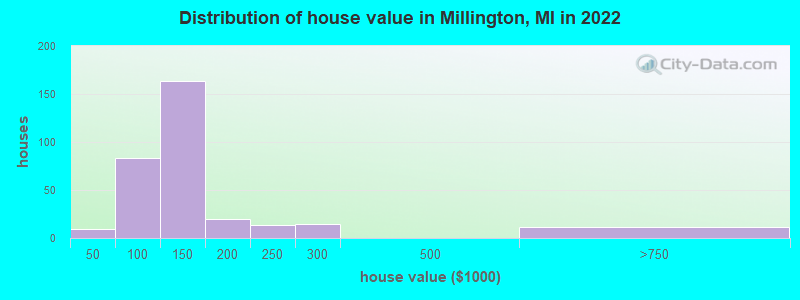
Home value of owner - occupied houses in 2022 in Millington, MI
-
- 5Less than $10,000
- 3$20,000 to $24,999
- 4$50,000 to $59,999
- 5$60,000 to $69,999
- 7$70,000 to $79,999
- 33$80,000 to $89,999
- 31$90,000 to $99,999
- 123$100,000 to $124,999
- 40$125,000 to $149,999
- 12$150,000 to $174,999
- 7$175,000 to $199,999
- 13$200,000 to $249,999
- 15$250,000 to $299,999
- 10$500,000 to $749,999
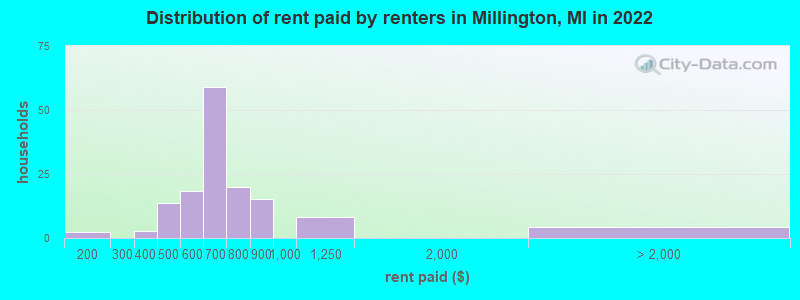
Rent paid by renters in 2022 in Millington, MI
-
- 2$150 to $199
- 2$350 to $399
- 3$400 to $449
- 10$450 to $499
- 1$500 to $549
- 17$550 to $599
- 36$600 to $649
- 22$650 to $699
- 15$700 to $749
- 4$750 to $799
- 15$800 to $899
- 8$1,000 to $1,249
- 4No cash rent
Percentage of workers working in this county: 41.1%
Number of people working at home: 4 (0.8% of all workers)
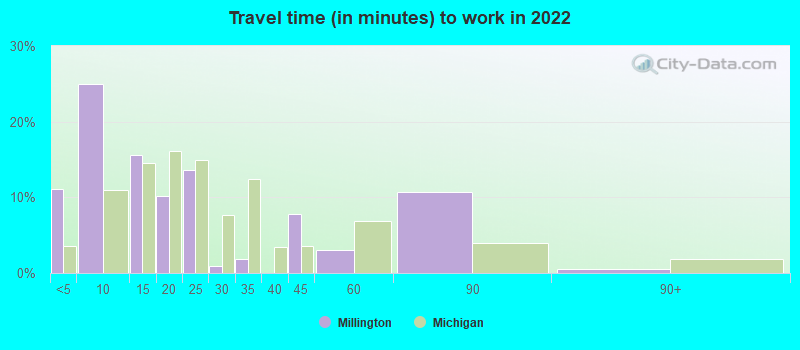
Travel time to work (commute)
- Less than 5 minutes: 67
- 5 to 9 minutes: 55
- 10 to 14 minutes: 13
- 15 to 19 minutes: 35
- 20 to 24 minutes: 55
- 25 to 29 minutes: 17
- 30 to 34 minutes: 47
- 35 to 39 minutes: 12
- 40 to 44 minutes: 33
- 45 to 59 minutes: 45
- 60 to 89 minutes: 77
- 90 or more minutes: 29
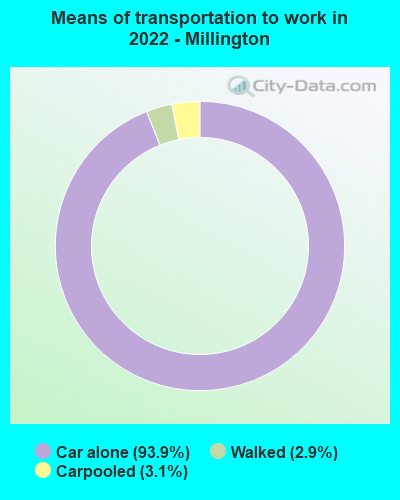
Means of transportation to work:
- Drove a car alone: 531 (89.7%)
- Carpooled: 17 (2.9%)
- Walked: 16 (2.7%)
- Worked at home: 4 (0.7%)
- Unemployment by race in 2022
- Unemployment rate for White non-Hispanic residents
- 2.3%Males
- 2.2%Females
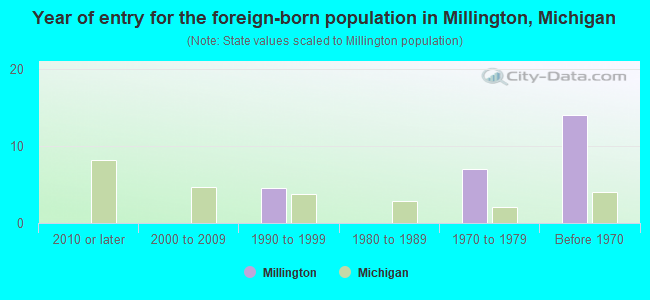
- Year of entry for the foreign-born population in Millington, Michigan
- 02010 or later
- 02000 to 2009
- 41990 to 1999
- 01980 to 1989
- 71970 to 1979
- 14Before 1970
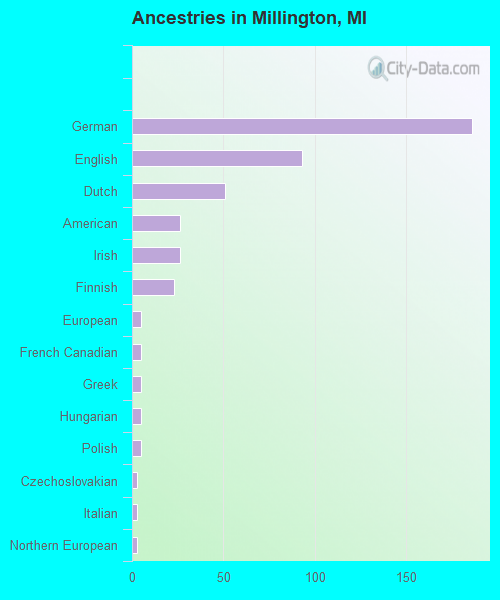
First ancestries reported:
- German: 186 (36.0%)
- English: 93 (18.0%)
- Dutch: 51 (9.9%)
- American: 26 (5.0%)
- Irish: 26 (5.0%)
- Finnish: 23 (4.5%)
- European: 5 (1.0%)
- French Canadian: 5 (1.0%)
- Greek: 5 (1.0%)
- Hungarian: 5 (1.0%)
- Polish: 5 (1.0%)
- Czechoslovakian: 3 (0.6%)
- Italian: 3 (0.6%)
- Northern European: 3 (0.6%)
Most common places of birth for foreign-born residents (%):
| Millington: | 50.0% (10) |
| Michigan: | 3.0% (20,884) |
| Millington: | 20.0% (4) |
| Michigan: | 5.0% (35,052) |
| Millington: | 15.0% (3) |
| Michigan: | 2.3% (16,126) |
Place of birth for U.S.-born residents:
- This state: 930
- Other state: 135
- Northeast: 20
- Midwest: 86
- South: 7
- West: 21
84.3% of Millington residents lived in the same house 1 years ago.
Out of people who lived in different houses, 24.5% lived in this county.
Out of people who lived in different counties, 91.3% lived in Michigan.
| Millington: | 84.3% |
| State average: | 88.4% |
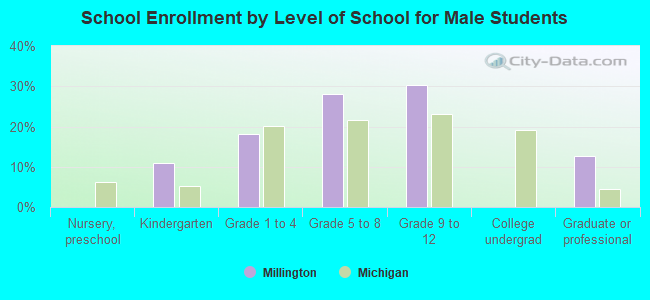
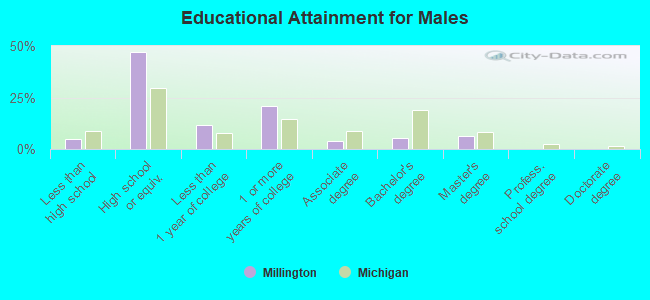
Education attainment for males 25 years and older:
- No schooling: 0
- Nursery to 4th grade: 0
- 5th and 6th grade: 0
- 7th and 8th grade: 0
- 9th grade: 3
- 10th grade: 9
- 11th grade: 5
- 12th grade, no diploma: 0
- High school graduate (or equivalency): 162
- Less than 1 year of college: 40
- Some college more than 1 year, no degree: 72
- Associate degree: 13
- Bachelor's degree: 18
- Master's degree: 22
- Professional school degree: 0
- Doctorate degree: 0
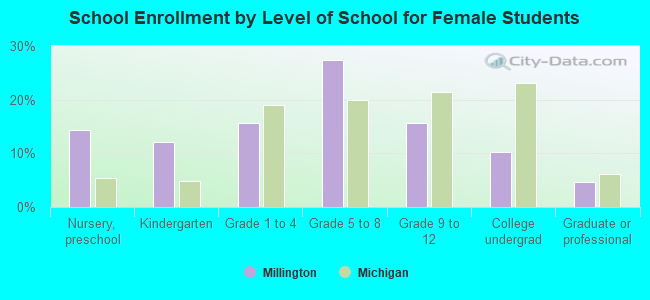
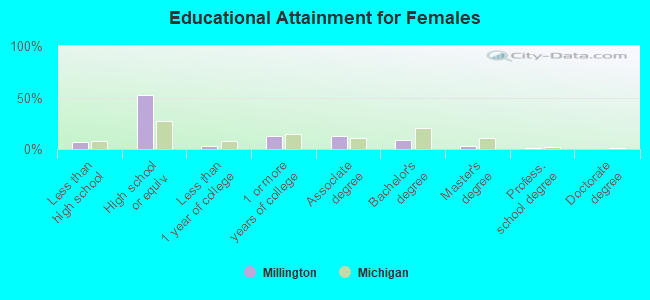
Education attainment for females 25 years and older:
- No schooling: 4
- Nursery to 4th grade: 0
- 5th and 6th grade: 0
- 7th and 8th grade: 0
- 9th grade: 0
- 10th grade: 20
- 11th grade: 0
- 12th grade, no diploma: 3
- High school graduate (or equivalency): 223
- Less than 1 year of college: 13
- Some college more than 1 year, no degree: 52
- Associate degree: 55
- Bachelor's degree: 35
- Master's degree: 14
- Professional school degree: 4
- Doctorate degree: 0
Housing units in structures:
- One, detached: 430
- Two: 21
- 3 or 4: 6
- 5 to 9: 87
- Mobile homes: 8
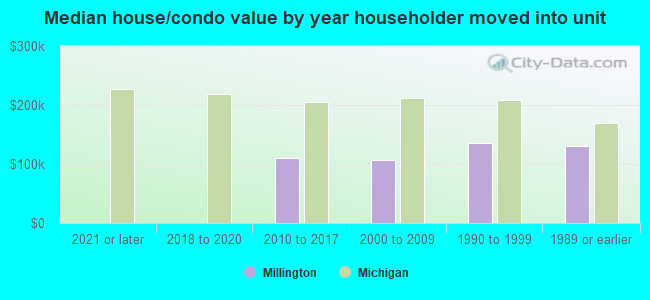
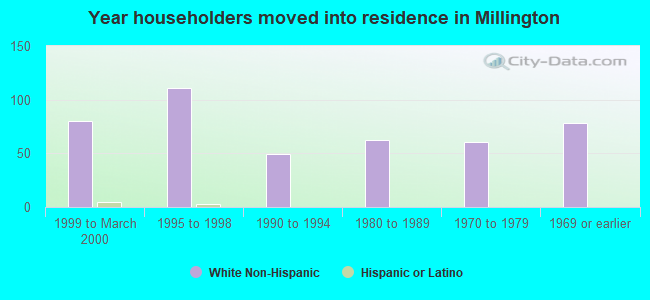
House/condo owner moved in on average 19 years ago
Renter moved in on average 2 years ago
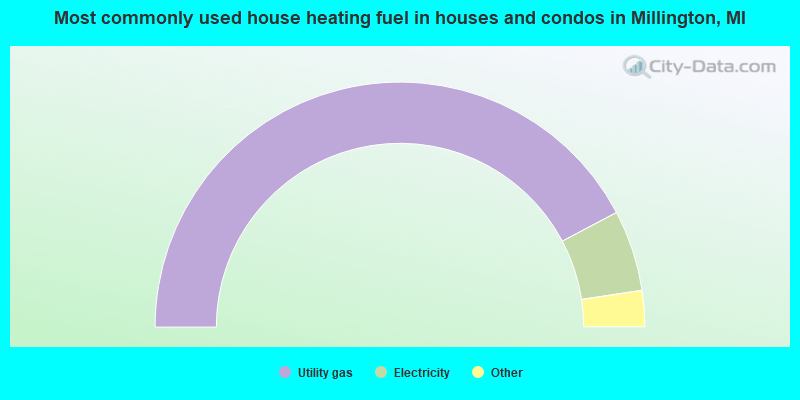
- 84.7%Utility gas
- 10.7%Electricity
- 2.3%Fuel oil, kerosene, etc.
- 1.2%Bottled, tank, or LP gas
- 1.2%Wood
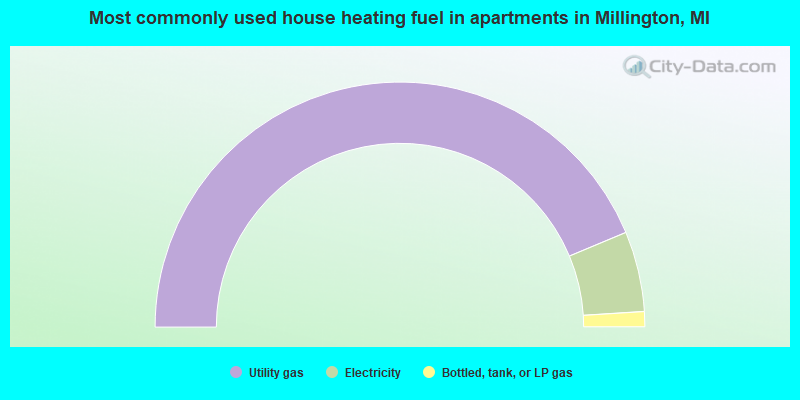
- 87.4%Utility gas
- 10.6%Electricity
- 2.0%Bottled, tank, or LP gas
Private vs. public school enrollment:
| Here: | 4.5% |
| Michigan: | 12.4% |
| Here: | 0.0% |
| Michigan: | 9.8% |
| Here: | 0.0% |
| Michigan: | 14.9% |