Millville, NJ (New Jersey) Houses and Residents
Estimated median house or condo value in 2022: $194,435 (it was $86,300 in 2000 )
Millville:
$194,435New Jersey:
$428,900
Lower value quartile - upper value quartile: $128,779 - $255,085Mean price in 2022: Detached houses: $281,663 Here:
$281,663State:
$537,591
Townhouses or other attached units: $156,257 Here:
$156,257State:
$381,113
In 2-unit structures: $246,121 Here:
$246,121State:
$444,476
In 5-or-more-unit structures: $384,649 Here:
$384,649State:
$368,745
Mobile homes: $71,994 Here:
$71,994State:
$119,788
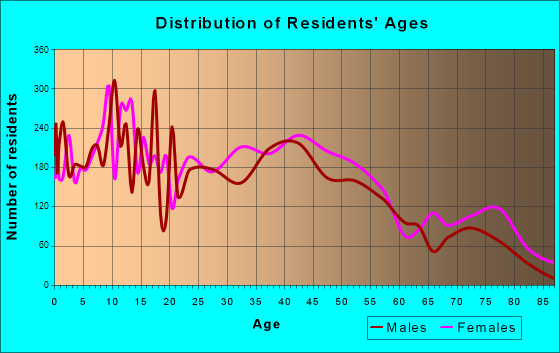
Total population: 28,497 (Urban population: 23,075 (22,307 inside urbanized areas, 768 inside urban clusters ), Rural population: 3,772 (114 farm, 3,658 nonfarm ))
Houses: 12,380 (11,668 occupied: 7,974 owner occupied, 4,197 renter occupied )
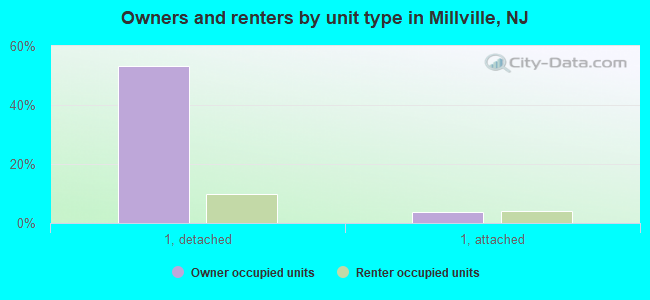
% of renters here:
34%State:
35%
Housing density: 292 houses/condos per square mile
Median price asked for vacant for-sale houses and condos in 2022: $1,379,495.
Median contract rent in 2022: $884 (lower quartile is $664, upper quartile is $1,148)
Median rent asked for vacant for-rent units in 2022: $278
Median gross rent in Millville, NJ in 2022: $1,105
Housing units in Millville with a mortgage: 4,926 (357 second mortgage, 0 home equity loan, 256 both second mortgage and home equity loan )Houses without a mortgage: 224
Median household income for houses/condos with a mortgage: $87,266
Median household income for apartments without a mortgage: $73,942
Median monthly housing costs: $1,177
Data:
Median house or condo value ($)
Median house or condo value ($ change since 2000)
Median house or condo value ($) - White
Median house or condo value ($) - Black or African American
Median house or condo value ($) - Asian
Median house or condo value ($) - Hispanic or Latino
Median house or condo value ($) - American Indian and Alaska Native
Median house or condo value ($) - Multirace
Median house or condo value ($) - Other Race
Median price asked for mobile homes ($)
Household density (households per square mile)
Mean house or condo value by units in structure - 1, detached ($)
Mean house or condo value by units in structure - 1, attached ($)
Mean house or condo value by units in structure - 2 ($)
Mean house or condo value by units in structure by units in structure - 3 or 4 ($)
Mean house or condo value by units in structure - 5 or more ($)
Mean house or condo value by units in structure - Boat, RV, van, etc. ($)
Mean house or condo value by units in structure - Mobile home ($)
Median contract rent ($)
Median contract rent - Lower quartile ($)
Median contract rent - Upper quartile ($)
Median gross rent ($)
Urban houses (%)
Rural houses (%)
Houses occupied (%)
Houses occupied (% change since 2000)
Houses owner occupied (%)
Houses owner occupied (% change since 2000)
Houses renter occupied (%)
Houses renter occupied (% change since 2000)
Vacant housing units - For rent (%)
Vacant housing units - For rent (% change since 2000)
Vacant housing units - For sale only (%)
Vacant housing units - For sale only (% change since 2000)
Vacant housing units - Rented or sold, not occupied (%)
Vacant housing units - Rented or sold, not occupied (% change since 2000)
Vacant housing units - For seasonal, recreational, or occasional use (%)
Vacant housing units - For seasonal, recreational, or occasional use (% change since 2000)
Vacant housing units - For migrant workers (%)
Vacant housing units - For migrant workers (% change since 2000)
Vacant housing units - Other vacant (%)
Vacant housing units - Other vacant (% change since 2000)
Median monthly housing costs ($)
Median household income for houses/condos with a mortgage ($)
Median household income for houses/condos without a mortgage ($)
Median household income ($)
Median household income ($) - White
Median household income ($) - Black or African American
Median household income ($) - Asian
Median household income ($) - Hispanic or Latino
Median household income ($) - American Indian and Alaska Native
Median household income ($) - Multirace
Median household income ($) - Other Race
Mortgage status - with mortgage (%)
Mortgage status - with second mortgage (%)
Mortgage status - with home equity loan (%)
Mortgage status - with both second mortgage and home equity loan (%)
Mortgage status - without a mortgage (%)
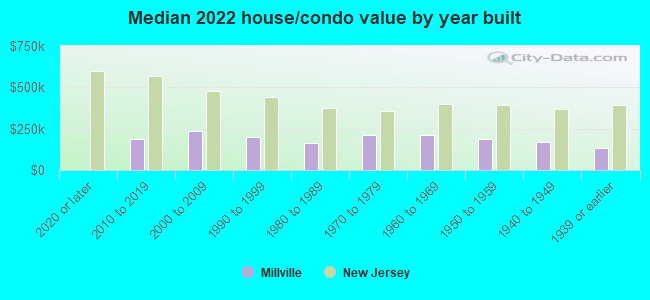
Median year house/condo built
Median year apartment built
Household type by relationship - Male householder living alone (%)
Household type by relationship - Male householder not living alone (%)
Household type by relationship - Female householder living alone (%)
Household type by relationship - Female householder not living alone (%)
Household type by relationship - Opposite-Sex spouse (%)
Household type by relationship - Same-Sex spouse (%)
Household type by relationship - Opposite-Sex unmarried partner (%)
Household type by relationship - Same-Sex unmarried partner (%)
Household type by relationship - In group quarters (%)
Size of family households - 2-person household (%)
Size of family households - 3-person household (%)
Size of family households - 4-person household (%)
Size of family households - 5-person household (%)
Size of family households - 6-person household (%)
Size of family households - 7-or-more-person household (%)
Size of nonfamily households - 1-person household (%)
Size of nonfamily households - 2-person household (%)
Size of nonfamily households - 3-person household (%)
Size of nonfamily households - 4-person household (%)
Size of nonfamily households - 5-person household (%)
Size of nonfamily households - 6-person household (%)
Size of nonfamily households - 7-or-moreperson household (%)
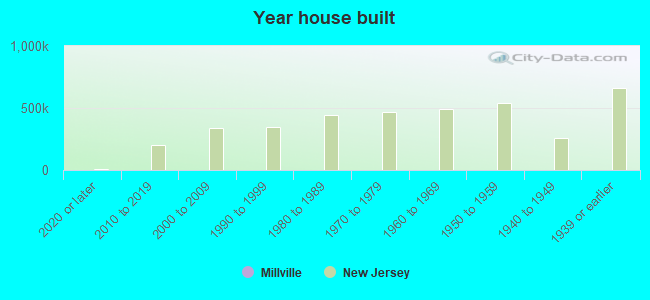
Year house built - Built 2010 or later (%)
Year house built - Built 2000 to 2009 (%)
Year house built - Built 1990 to 1999 (%)
Year house built - Built 1980 to 1989 (%)
Year house built - Built 1970 to 1979 (%)
Year house built - Built 1960 to 1969 (%)
Year house built - Built 1950 to 1959 (%)
Year house built - Built 1940 to 1949 (%)
Year house built - Built 1939 or earlier (%)
Median number of rooms in houses and condos
Median number of rooms in apartments
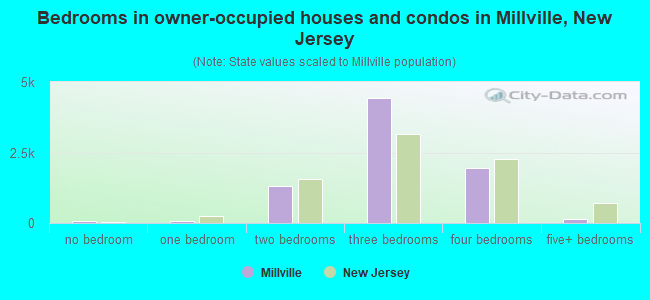
Median number of bedrooms in owner occupied houses
Mean number of bedrooms in owner occupied houses
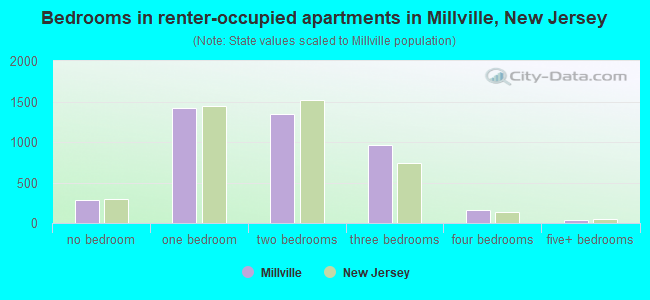
Median number of bedrooms in renter occupied houses
Mean number of bedrooms in renter occupied houses
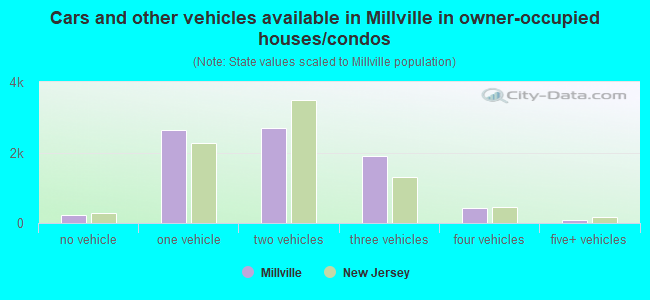
Median number of vehichles in owner occupied houses
Mean number of vehichles in owner occupied houses
Median number of vehichles in renter occupied houses
Mean number of vehichles in renter occupied houses
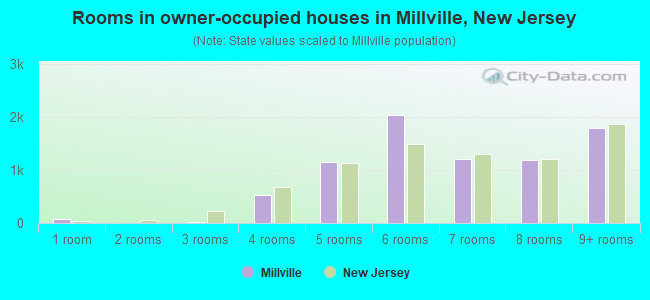
Rooms in owner-occupied houses - 1 room (%)
Rooms in owner-occupied houses - 2 rooms (%)
Rooms in owner-occupied houses - 3 rooms (%)
Rooms in owner-occupied houses - 4 rooms (%)
Rooms in owner-occupied houses - 5 rooms (%)
Rooms in owner-occupied houses - 6 rooms (%)
Rooms in owner-occupied houses - 7 rooms (%)
Rooms in owner-occupied houses - 8 rooms (%)
Rooms in owner-occupied houses - 9+ rooms (%)
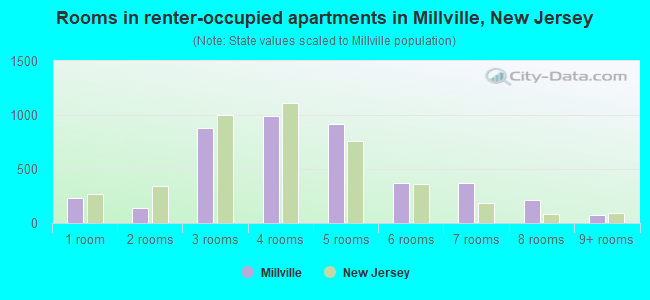
Rooms in renter-occupied houses - 1 room (%)
Rooms in renter-occupied houses - 2 rooms (%)
Rooms in renter-occupied houses - 3 rooms (%)
Rooms in renter-occupied houses - 4 rooms (%)
Rooms in renter-occupied houses - 5 rooms (%)
Rooms in renter-occupied houses - 6 rooms (%)
Rooms in renter-occupied houses - 7 rooms (%)
Rooms in renter-occupied houses - 8 rooms (%)
Rooms in renter-occupied houses - 9+ rooms (%)
Bedrooms in owner-occupied houses - no bedrooms (%)
Bedrooms in owner-occupied houses - 1 bedroom (%)
Bedrooms in owner-occupied houses - 2 bedrooms (%)
Bedrooms in owner-occupied houses - 3 bedrooms (%)
Bedrooms in owner-occupied houses - 4 bedrooms (%)
Bedrooms in owner-occupied houses - 5+ bedrooms (%)
Bedrooms in renter-occupied houses - no bedrooms (%)
Bedrooms in renter-occupied houses - 1 bedroom (%)
Bedrooms in renter-occupied houses - 2 bedrooms (%)
Bedrooms in renter-occupied houses - 3 bedrooms (%)
Bedrooms in renter-occupied houses - 4 bedrooms (%)
Bedrooms in renter-occupied houses - 5+ bedrooms (%)
Vehicles available in owner-occupied houses - no vehicle available (%)
Vehicles available in owner-occupied houses - 1 vehicle available(%)
Vehicles available in owner-occupied houses - 2 Vehicles available (%)
Vehicles available in owner-occupied houses - 3 Vehicles available (%)
Vehicles available in owner-occupied houses - 4 Vehicles available (%)
Vehicles available in owner-occupied houses - 5+ Vehicles available (%)
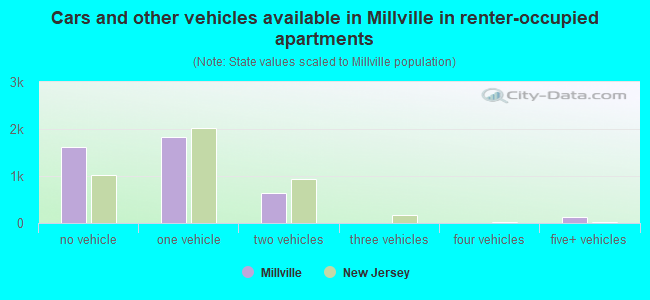
Vehicles available in renter-occupied houses - no vehicle available (%)
Vehicles available in renter-occupied houses - 1 vehicle available (%)
Vehicles available in renter-occupied houses - 2 Vehicles available (%)
Vehicles available in renter-occupied houses - 3 Vehicles available (%)
Vehicles available in renter-occupied houses - 4 Vehicles available (%)
Vehicles available in renter-occupied houses - 5+ Vehicles available (%)
Housing units in structures - 1, detached (%)
Housing units in structures - 1, attached (%)
Housing units in structures - 2 (%)
Housing units in structures - 3 or 4 (%)
Housing units in structures - 5 to 9 (%)
Housing units in structures - 10 to 19 (%)
Housing units in structures - 20 to 49 (%)
Housing units in structures - 50 or more (%)
Housing units in structures - Mobile home (%)
Housing units in structures - Boat, RV, van, etc. (%)
Housing units in structures - Owners - 1, detached (%)
Housing units in structures - Owners - 1, attached (%)
Housing units in structures - Owners - 2 (%)
Housing units in structures - Owners - 3 or 4 (%)
Housing units in structures - Owners - 5 to 9 (%)
Housing units in structures - Owners - 10 to 19 (%)
Housing units in structures - Owners - 20 to 49 (%)
Housing units in structures - Owners - 50 or more (%)
Housing units in structures - Owners - Mobile home (%)
Housing units in structures - Owners - Boat, RV, van, etc. (%)
Housing units in structures - Renters - 1, detached (%)
Housing units in structures - Renters - 1, attached (%)
Housing units in structures - Renters - 2 (%)
Housing units in structures - Renters - 3 or 4 (%)
Housing units in structures - Renters - 5 to 9 (%)
Housing units in structures - Renters - 10 to 19 (%)
Housing units in structures - Renters - 20 to 49 (%)
Housing units in structures - Renters - 50 or more (%)
Housing units in structures - Renters - Mobile home (%)
Housing units in structures - Renters - Boat, RV, van, etc. (%)
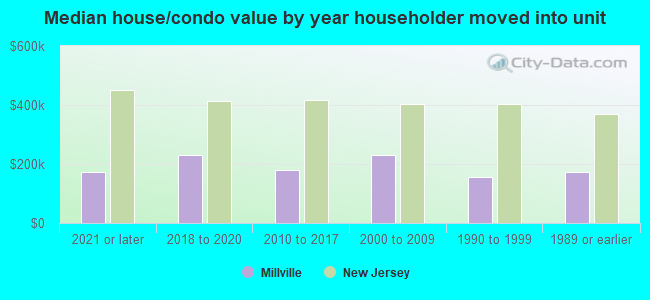
House/condo owner moved in on average (years ago)
Renter moved in on average (years ago)
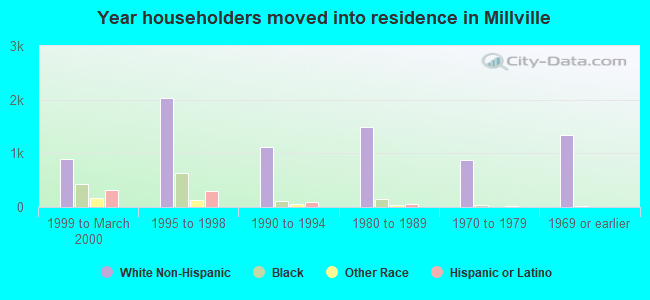
Year householder moved into unit - Moved in 1999 to March 2000 (%)
Year householder moved into unit - Moved in 1999 to March 2000 (%) - White
Year householder moved into unit - Moved in 1999 to March 2000 (%) - Black or African American
Year householder moved into unit - Moved in 1999 to March 2000 (%) - Asian
Year householder moved into unit - Moved in 1999 to March 2000 (%) - Hispanic or Latino
Year householder moved into unit - Moved in 1999 to March 2000 (%) - American Indian and Alaska Native
Year householder moved into unit - Moved in 1999 to March 2000 (%) - Multirace
Year householder moved into unit - Moved in 1999 to March 2000 (%) - Other Race
Year householder moved into unit - Moved in 1995 to 1998 (%)
Year householder moved into unit - Moved in 1995 to 1998 (%) - White
Year householder moved into unit - Moved in 1995 to 1998 (%) - Black or African American
Year householder moved into unit - Moved in 1995 to 1998 (%) - Asian
Year householder moved into unit - Moved in 1995 to 1998 (%) - Hispanic or Latino
Year householder moved into unit - Moved in 1995 to 1998 (%) - American Indian and Alaska Native
Year householder moved into unit - Moved in 1995 to 1998 (%) - Multirace
Year householder moved into unit - Moved in 1995 to 1998 (%) - Other Race
Year householder moved into unit - Moved in 1990 to 1994 (%)
Year householder moved into unit - Moved in 1990 to 1994 (%) - White
Year householder moved into unit - Moved in 1990 to 1994 (%) - Black or African American
Year householder moved into unit - Moved in 1990 to 1994 (%) - Asian
Year householder moved into unit - Moved in 1990 to 1994 (%) - Hispanic or Latino
Year householder moved into unit - Moved in 1990 to 1994 (%) - American Indian and Alaska Native
Year householder moved into unit - Moved in 1990 to 1994 (%) - Multirace
Year householder moved into unit - Moved in 1990 to 1994 (%) - Other Race
Year householder moved into unit - Moved in 1980 to 1989 (%)
Year householder moved into unit - Moved in 1980 to 1989 (%) - White
Year householder moved into unit - Moved in 1980 to 1989 (%) - Black or African American
Year householder moved into unit - Moved in 1980 to 1989 (%) - Asian
Year householder moved into unit - Moved in 1980 to 1989 (%) - Hispanic or Latino
Year householder moved into unit - Moved in 1980 to 1989 (%) - American Indian and Alaska Native
Year householder moved into unit - Moved in 1980 to 1989 (%) - Multirace
Year householder moved into unit - Moved in 1980 to 1989 (%) - Other Race
Year householder moved into unit - Moved in 1970 to 1979 (%)
Year householder moved into unit - Moved in 1970 to 1979 (%) - White
Year householder moved into unit - Moved in 1970 to 1979 (%) - Black or African American
Year householder moved into unit - Moved in 1970 to 1979 (%) - Asian
Year householder moved into unit - Moved in 1970 to 1979 (%) - Hispanic or Latino
Year householder moved into unit - Moved in 1970 to 1979 (%) - American Indian and Alaska Native
Year householder moved into unit - Moved in 1970 to 1979 (%) - Multirace
Year householder moved into unit - Moved in 1970 to 1979 (%) - Other Race
Year householder moved into unit - Moved in 1969 or earlier (%)
Year householder moved into unit - Moved in 1969 or earlier (%) - White
Year householder moved into unit - Moved in 1969 or earlier (%) - Black or African American
Year householder moved into unit - Moved in 1969 or earlier (%) - Asian
Year householder moved into unit - Moved in 1969 or earlier (%) - Hispanic or Latino
Year householder moved into unit - Moved in 1969 or earlier (%) - American Indian and Alaska Native
Year householder moved into unit - Moved in 1969 or earlier (%) - Multirace
Year householder moved into unit - Moved in 1969 or earlier (%) - Other Race
Housing units lacking complete plumbing facilities (%)
Housing units lacking complete kitchen facilities (%)
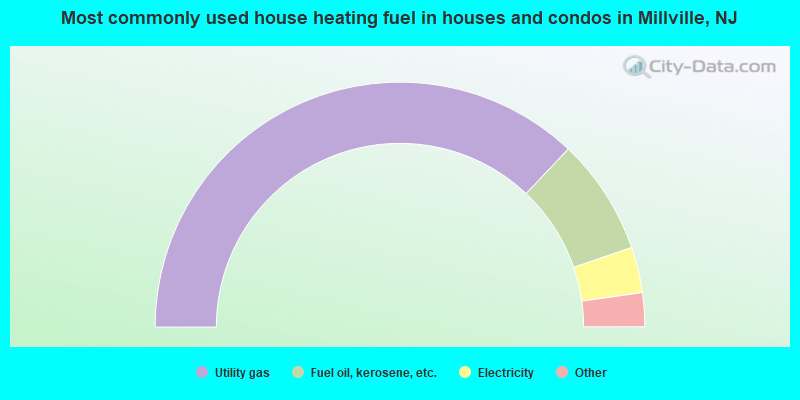
House heating fuel used in houses and condos - Utility gas (%)
House heating fuel used in houses and condos - Bottled, tank, or LP gas (%)
House heating fuel used in houses and condos - Electricity (%)
House heating fuel used in houses and condos - Fuel oil, kerosene, etc. (%)
House heating fuel used in houses and condos - Coal or coke (%)
House heating fuel used in houses and condos - Wood (%)
House heating fuel used in houses and condos - Solar energy (%)
House heating fuel used in houses and condos - Other fuel (%)
House heating fuel used in houses and condos - No fuel used (%)
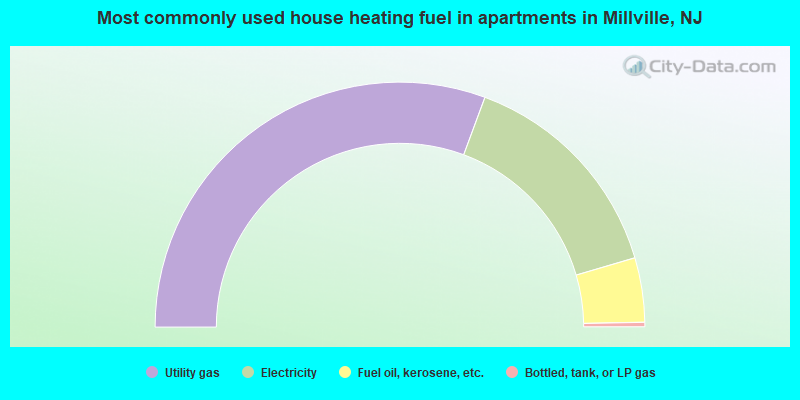
House heating fuel used in apartments - Utility gas (%)
House heating fuel used in apartments - Bottled, tank, or LP gas (%)
House heating fuel used in apartments - Electricity (%)
House heating fuel used in apartments - Fuel oil, kerosene, etc. (%)
House heating fuel used in apartments - Coal or coke (%)
House heating fuel used in apartments - Wood (%)
House heating fuel used in apartments - Solar energy (%)
House heating fuel used in apartments - Other fuel (%)
House heating fuel used in apartments - No fuel used (%)
Latest news about housing in Millville, NJ collected exclusively by city-data.com from local newspapers, TV, and radio stations
Median year house/condo built: 1971Median year apartment built: 1963Household type by relationship:
Households: 27,123
Male householders: 5,185 (1,653 living alone ), Female householders: 6,291 (2,051 living alone )4,446 spouses (4,430 opposite-sex spouses ), 960 unmarried partners , (960 opposite-sex unmarried partners ), 7,533 children (6,769 natural , 74 adopted , 689 stepchildren ), 939 grandchildren , 206 brothers or sisters , 354 parents , 0 foster children , 471 other relatives , 502 non-relatives In group quarters: 230
Size of family households: 3,424 2-persons , 1,475 3-persons , 1,898 4-persons , 473 5-persons , 134 6-persons , 197 7-or-more-persons .
Size of nonfamily households: 3,744 1-person , 779 2-persons , 43 3-persons .
2,700 married couples with children. single-parent households (267 men , 1,520 women ).
86.3% of residents of Millville speak English at home. of residents speak Spanish at home (56% speak English very well , 23% speak English well , 17% speak English not well , 4% don't speak English at all ).of residents speak other Indo-European language at home (65% speak English very well , 28% speak English well , 1% speak English not well , 6% don't speak English at all ).of residents speak Asian or Pacific Island language at home (41% speak English very well , 32% speak English well , 27% speak English not well ).of residents speak other language at home (100% speak English very well ).
Foreign born population: 2,036 (7.5%)of them are naturalized citizens )
Median number of rooms in houses and condos:
Median number of rooms in apartments
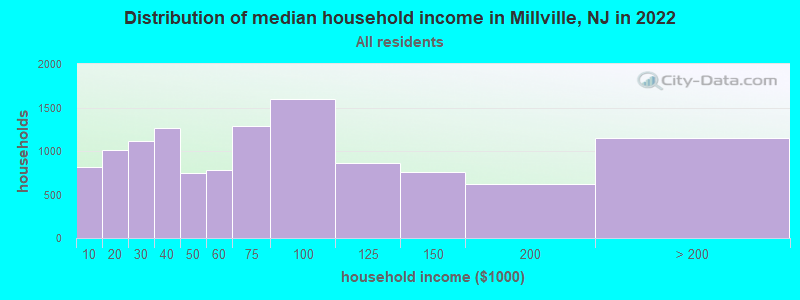
Millville, NJ household income distribution 813 Less than $10,0001,017 $10,000 to $19,9991,120 $20,000 to $29,9991,269 $30,000 to $39,999748 $40,000 to $49,999783 $50,000 to $59,9991,284 $60,000 to $74,9991,600 $75,000 to $99,999859 $100,000 to $124,999759 $125,000 to $149,999620 $150,000 to $199,9991,147 $200,000 or more
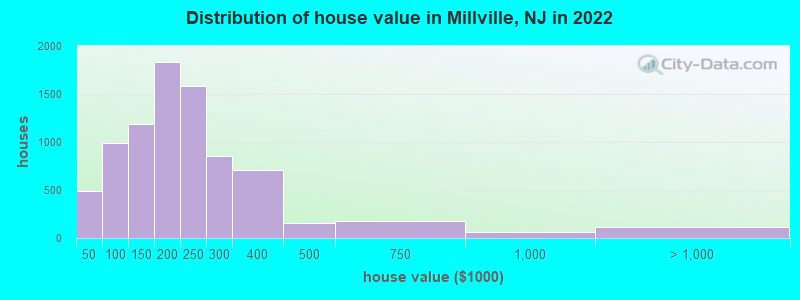
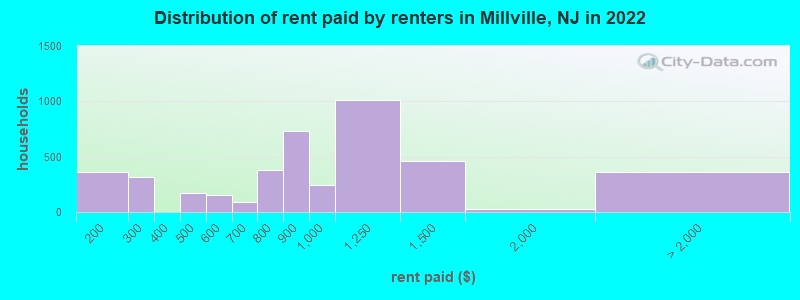
Home value of owner - occupied houses in 2022 in Millville, NJ 112 Less than $10,0006 $10,000 to $14,99971 $15,000 to $19,99917 $20,000 to $24,99937 $30,000 to $34,99981 $35,000 to $39,999162 $40,000 to $49,99942 $50,000 to $59,99971 $60,000 to $69,999193 $70,000 to $79,999202 $80,000 to $89,999316 $90,000 to $99,999628 $100,000 to $124,999556 $125,000 to $149,9991,085 $150,000 to $174,999750 $175,000 to $199,9991,587 $200,000 to $249,999853 $250,000 to $299,999707 $300,000 to $399,999154 $400,000 to $499,999178 $500,000 to $749,99963 $750,000 to $999,9999 $1,000,000 to $1,499,999107 $1,500,000 to $1,999,999Rent paid by renters in 2022 in Millville, NJ 124 $100 to $149232 $150 to $19973 $200 to $249244 $250 to $2992 $300 to $349125 $400 to $44950 $450 to $49946 $500 to $549106 $550 to $59987 $650 to $699192 $700 to $749183 $750 to $799728 $800 to $899246 $900 to $9991,011 $1,000 to $1,249456 $1,250 to $1,49927 $1,500 to $1,999138 $2,000 to $2,499218 No cash rent
Percentage of workers working in this county: 69.3%Number of people working at home: 820 (6.4% of all workers )
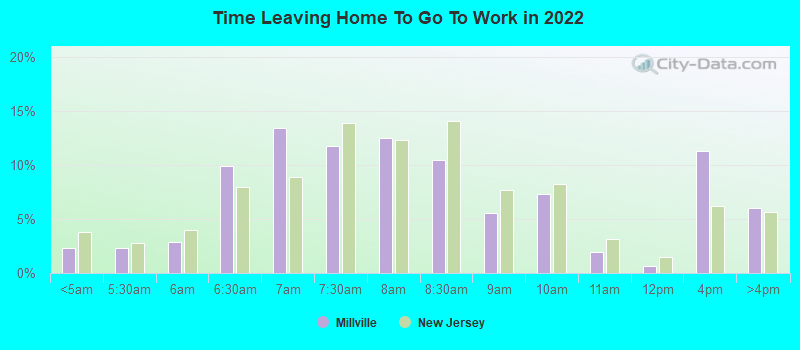
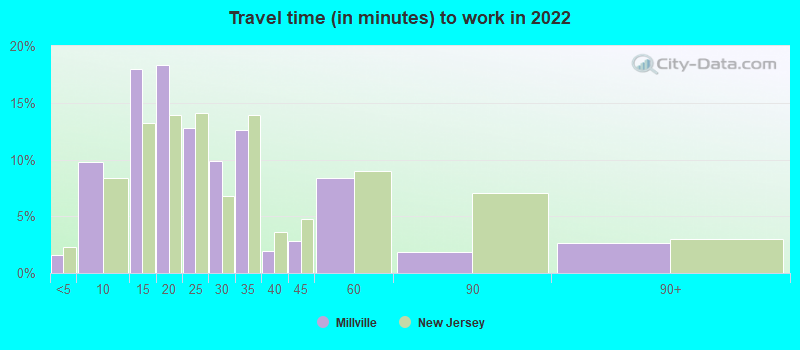
Travel time to work (commute)
Less than 5 minutes: 2565 to 9 minutes: 1,10510 to 14 minutes: 1,72315 to 19 minutes: 2,37220 to 24 minutes: 2,08225 to 29 minutes: 1,01530 to 34 minutes: 97835 to 39 minutes: 15740 to 44 minutes: 37645 to 59 minutes: 72260 to 89 minutes: 88990 or more minutes: 310
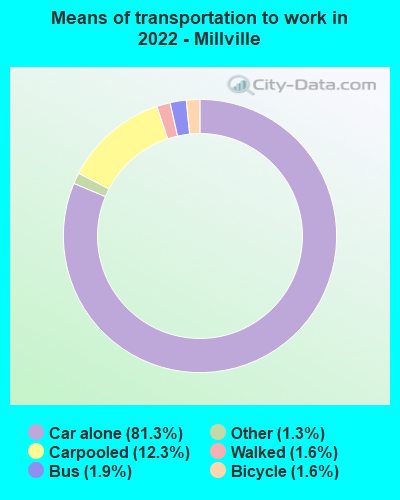
Means of transportation to work:
Drove a car alone: 7,496 (71.4%)Carpooled: 1,309 (12.5%)Bus : 167 (1.6%)Taxi: 139 (1.3%)Bicycle: 163 (1.6%)Walked: 171 (1.6%)Worked at home: 820 (7.8%)
Unemployment by race in 2022
Unemployment rate for White non-Hispanic residents 10.1% Males7.8% FemalesUnemployment rate for Black residents 7.4% Males11.4% FemalesUnemployment rate for Asian residents 18.5% MalesUnemployment rate for other race residents 4.8% Males9.7% FemalesUnemployment rate for Hispanic or Latino residents 11.2% Males4.8% Females
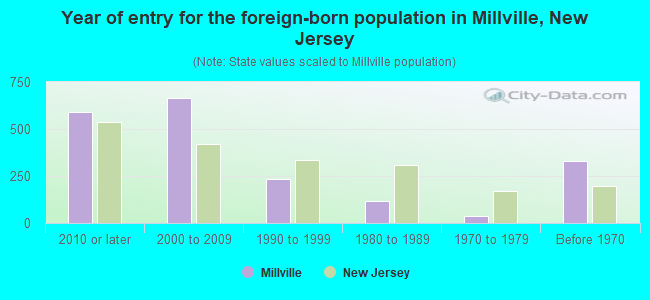
Year of entry for the foreign-born population in Millville, New Jersey
589 2010 or later 667 2000 to 2009 236 1990 to 1999 115 1980 to 1989 36 1970 to 1979 328 Before 1970
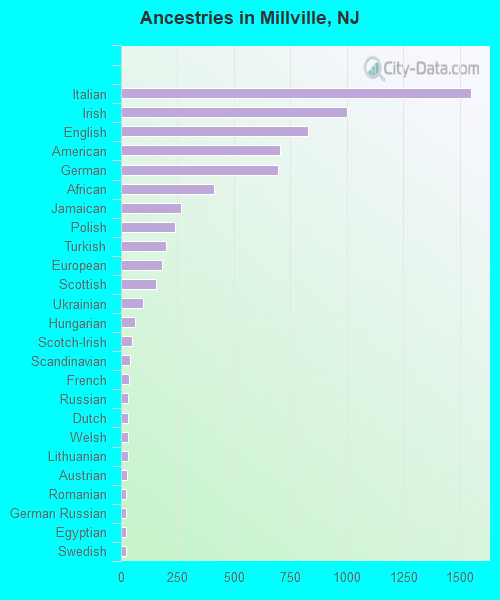
First ancestries reported:
Italian: 1,552 (12.7%)
Irish: 1,002 (8.2%)
English: 830 (6.8%)
American: 706 (5.8%)
German: 694 (5.7%)
African: 413 (3.4%)
Jamaican: 264 (2.2%)
Polish: 240 (2.0%)
Turkish: 200 (1.6%)
European: 182 (1.5%)
Scottish: 153 (1.2%)
Ukrainian: 99 (0.8%)
Hungarian: 63 (0.5%)
Scotch-Irish: 47 (0.4%)
Scandinavian: 41 (0.3%)
French: 36 (0.3%)
Russian: 32 (0.3%)
Dutch: 30 (0.2%)
Welsh: 30 (0.2%)
Lithuanian: 29 (0.2%)
Austrian: 27 (0.2%)
Romanian: 24 (0.2%)
German Russian: 23 (0.2%)
Egyptian: 22 (0.2%)
Swedish: 21 (0.2%)
Pennsylvania German: 20 (0.2%)
Norwegian: 19 (0.2%)
Greek: 18 (0.1%)
Czech: 17 (0.1%)
British: 16 (0.1%)
Eastern European: 14 (0.1%)
Northern European: 8 (0.07%)
West Indian: 8 (0.07%) Most common places of birth for foreign-born residents (%): India Millville:
19.5% (380)New Jersey:
12.8% (274,609)
Mexico Millville:
14.8% (287)New Jersey:
4.8% (102,527)
Jamaica Millville:
13.6% (265)New Jersey:
2.2% (47,365)
Turkey Millville:
6.6% (128)New Jersey:
0.8% (16,778)
Honduras Millville:
6.3% (123)New Jersey:
1.7% (37,335)
Germany Millville:
4.2% (82)New Jersey:
0.8% (17,217)
Poland Millville:
3.7% (71)New Jersey:
2.3% (48,811)
Korea Millville:
3.5% (69)New Jersey:
3.3% (70,512)
Philippines Millville:
3.3% (65)New Jersey:
4.0% (85,934)
Ecuador Millville:
2.1% (41)New Jersey:
4.4% (95,275)
Italy Millville:
2.0% (39)New Jersey:
1.5% (33,198)
Cuba Millville:
2.0% (39)New Jersey:
2.1% (45,435)
Africa, n.e.c. Millville:
1.9% (37)New Jersey:
0.3% (5,393)
Colombia Millville:
1.9% (36)New Jersey:
4.2% (90,817)
Brazil Millville:
1.8% (35)New Jersey:
2.1% (46,020)
England Millville:
1.7% (34)New Jersey:
0.5% (10,886)
Ukraine Millville:
1.6% (31)New Jersey:
1.1% (22,760)
Place of birth for U.S.-born residents:
This state: 19,127Other state: 4,717Northeast: 2,906Midwest: 261South: 836West: 837 90.4% of Millville residents lived in the same house 1 years ago.
Out of people who lived in different houses, 41.3% lived in this county.
Out of people who lived in different counties, 35.0% lived in New Jersey.
Millville:
90.4%State average:
90.4%
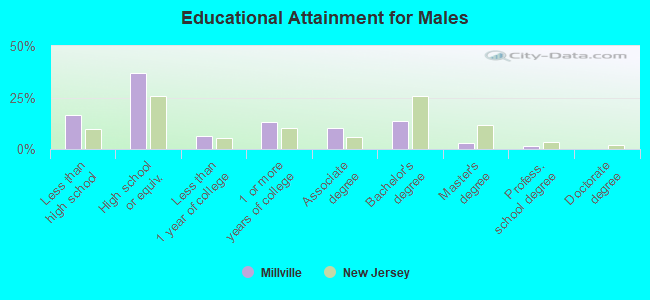
Education attainment for males 25 years and older:
No schooling: 459Nursery to 4th grade: 335th and 6th grade: 477th and 8th grade: 2939th grade: 8510th grade: 29211th grade: 20912th grade, no diploma: 109High school graduate (or equivalency): 3,414Less than 1 year of college: 565Some college more than 1 year, no degree: 1,199Associate degree: 943Bachelor's degree: 1,246Master's degree: 256Professional school degree: 152Doctorate degree: 10
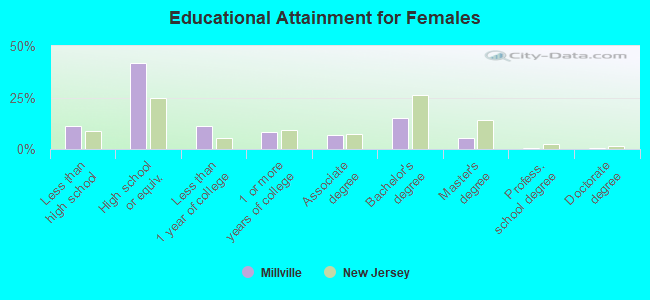
Education attainment for females 25 years and older:
No schooling: 275Nursery to 4th grade: 365th and 6th grade: 797th and 8th grade: 1339th grade: 5410th grade: 23411th grade: 11812th grade, no diploma: 222High school graduate (or equivalency): 4,307Less than 1 year of college: 1,162Some college more than 1 year, no degree: 840Associate degree: 680Bachelor's degree: 1,523Master's degree: 529Professional school degree: 27Doctorate degree: 55
Housing units in structures:
One, detached: 8,171One, attached: 1,060Two: 2733 or 4: 6505 to 9: 43410 to 19: 27720 to 49: 21950 or more: 997Mobile homes: 233Boats, RVs, vans, etc.: 61Median worth of mobile homes: $91,840
Housing units lacking complete plumbing facilities in 2022: 1.0%Housing units lacking complete kitchen facilities in 2022: 2.7%House/condo owner moved in on average 14 years ago
Renter moved in on average 5 years ago
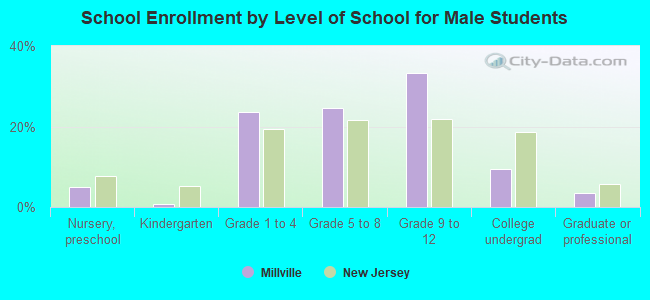
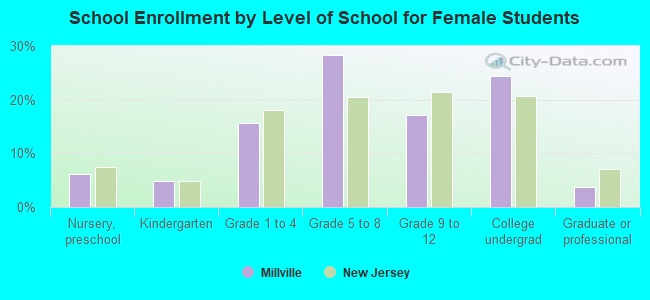
Private vs. public school enrollment:
Students in private schools in grades 1 to 8 (elementary and middle school): 60 Here:
2.2%New Jersey:
12.3%
Students in private schools in grades 9 to 12 (high school): 20 Here:
1.4%New Jersey:
13.1%
Students in private undergraduate colleges: 106 Here:
11.1%New Jersey:
33.2%