Missoula, MT (Montana) Houses and Residents
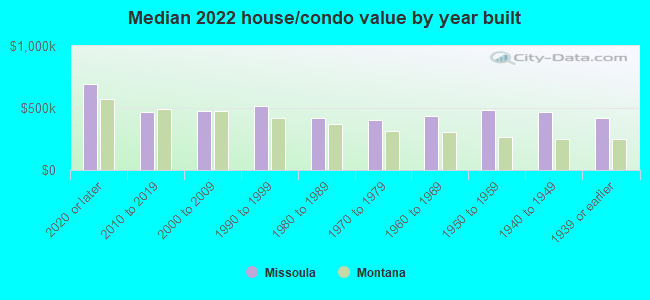
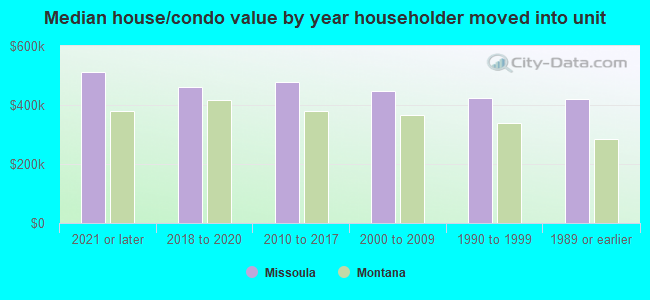
Estimated median house or condo value in 2022: $460,100 (it was $127,900 in 2000 )
Missoula:
$460,100Montana:
$366,400
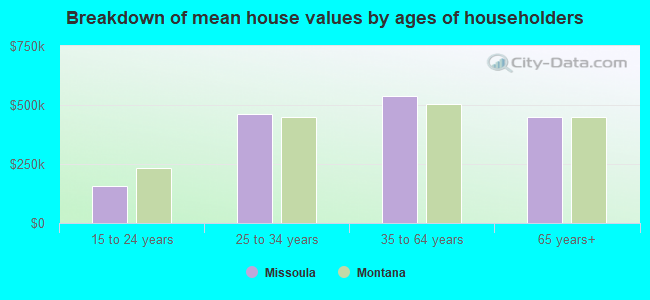
Lower value quartile - upper value quartile: $326,300 - $657,900Mean price in 2022: Detached houses: $527,253 Here:
$527,253State:
$518,333
Townhouses or other attached units: $426,873 Here:
$426,873State:
$468,033
In 2-unit structures: $197,158 Here:
$197,158State:
$254,784
In 3-to-4-unit structures: $366,104 Here:
$366,104State:
$383,074
In 5-or-more-unit structures: $221,580 Here:
$221,580State:
$373,935
Mobile homes: $37,058 Here:
$37,058State:
$139,111
Total population: 69,821 (Urban population: 56,319, Rural population: 649 (28 farm, 621 nonfarm ))
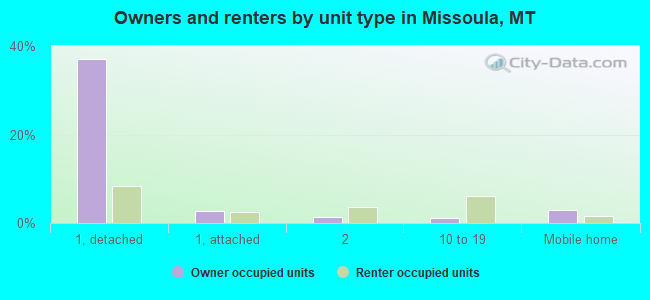
Houses: 37,628 (35,840 occupied: 16,688 owner occupied, 19,152 renter occupied )
% of renters here:
53%State:
31%
Housing density: 1,581 houses/condos per square mile
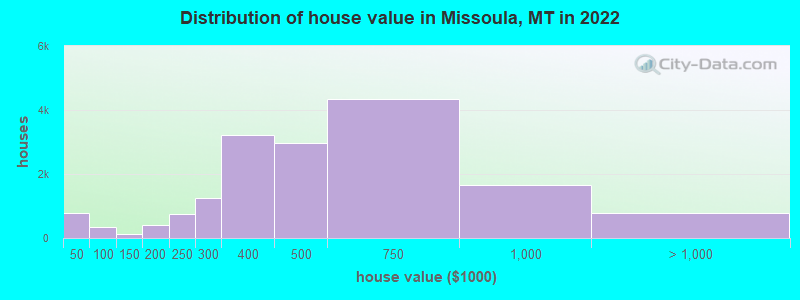
Median price asked for vacant for-sale houses and condos in 2022: $420,628.
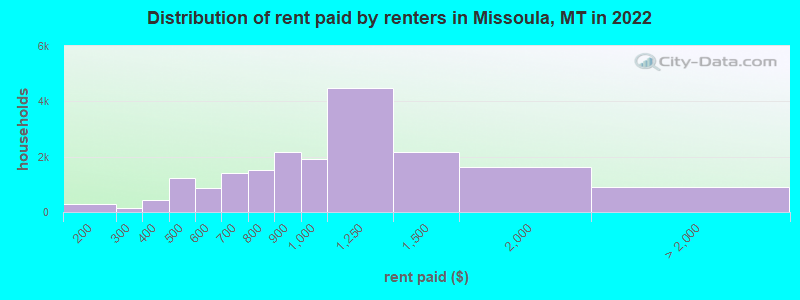
Median contract rent in 2022: $967 (lower quartile is $739, upper quartile is $1,225)
Median rent asked for vacant for-rent units in 2022: $1,735
Median gross rent in Missoula, MT in 2022: $1,044
Housing units in Missoula with a mortgage: 11,327 (1,254 second mortgage, 45 home equity loan, 984 both second mortgage and home equity loan )Houses without a mortgage: 223
Median household income for houses/condos with a mortgage: $101,681
Median household income for apartments without a mortgage: $57,281
Median monthly housing costs: $1,142
Data:
Median house or condo value ($)
Median house or condo value ($ change since 2000)
Median house or condo value ($) - White
Median house or condo value ($) - Black or African American
Median house or condo value ($) - Asian
Median house or condo value ($) - Hispanic or Latino
Median house or condo value ($) - American Indian and Alaska Native
Median house or condo value ($) - Multirace
Median house or condo value ($) - Other Race
Median price asked for mobile homes ($)
Household density (households per square mile)
Mean house or condo value by units in structure - 1, detached ($)
Mean house or condo value by units in structure - 1, attached ($)
Mean house or condo value by units in structure - 2 ($)
Mean house or condo value by units in structure by units in structure - 3 or 4 ($)
Mean house or condo value by units in structure - 5 or more ($)
Mean house or condo value by units in structure - Boat, RV, van, etc. ($)
Mean house or condo value by units in structure - Mobile home ($)
Median contract rent ($)
Median contract rent - Lower quartile ($)
Median contract rent - Upper quartile ($)
Median gross rent ($)
Urban houses (%)
Rural houses (%)
Houses occupied (%)
Houses occupied (% change since 2000)
Houses owner occupied (%)
Houses owner occupied (% change since 2000)
Houses renter occupied (%)
Houses renter occupied (% change since 2000)
Vacant housing units - For rent (%)
Vacant housing units - For rent (% change since 2000)
Vacant housing units - For sale only (%)
Vacant housing units - For sale only (% change since 2000)
Vacant housing units - Rented or sold, not occupied (%)
Vacant housing units - Rented or sold, not occupied (% change since 2000)
Vacant housing units - For seasonal, recreational, or occasional use (%)
Vacant housing units - For seasonal, recreational, or occasional use (% change since 2000)
Vacant housing units - For migrant workers (%)
Vacant housing units - For migrant workers (% change since 2000)
Vacant housing units - Other vacant (%)
Vacant housing units - Other vacant (% change since 2000)
Median monthly housing costs ($)
Median household income for houses/condos with a mortgage ($)
Median household income for houses/condos without a mortgage ($)
Median household income ($)
Median household income ($) - White
Median household income ($) - Black or African American
Median household income ($) - Asian
Median household income ($) - Hispanic or Latino
Median household income ($) - American Indian and Alaska Native
Median household income ($) - Multirace
Median household income ($) - Other Race
Mortgage status - with mortgage (%)
Mortgage status - with second mortgage (%)
Mortgage status - with home equity loan (%)
Mortgage status - with both second mortgage and home equity loan (%)
Mortgage status - without a mortgage (%)
Median year house/condo built
Median year apartment built
Household type by relationship - Male householder living alone (%)
Household type by relationship - Male householder not living alone (%)
Household type by relationship - Female householder living alone (%)
Household type by relationship - Female householder not living alone (%)
Household type by relationship - Opposite-Sex spouse (%)
Household type by relationship - Same-Sex spouse (%)
Household type by relationship - Opposite-Sex unmarried partner (%)
Household type by relationship - Same-Sex unmarried partner (%)
Household type by relationship - In group quarters (%)
Size of family households - 2-person household (%)
Size of family households - 3-person household (%)
Size of family households - 4-person household (%)
Size of family households - 5-person household (%)
Size of family households - 6-person household (%)
Size of family households - 7-or-more-person household (%)
Size of nonfamily households - 1-person household (%)
Size of nonfamily households - 2-person household (%)
Size of nonfamily households - 3-person household (%)
Size of nonfamily households - 4-person household (%)
Size of nonfamily households - 5-person household (%)
Size of nonfamily households - 6-person household (%)
Size of nonfamily households - 7-or-moreperson household (%)
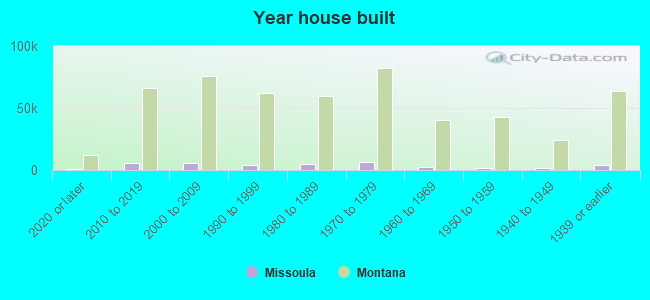
Year house built - Built 2010 or later (%)
Year house built - Built 2000 to 2009 (%)
Year house built - Built 1990 to 1999 (%)
Year house built - Built 1980 to 1989 (%)
Year house built - Built 1970 to 1979 (%)
Year house built - Built 1960 to 1969 (%)
Year house built - Built 1950 to 1959 (%)
Year house built - Built 1940 to 1949 (%)
Year house built - Built 1939 or earlier (%)
Median number of rooms in houses and condos
Median number of rooms in apartments
Median number of bedrooms in owner occupied houses
Mean number of bedrooms in owner occupied houses
Median number of bedrooms in renter occupied houses
Mean number of bedrooms in renter occupied houses
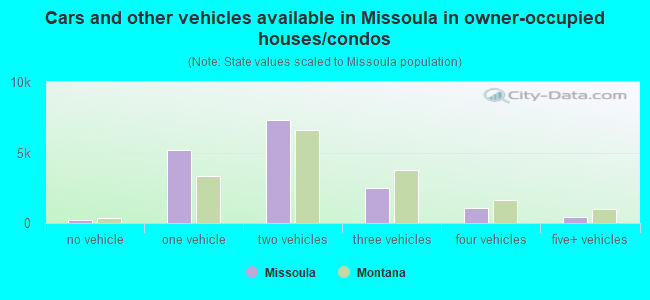
Median number of vehichles in owner occupied houses
Mean number of vehichles in owner occupied houses
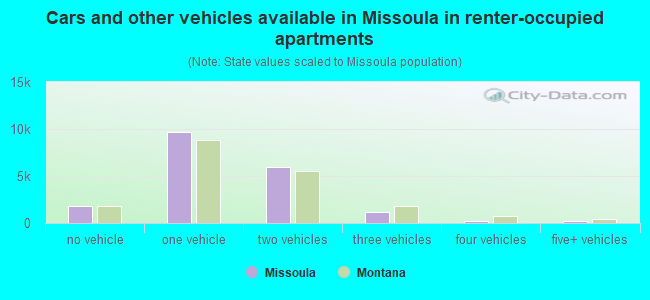
Median number of vehichles in renter occupied houses
Mean number of vehichles in renter occupied houses
Rooms in owner-occupied houses - 1 room (%)
Rooms in owner-occupied houses - 2 rooms (%)
Rooms in owner-occupied houses - 3 rooms (%)
Rooms in owner-occupied houses - 4 rooms (%)
Rooms in owner-occupied houses - 5 rooms (%)
Rooms in owner-occupied houses - 6 rooms (%)
Rooms in owner-occupied houses - 7 rooms (%)
Rooms in owner-occupied houses - 8 rooms (%)
Rooms in owner-occupied houses - 9+ rooms (%)
Rooms in renter-occupied houses - 1 room (%)
Rooms in renter-occupied houses - 2 rooms (%)
Rooms in renter-occupied houses - 3 rooms (%)
Rooms in renter-occupied houses - 4 rooms (%)
Rooms in renter-occupied houses - 5 rooms (%)
Rooms in renter-occupied houses - 6 rooms (%)
Rooms in renter-occupied houses - 7 rooms (%)
Rooms in renter-occupied houses - 8 rooms (%)
Rooms in renter-occupied houses - 9+ rooms (%)
Bedrooms in owner-occupied houses - no bedrooms (%)
Bedrooms in owner-occupied houses - 1 bedroom (%)
Bedrooms in owner-occupied houses - 2 bedrooms (%)
Bedrooms in owner-occupied houses - 3 bedrooms (%)
Bedrooms in owner-occupied houses - 4 bedrooms (%)
Bedrooms in owner-occupied houses - 5+ bedrooms (%)
Bedrooms in renter-occupied houses - no bedrooms (%)
Bedrooms in renter-occupied houses - 1 bedroom (%)
Bedrooms in renter-occupied houses - 2 bedrooms (%)
Bedrooms in renter-occupied houses - 3 bedrooms (%)
Bedrooms in renter-occupied houses - 4 bedrooms (%)
Bedrooms in renter-occupied houses - 5+ bedrooms (%)
Vehicles available in owner-occupied houses - no vehicle available (%)
Vehicles available in owner-occupied houses - 1 vehicle available(%)
Vehicles available in owner-occupied houses - 2 Vehicles available (%)
Vehicles available in owner-occupied houses - 3 Vehicles available (%)
Vehicles available in owner-occupied houses - 4 Vehicles available (%)
Vehicles available in owner-occupied houses - 5+ Vehicles available (%)
Vehicles available in renter-occupied houses - no vehicle available (%)
Vehicles available in renter-occupied houses - 1 vehicle available (%)
Vehicles available in renter-occupied houses - 2 Vehicles available (%)
Vehicles available in renter-occupied houses - 3 Vehicles available (%)
Vehicles available in renter-occupied houses - 4 Vehicles available (%)
Vehicles available in renter-occupied houses - 5+ Vehicles available (%)
Housing units in structures - 1, detached (%)
Housing units in structures - 1, attached (%)
Housing units in structures - 2 (%)
Housing units in structures - 3 or 4 (%)
Housing units in structures - 5 to 9 (%)
Housing units in structures - 10 to 19 (%)
Housing units in structures - 20 to 49 (%)
Housing units in structures - 50 or more (%)
Housing units in structures - Mobile home (%)
Housing units in structures - Boat, RV, van, etc. (%)
Housing units in structures - Owners - 1, detached (%)
Housing units in structures - Owners - 1, attached (%)
Housing units in structures - Owners - 2 (%)
Housing units in structures - Owners - 3 or 4 (%)
Housing units in structures - Owners - 5 to 9 (%)
Housing units in structures - Owners - 10 to 19 (%)
Housing units in structures - Owners - 20 to 49 (%)
Housing units in structures - Owners - 50 or more (%)
Housing units in structures - Owners - Mobile home (%)
Housing units in structures - Owners - Boat, RV, van, etc. (%)
Housing units in structures - Renters - 1, detached (%)
Housing units in structures - Renters - 1, attached (%)
Housing units in structures - Renters - 2 (%)
Housing units in structures - Renters - 3 or 4 (%)
Housing units in structures - Renters - 5 to 9 (%)
Housing units in structures - Renters - 10 to 19 (%)
Housing units in structures - Renters - 20 to 49 (%)
Housing units in structures - Renters - 50 or more (%)
Housing units in structures - Renters - Mobile home (%)
Housing units in structures - Renters - Boat, RV, van, etc. (%)
House/condo owner moved in on average (years ago)
Renter moved in on average (years ago)
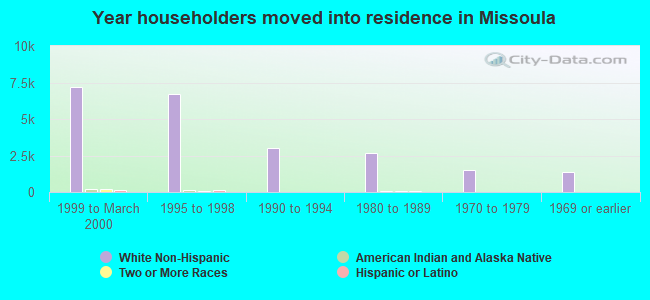
Year householder moved into unit - Moved in 1999 to March 2000 (%)
Year householder moved into unit - Moved in 1999 to March 2000 (%) - White
Year householder moved into unit - Moved in 1999 to March 2000 (%) - Black or African American
Year householder moved into unit - Moved in 1999 to March 2000 (%) - Asian
Year householder moved into unit - Moved in 1999 to March 2000 (%) - Hispanic or Latino
Year householder moved into unit - Moved in 1999 to March 2000 (%) - American Indian and Alaska Native
Year householder moved into unit - Moved in 1999 to March 2000 (%) - Multirace
Year householder moved into unit - Moved in 1999 to March 2000 (%) - Other Race
Year householder moved into unit - Moved in 1995 to 1998 (%)
Year householder moved into unit - Moved in 1995 to 1998 (%) - White
Year householder moved into unit - Moved in 1995 to 1998 (%) - Black or African American
Year householder moved into unit - Moved in 1995 to 1998 (%) - Asian
Year householder moved into unit - Moved in 1995 to 1998 (%) - Hispanic or Latino
Year householder moved into unit - Moved in 1995 to 1998 (%) - American Indian and Alaska Native
Year householder moved into unit - Moved in 1995 to 1998 (%) - Multirace
Year householder moved into unit - Moved in 1995 to 1998 (%) - Other Race
Year householder moved into unit - Moved in 1990 to 1994 (%)
Year householder moved into unit - Moved in 1990 to 1994 (%) - White
Year householder moved into unit - Moved in 1990 to 1994 (%) - Black or African American
Year householder moved into unit - Moved in 1990 to 1994 (%) - Asian
Year householder moved into unit - Moved in 1990 to 1994 (%) - Hispanic or Latino
Year householder moved into unit - Moved in 1990 to 1994 (%) - American Indian and Alaska Native
Year householder moved into unit - Moved in 1990 to 1994 (%) - Multirace
Year householder moved into unit - Moved in 1990 to 1994 (%) - Other Race
Year householder moved into unit - Moved in 1980 to 1989 (%)
Year householder moved into unit - Moved in 1980 to 1989 (%) - White
Year householder moved into unit - Moved in 1980 to 1989 (%) - Black or African American
Year householder moved into unit - Moved in 1980 to 1989 (%) - Asian
Year householder moved into unit - Moved in 1980 to 1989 (%) - Hispanic or Latino
Year householder moved into unit - Moved in 1980 to 1989 (%) - American Indian and Alaska Native
Year householder moved into unit - Moved in 1980 to 1989 (%) - Multirace
Year householder moved into unit - Moved in 1980 to 1989 (%) - Other Race
Year householder moved into unit - Moved in 1970 to 1979 (%)
Year householder moved into unit - Moved in 1970 to 1979 (%) - White
Year householder moved into unit - Moved in 1970 to 1979 (%) - Black or African American
Year householder moved into unit - Moved in 1970 to 1979 (%) - Asian
Year householder moved into unit - Moved in 1970 to 1979 (%) - Hispanic or Latino
Year householder moved into unit - Moved in 1970 to 1979 (%) - American Indian and Alaska Native
Year householder moved into unit - Moved in 1970 to 1979 (%) - Multirace
Year householder moved into unit - Moved in 1970 to 1979 (%) - Other Race
Year householder moved into unit - Moved in 1969 or earlier (%)
Year householder moved into unit - Moved in 1969 or earlier (%) - White
Year householder moved into unit - Moved in 1969 or earlier (%) - Black or African American
Year householder moved into unit - Moved in 1969 or earlier (%) - Asian
Year householder moved into unit - Moved in 1969 or earlier (%) - Hispanic or Latino
Year householder moved into unit - Moved in 1969 or earlier (%) - American Indian and Alaska Native
Year householder moved into unit - Moved in 1969 or earlier (%) - Multirace
Year householder moved into unit - Moved in 1969 or earlier (%) - Other Race
Housing units lacking complete plumbing facilities (%)
Housing units lacking complete kitchen facilities (%)
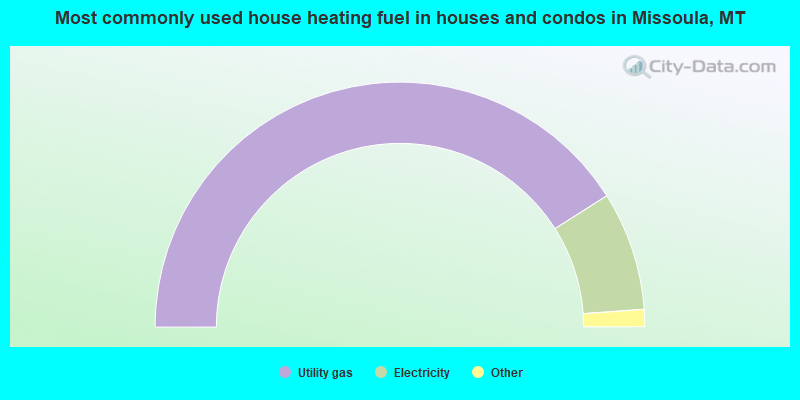
House heating fuel used in houses and condos - Utility gas (%)
House heating fuel used in houses and condos - Bottled, tank, or LP gas (%)
House heating fuel used in houses and condos - Electricity (%)
House heating fuel used in houses and condos - Fuel oil, kerosene, etc. (%)
House heating fuel used in houses and condos - Coal or coke (%)
House heating fuel used in houses and condos - Wood (%)
House heating fuel used in houses and condos - Solar energy (%)
House heating fuel used in houses and condos - Other fuel (%)
House heating fuel used in houses and condos - No fuel used (%)
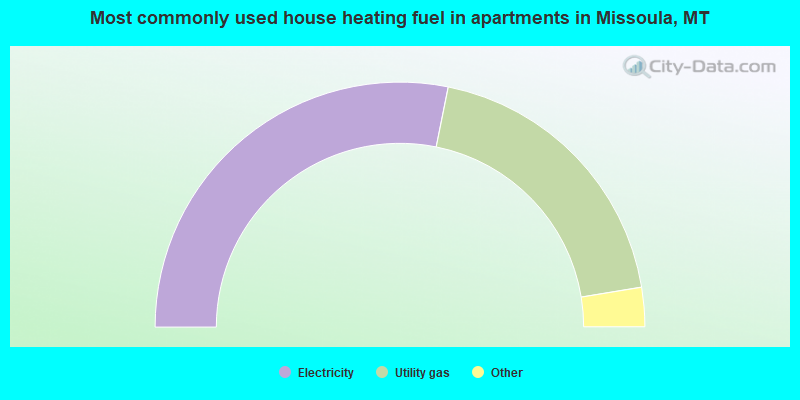
House heating fuel used in apartments - Utility gas (%)
House heating fuel used in apartments - Bottled, tank, or LP gas (%)
House heating fuel used in apartments - Electricity (%)
House heating fuel used in apartments - Fuel oil, kerosene, etc. (%)
House heating fuel used in apartments - Coal or coke (%)
House heating fuel used in apartments - Wood (%)
House heating fuel used in apartments - Solar energy (%)
House heating fuel used in apartments - Other fuel (%)
House heating fuel used in apartments - No fuel used (%)
Latest news about housing in Missoula, MT collected exclusively by city-data.com from local newspapers, TV, and radio stations
Median year house/condo built: 1981Median year apartment built: 1986Household type by relationship:
Households: 76,960
Male householders: 16,844 (7,311 living alone ), Female householders: 18,996 (7,456 living alone )11,546 spouses (11,546 opposite-sex spouses ), 4,441 unmarried partners , (4,184 opposite-sex unmarried partners ), 15,124 children (14,165 natural , 185 adopted , 774 stepchildren ), 449 grandchildren , 603 brothers or sisters , 185 parents , 0 foster children , 1,388 other relatives , 4,465 non-relatives In group quarters: 2,919
Size of family households: 7,233 2-persons , 4,207 3-persons , 3,554 4-persons , 437 5-persons , 103 6-persons , 255 7-or-more-persons .
Size of nonfamily households: 14,767 1-person , 4,242 2-persons , 707 3-persons , 207 4-persons , 128 5-persons .
7,879 married couples with children. single-parent households (1,589 men , 1,691 women ).
93.8% of residents of Missoula speak English at home. of residents speak Spanish at home (86% speak English very well , 11% speak English well , 3% speak English not well ).of residents speak other Indo-European language at home (62% speak English very well , 35% speak English well , 3% speak English not well ).of residents speak Asian or Pacific Island language at home (37% speak English very well , 21% speak English well , 39% speak English not well , 2% don't speak English at all ).of residents speak other language at home (99% speak English very well , 1% speak English well ).
Foreign born population: 2,423 (3.1%)of them are naturalized citizens )
Median number of rooms in houses and condos:
Median number of rooms in apartments
Owner-occupied Renter-occupied
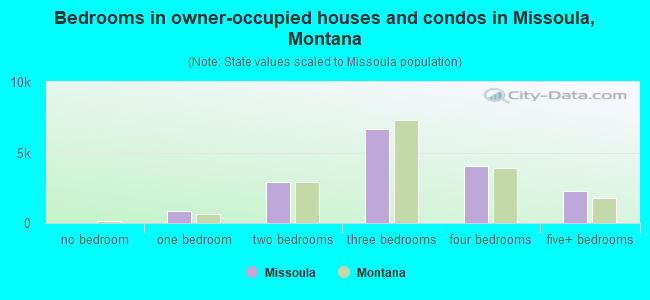
Bedrooms in owner-occupied houses and condos in Missoula, Montana
0 no bedroom 829 1 bedroom 2,924 2 bedrooms 6,687 3 bedrooms 4,010 4 bedrooms 2,238 5+ bedrooms
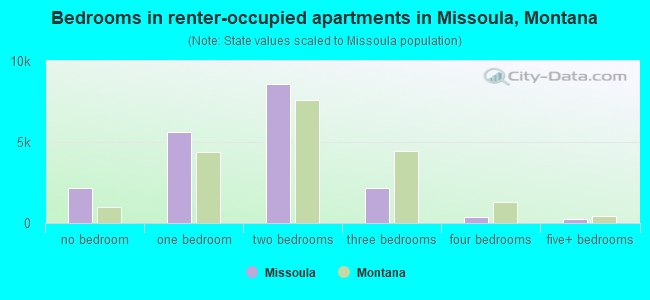
Bedrooms in renter-occupied apartments in Missoula, Montana
2,154 no bedroom 5,597 1 bedroom 8,591 2 bedrooms 2,165 3 bedrooms 388 4 bedrooms 257 5+ bedrooms
Owner-occupied Renter-occupied
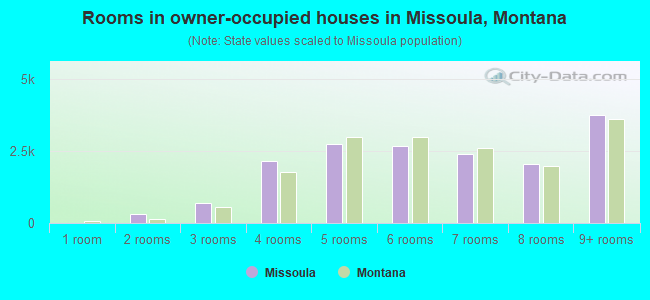
Rooms in owner-occupied houses in Missoula, Montana
0 1 room 297 2 rooms 690 3 rooms 2,156 4 rooms 2,723 5 rooms 2,661 6 rooms 2,390 7 rooms 2,028 8 rooms 3,743 9+ rooms
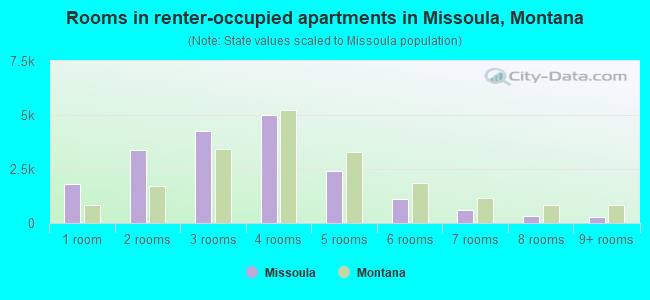
Rooms in renter-occupied apartments in Missoula, Montana
1,799 1 room 3,357 2 rooms 4,237 3 rooms 5,010 4 rooms 2,409 5 rooms 1,112 6 rooms 625 7 rooms 319 8 rooms 284 9+ rooms
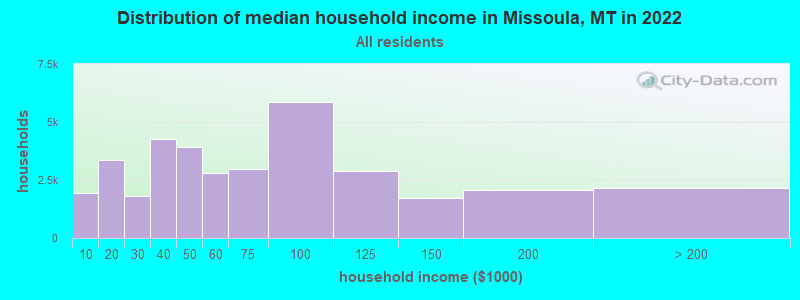
Missoula, MT household income distribution 1,948 Less than $10,0003,377 $10,000 to $19,9991,806 $20,000 to $29,9994,286 $30,000 to $39,9993,942 $40,000 to $49,9992,786 $50,000 to $59,9992,972 $60,000 to $74,9995,856 $75,000 to $99,9992,906 $100,000 to $124,9991,735 $125,000 to $149,9992,056 $150,000 to $199,9992,170 $200,000 or more
Home value of owner - occupied houses in 2022 in Missoula, MT 465 Less than $10,00037 $10,000 to $14,99925 $15,000 to $19,99912 $20,000 to $24,99915 $25,000 to $29,99922 $30,000 to $34,999124 $35,000 to $39,99989 $40,000 to $49,99928 $50,000 to $59,99944 $60,000 to $69,99996 $70,000 to $79,99918 $80,000 to $89,99953 $90,000 to $99,99951 $100,000 to $124,99964 $125,000 to $149,999339 $150,000 to $174,99975 $175,000 to $199,999761 $200,000 to $249,9991,241 $250,000 to $299,9993,217 $300,000 to $399,9992,984 $400,000 to $499,9994,350 $500,000 to $749,9991,658 $750,000 to $999,999595 $1,000,000 to $1,499,99988 $1,500,000 to $1,999,99982 $2,000,000 or moreRent paid by renters in 2022 in Missoula, MT 52 $100 to $149238 $150 to $199154 $250 to $299146 $300 to $349287 $350 to $399672 $400 to $449571 $450 to $499206 $500 to $549646 $550 to $599430 $600 to $649967 $650 to $699384 $700 to $7491,124 $750 to $7992,172 $800 to $8991,912 $900 to $9994,497 $1,000 to $1,2492,164 $1,250 to $1,4991,614 $1,500 to $1,999373 $2,000 to $2,49969 $3,000 to $3,499474 No cash rent
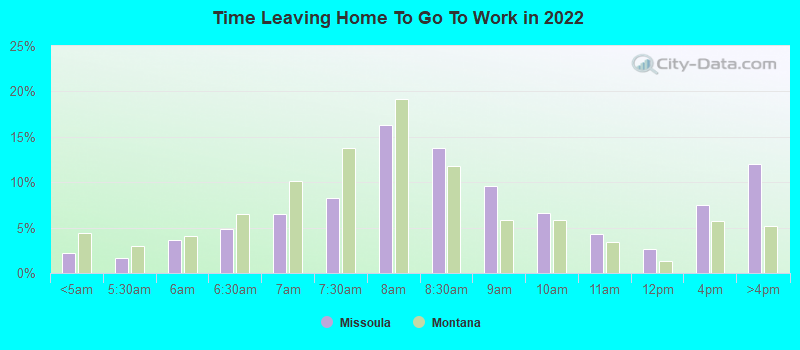
Percentage of workers working in this county: 94.7%Number of people working at home: 5,720 (12.2% of all workers )
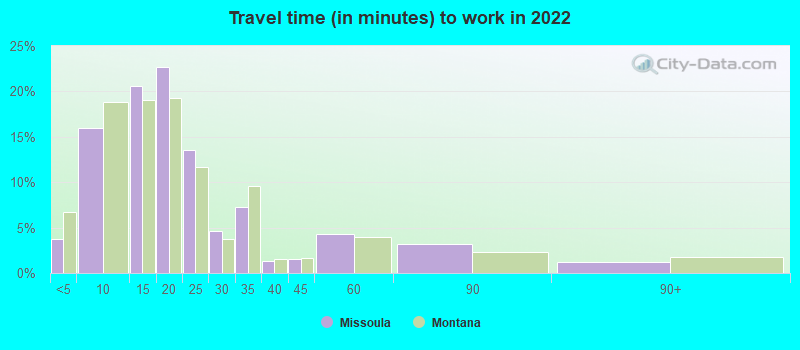
Travel time to work (commute)
Less than 5 minutes: 1,8525 to 9 minutes: 7,96410 to 14 minutes: 11,11015 to 19 minutes: 9,70320 to 24 minutes: 5,18125 to 29 minutes: 1,35330 to 34 minutes: 1,50335 to 39 minutes: 17040 to 44 minutes: 45345 to 59 minutes: 83260 to 89 minutes: 72390 or more minutes: 419
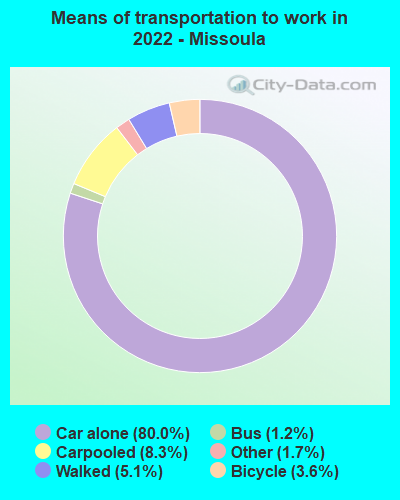
Means of transportation to work:
Drove a car alone: 42,312 (72.2%)Carpooled: 4,416 (7.5%)Bus : 659 (1.1%)Taxi: 917 (1.6%)Bicycle: 1,896 (3.2%)Walked: 2,695 (4.6%)Worked at home: 5,720 (9.8%)
Unemployment by race in 2022
Unemployment rate for White non-Hispanic residents 3.0% Males2.5% FemalesUnemployment rate for Black residents 2.8% FemalesUnemployment rate for American Indian and Alaska Native residents 2.3% Males1.4% FemalesUnemployment rate for other race residents 2.1% Males6.7% FemalesUnemployment rate for two or more race residents 6.4% Males5.1% FemalesUnemployment rate for Hispanic or Latino residents 2.4% Males3.2% Females
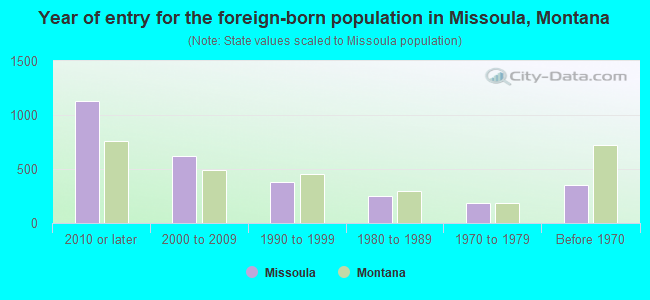
Year of entry for the foreign-born population in Missoula, Montana
1,130 2010 or later 616 2000 to 2009 376 1990 to 1999 249 1980 to 1989 185 1970 to 1979 352 Before 1970
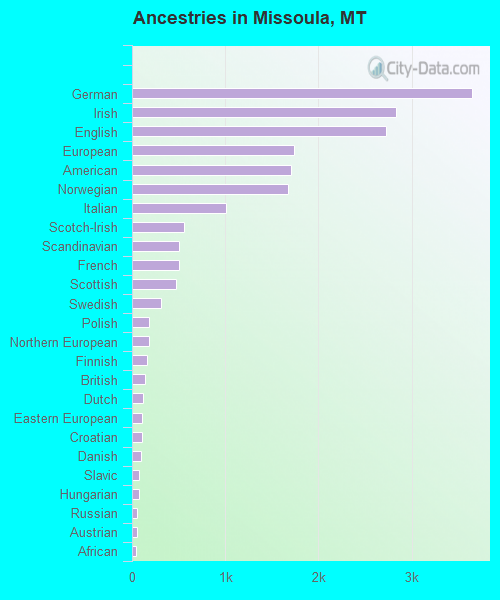
First ancestries reported:
German: 3,647 (15.0%)
Irish: 2,830 (11.6%)
English: 2,723 (11.2%)
European: 1,740 (7.1%)
American: 1,710 (7.0%)
Norwegian: 1,678 (6.9%)
Italian: 1,010 (4.1%)
Scotch-Irish: 563 (2.3%)
Scandinavian: 507 (2.1%)
French: 505 (2.1%)
Scottish: 472 (1.9%)
Swedish: 307 (1.3%)
Polish: 177 (0.7%)
Northern European: 177 (0.7%)
Finnish: 156 (0.6%)
British: 139 (0.6%)
Dutch: 117 (0.5%)
Eastern European: 109 (0.4%)
Croatian: 106 (0.4%)
Danish: 101 (0.4%)
Slavic: 80 (0.3%)
Hungarian: 75 (0.3%)
Russian: 56 (0.2%)
Austrian: 52 (0.2%)
African: 46 (0.2%)
Czech: 43 (0.2%)
French Canadian: 43 (0.2%)
Lebanese: 42 (0.2%)
Serbian: 37 (0.2%)
Swiss: 33 (0.1%)
Romanian: 31 (0.1%)
Basque: 24 (0.10%)
Ukrainian: 24 (0.10%)
Welsh: 22 (0.09%)
Czechoslovakian: 20 (0.08%)
Slovak: 19 (0.08%)
Icelander: 18 (0.07%)
Greek: 17 (0.07%)
Portuguese: 17 (0.07%)
Haitian: 17 (0.07%)
Cajun: 13 (0.05%)
South African: 7 (0.03%)
Iranian: 6 (0.02%)
New Zealander: 5 (0.02%)
Pennsylvania German: 4 (0.02%)
Ethiopian: 3 (0.01%)
Most common places of birth for foreign-born residents (%): Germany Missoula:
18.6% (520)Montana:
9.3% (2,310)
China, excluding Hong Kong and Taiwan Missoula:
11.9% (331)Montana:
4.8% (1,184)
Philippines Missoula:
10.3% (288)Montana:
7.0% (1,735)
Canada Missoula:
7.5% (208)Montana:
14.2% (3,503)
Mexico Missoula:
5.6% (157)Montana:
10.6% (2,608)
Brazil Missoula:
5.3% (147)Montana:
1.1% (268)
United Kingdom, excluding England and Scotland Missoula:
4.8% (135)Montana:
3.0% (738)
Korea Missoula:
4.7% (132)Montana:
2.7% (666)
Belarus Missoula:
2.5% (70)Montana:
1.1% (276)
Hong Kong Missoula:
2.2% (61)Montana:
1.0% (244)
Other South Central Asia Missoula:
2.0% (56)Montana:
0.3% (84)
Vietnam Missoula:
1.7% (48)Montana:
2.3% (578)
Sri Lanka Missoula:
1.6% (45)Montana:
0.7% (182)
Netherlands Missoula:
1.5% (43)Montana:
1.5% (368)
Place of birth for U.S.-born residents:
This state: 33,594Other state: 39,953Northeast: 4,301Midwest: 9,781South: 5,114West: 20,757 81.2% of Missoula residents lived in the same house 1 years ago.
Out of people who lived in different houses, 37.5% lived in this county.
Out of people who lived in different counties, 31.5% lived in Montana.
Missoula:
81.2%State average:
86.7%
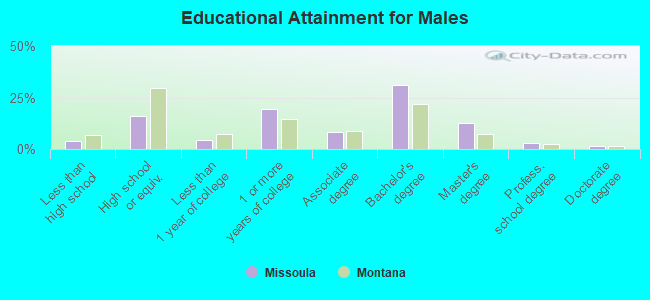
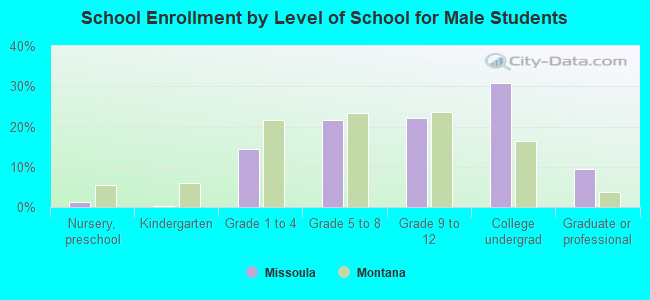
Education attainment for males 25 years and older:
No schooling: 0Nursery to 4th grade: 05th and 6th grade: 327th and 8th grade: 09th grade: 18810th grade: 39211th grade: 7612th grade, no diploma: 308High school graduate (or equivalency): 4,241Less than 1 year of college: 1,145Some college more than 1 year, no degree: 5,043Associate degree: 2,109Bachelor's degree: 8,116Master's degree: 3,307Professional school degree: 753Doctorate degree: 421
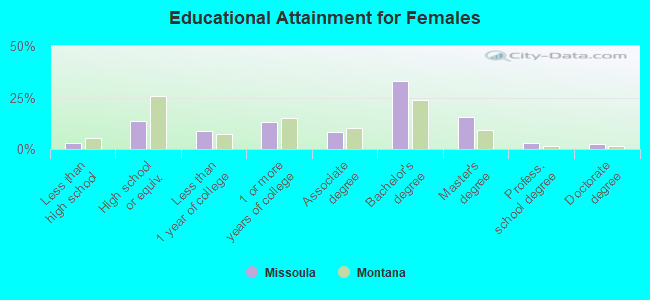
Education attainment for females 25 years and older:
No schooling: 84Nursery to 4th grade: 05th and 6th grade: 07th and 8th grade: 2219th grade: 010th grade: 011th grade: 5212th grade, no diploma: 393High school graduate (or equivalency): 3,512Less than 1 year of college: 2,213Some college more than 1 year, no degree: 3,388Associate degree: 2,109Bachelor's degree: 8,377Master's degree: 3,919Professional school degree: 703Doctorate degree: 578
Housing units in structures:
One, detached: 16,837One, attached: 2,004Two: 2,0673 or 4: 4,1555 to 9: 2,66310 to 19: 2,63220 to 49: 2,65250 or more: 2,992Mobile homes: 1,626Median worth of mobile homes: $9,999
Housing units lacking complete plumbing facilities in 2022: 0.3%Housing units lacking complete kitchen facilities in 2022: 2.1%House/condo owner moved in on average 8 years ago
Renter moved in on average 2 years ago
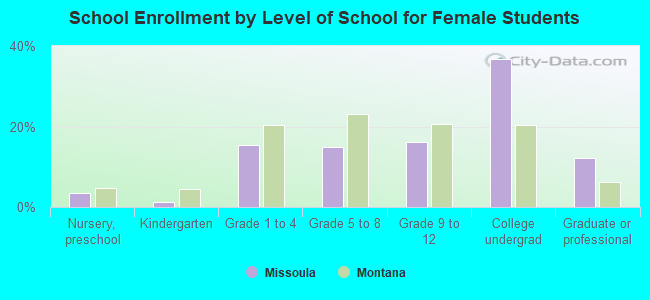
Private vs. public school enrollment:
Students in private schools in grades 1 to 8 (elementary and middle school): 727 Students in private schools in grades 9 to 12 (high school): 166 Students in private undergraduate colleges: 386