Montgomery, MA (Massachusetts) Houses and Residents
| Montgomery: | $399,704 |
| Massachusetts: | $534,700 |
Total population: 838 (Urban population: 0, Rural population: 656 (13 farm, 643 nonfarm))
Houses: 258 (258 occupied: 248 owner occupied, 10 renter occupied)
| % of renters here: | 4% |
| State: | 38% |
Housing density: 17 houses/condos per square mile
Median price asked for vacant for-sale houses and condos in 2022 in this county: $294,896.
Median contract rent in 2022: $868 (lower quartile is $414, upper quartile is over $2,000)
Median gross rent in Montgomery, MA in 2022: $993
Housing units in Montgomery with a mortgage: 150 (10 second mortgage, 14 home equity loan, 0 both second mortgage and home equity loan)
Houses without a mortgage: 37
Compare current foreclosures near Montgomery, MA:
| Photo | Address | Area | Beds / Baths | Price | Details |
|---|---|---|---|---|---|

|
#1
Cold Spring Rd
Southampton, MA 01073
|
2,736 sq. feet
|
1 baths 3 beds |
$284,900
|
show details |

|
#2
Walnut Street
Springfield, MA 01105
|
2,850 sq. feet
|
2 baths 6 beds |
$110,000
|
show details |

|
#3
Daytona St
Springfield, MA 01108
|
1,825 sq. feet
|
2 baths 6 beds |
$166,400
|
show details |

|
#4
W Franklin St
Holyoke, MA 01040
|
1,558 sq. feet
|
1 baths 2 beds |
$234,900
|
show details |

|
#5
Newman St
Springfield, MA 01105
|
1,676 sq. feet
|
2 baths 3 beds |
$45,900
|
show details |

|
#6
Brush Hill Ave
West Springfield, MA 01089
|
1,040 sq. feet
|
1 baths 3 beds |
show details | |

|
#7
Chipman Rd
Middlefield, MA 01243
|
1,486 sq. feet
|
2 baths 2 beds |
show details | |

|
#8
Deer Run Rd
Agawam, MA 01001
|
1,189 sq. feet
|
2 baths 3 beds |
show details | |

|
#9
Stuart St
Springfield, MA 01119
|
864 sq. feet
|
1 baths 3 beds |
show details | |

|
#10
Worthy Ave
West Springfield, MA 01089
|
1,501 sq. feet
|
1 baths 3 beds |
show details |
| Photo | Address | Area | Beds / Baths | Price | Details |
|---|---|---|---|---|---|

|
#11
Fountain St
Springfield, MA 01108
|
1,540 sq. feet
|
1 baths 3 beds |
show details | |

|
#12
Fieldston St
Springfield, MA 01119
|
848 sq. feet
|
1 baths 1 beds |
show details | |

|
#13
Newbury St
Springfield, MA 01104
|
1,504 sq. feet
|
1 baths 3 beds |
show details | |

|
#14
Phoenix Ter
Springfield, MA 01104
|
1,067 sq. feet
|
1 baths 3 beds |
show details | |

|
#15
Pleasant St
Holyoke, MA 01040
|
4,057 sq. feet
|
3 baths 6 beds |
show details | |

|
#16
Fowler St
Westfield, MA 01085
|
1,546 sq. feet
|
2 baths 3 beds |
show details | |

|
#17
Arthur St
Springfield, MA 01104
|
823 sq. feet
|
1 baths 2 beds |
show details | |

|
#18
Catherine St
Chicopee, MA 01013
|
1,073 sq. feet
|
1 baths 2 beds |
show details | |

|
#19
Wilfred St
Chicopee, MA 01020
|
1,360 sq. feet
|
1 baths 4 beds |
show details | |

|
#20
Wendover Rd
Suffield, CT 06078
|
3,204 sq. feet
|
2 baths 4 beds |
show details |
| Photo | Address | Area | Beds / Baths | Price | Details |
|---|---|---|---|---|---|

|
#21
Derryfield Ave
Springfield, MA 01118
|
1,188 sq. feet
|
1 baths 3 beds |
show details | |

|
#22
Empire St
Chicopee, MA 01013
|
960 sq. feet
|
1 baths 3 beds |
show details | |

|
#23
Silver St
Agawam, MA 01001
|
1,262 sq. feet
|
1 baths 3 beds |
show details | |

|
#24
Notre Dame St
Springfield, MA 01104
|
1,310 sq. feet
|
2 baths 4 beds |
show details | |

|
#25
Westford Ave
Springfield, MA 01109
|
3,358 sq. feet
|
2 baths 6 beds |
show details | |

|
#26
Finch Rd
Springfield, MA 01119
|
864 sq. feet
|
1 baths 3 beds |
show details | |

|
#27
Ontario St
Springfield, MA 01104
|
1,405 sq. feet
|
1 baths 3 beds |
show details | |

|
#28
Montgomery St
Westfield, MA 01085
|
1,714 sq. feet
|
2 baths 4 beds |
show details | |

|
#29
Fairmount St
Springfield, MA 01108
|
1,620 sq. feet
|
1 baths 5 beds |
show details | |

|
#30
Washington St
Westfield, MA 01085
|
1,300 sq. feet
|
2 baths 3 beds |
show details |
| Photo | Address | Area | Beds / Baths | Price | Details |
|---|---|---|---|---|---|

|
#31
Johnson St
Springfield, MA 01108
|
2,432 sq. feet
|
2 baths 6 beds |
show details | |

|
#32
Dunn Rd
Longmeadow, MA 01106
|
2,400 sq. feet
|
3 baths 3 beds |
show details | |

|
#33
Newbury St
Springfield, MA 01104
|
1,308 sq. feet
|
1 baths 3 beds |
show details | |

|
#34
Royal St
Chicopee, MA 01020
|
3,296 sq. feet
|
4 baths 7 beds |
show details | |

|
#35
Russell Stage Rd
Blandford, MA 01008
|
1,650 sq. feet
|
2 baths 3 beds |
show details | |

|
#36
Elliot St
Chicopee, MA 01020
|
1,183 sq. feet
|
1 baths 2 beds |
show details | |

|
#37
Mill St
Feeding Hills, MA 01030
|
1,139 sq. feet
|
1 baths 2 beds |
show details | |

|
#38
Sheridan St
Chicopee, MA 01020
|
1,966 sq. feet
|
2 baths 3 beds |
show details | |

|
#39
Arthur St
Springfield, MA 01104
|
823 sq. feet
|
1 baths 3 beds |
show details | |

|
#40
Parallel St
Springfield, MA 01104
|
1,437 sq. feet
|
1 baths 4 beds |
show details |
| Photo | Address | Area | Beds / Baths | Price | Details |
|---|---|---|---|---|---|

|
#41
Mayflower Rd
Springfield, MA 01118
|
720 sq. feet
|
1 baths 2 beds |
show details | |

|
#42
Davis St
Springfield, MA 01104
|
998 sq. feet
|
1 baths 2 beds |
show details | |

|
#43
Strong St
Springfield, MA 01104
|
1,250 sq. feet
|
1 baths 3 beds |
show details | |

|
#44
Roosevelt Ave
Springfield, MA 01118
|
1,603 sq. feet
|
1 baths 3 beds |
show details | |

|
#45
Hampden St
Indian Orchard, MA 01151
|
1,446 sq. feet
|
1 baths 4 beds |
show details | |

|
#46
Montclair St
Springfield, MA 01104
|
1,604 sq. feet
|
1 baths 4 beds |
show details | |

|
#47
California Ave
Springfield, MA 01118
|
1,349 sq. feet
|
1 baths 3 beds |
show details | |

|
#48
Breezy Ln
Granby, MA 01033
|
918 sq. feet
|
2 baths 2 beds |
show details | |

|
#49
Woodside Dr
Agawam, MA 01001
|
1,580 sq. feet
|
2 baths 4 beds |
show details | |

|
Check over 1 million property listings on Foreclosure.com!
|
browse all offers | |||
Latest news about housing in Montgomery, MA collected exclusively by city-data.com from local newspapers, TV, and radio stations

 | How Much Massachusetts Households Make Per Year: Census Data (37 replies) |
| 2021 Real Estate Observations (1729 replies) |
| MA is Snobby (321 replies) |
| Oklahoma to (likely Western) Massachusetts - Beginning Research (274 replies) |
| Let’s Go Celtics! (88 replies) |
| MA ranked most prosperous state (123 replies) |

Household type by relationship:
Households: 448,699- In family households: 370,558 (69,901 male householders, 46,060 female householders)
75,335 spouses, 139,777 children (131,178 natural, 3,169 adopted, 5,430 stepchildren), 9,761 grandchildren, 4,611 brothers or sisters, 4,384 parents, foster children, 5,451 other relatives, 12,672 non-relatives
- In nonfamily households: 78,141 (28,658 male householders (22,507 living alone)), 35,308 female householders (30,105 living alone)), 14,175 nonrelatives
- In group quarters: 14,791 (5,845 institutionalized population)
67,791 married couples with children.
39,215 single-parent households (5,649 men, 33,566 women).
96.3% of residents of Montgomery speak English at home.
0.6% of residents speak Spanish at home (50% speak English very well, 50% speak English well).
2.7% of residents speak other Indo-European language at home (59% speak English very well, 41% speak English well).
0.3% of residents speak Asian or Pacific Island language at home (100% speak English very well).
Foreign born population: 19 (2.9%)
(94.7% of them are naturalized citizens)
| Here: | 6.1 |
| State: | 6.5 |
| Here: | 5.2 |
| State: | 4.0 |
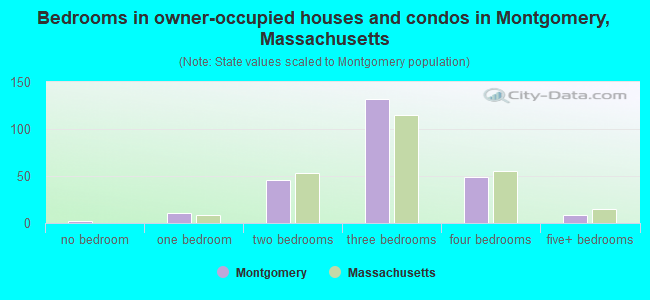
- Bedrooms in owner-occupied houses and condos in Montgomery, Massachusetts
- 2no bedroom
- 111 bedroom
- 462 bedrooms
- 1323 bedrooms
- 494 bedrooms
- 85+ bedrooms
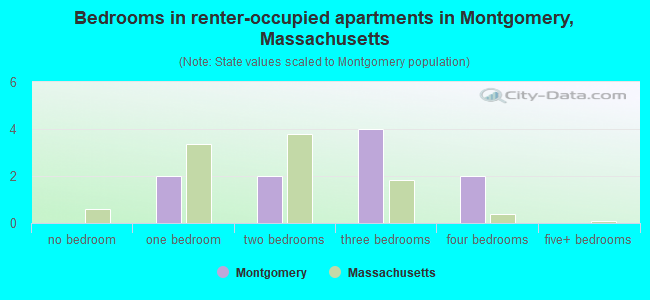
- Bedrooms in renter-occupied apartments in Montgomery, Massachusetts
- 0no bedroom
- 21 bedroom
- 22 bedrooms
- 43 bedrooms
- 24 bedrooms
- 05+ bedrooms
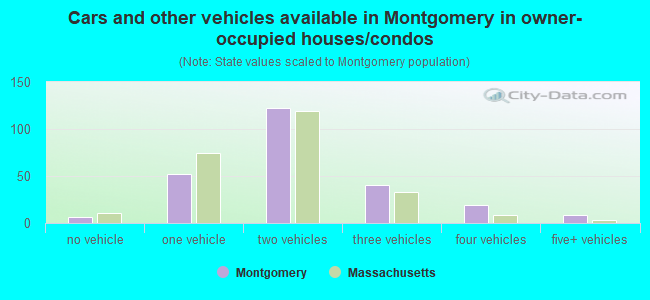
- Cars and other vehicles available in Montgomery in owner-occupied houses/condos
- 6no vehicle
- 521 vehicle
- 1222 vehicles
- 403 vehicles
- 194 vehicles
- 95+ vehicles
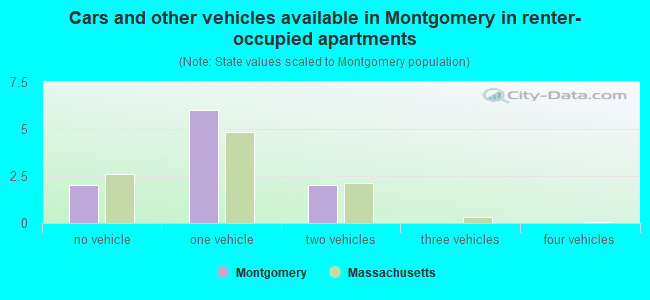
- Cars and other vehicles available in Montgomery in renter-occupied apartments
- 2no vehicle
- 61 vehicle
- 22 vehicles
- 03 vehicles
- 04 vehicles
- 05+ vehicles
- Rooms in owner-occupied houses in Montgomery, Massachusetts
- 21 room
- 52 rooms
- 43 rooms
- 74 rooms
- 435 rooms
- 776 rooms
- 507 rooms
- 318 rooms
- 299+ rooms
- Rooms in renter-occupied apartments in Montgomery, Massachusetts
- 01 room
- 02 rooms
- 03 rooms
- 44 rooms
- 25 rooms
- 06 rooms
- 07 rooms
- 28 rooms
- 29+ rooms
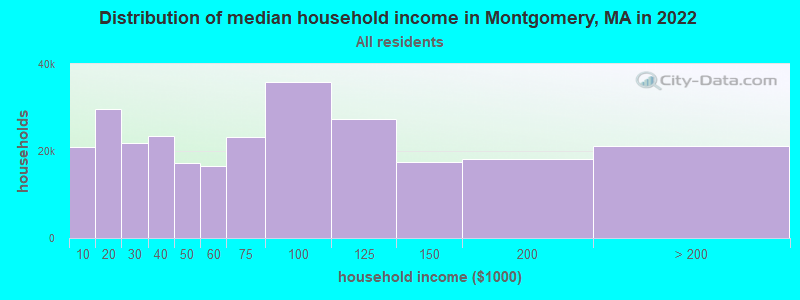
Montgomery, MA household income distribution

- 20,837Less than $10,000
- 29,633$10,000 to $19,999
- 21,921$20,000 to $29,999
- 23,520$30,000 to $39,999
- 17,234$40,000 to $49,999
- 16,493$50,000 to $59,999
- 23,234$60,000 to $74,999
- 35,777$75,000 to $99,999
- 27,323$100,000 to $124,999
- 17,546$125,000 to $149,999
- 18,050$150,000 to $199,999
- 21,220$200,000 or more
Percentage of workers working in this county: 80.5%
Number of people working at home: 36 (9.7% of all workers)
Travel time to work (commute)
- Less than 5 minutes: 5
- 5 to 9 minutes: 6
- 10 to 14 minutes: 21
- 15 to 19 minutes: 45
- 20 to 24 minutes: 73
- 25 to 29 minutes: 53
- 30 to 34 minutes: 71
- 35 to 39 minutes: 25
- 40 to 44 minutes: 10
- 45 to 59 minutes: 18
- 60 to 89 minutes: 11
- 90 or more minutes: 14
Means of transportation to work:
- Drove a car alone: 325 (90.0%)
- Carpooled: 22 (6.1%)
- Bus or trolley bus: 2 (0.6%)
- Other means: 3 (0.8%)
- Worked at home: 9 (2.5%)
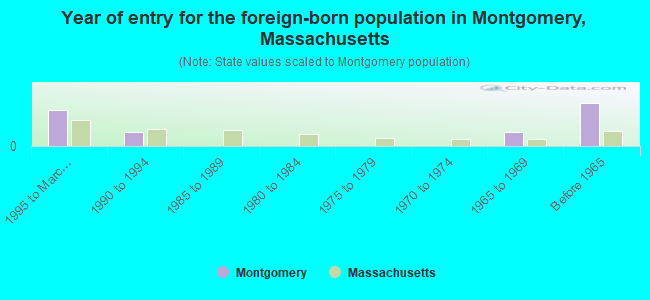
- Year of entry for the foreign-born population in Montgomery, Massachusetts
- 51995 to March 2000
- 21990 to 1994
- 01985 to 1989
- 01980 to 1984
- 01975 to 1979
- 01970 to 1974
- 21965 to 1969
- 6Before 1965
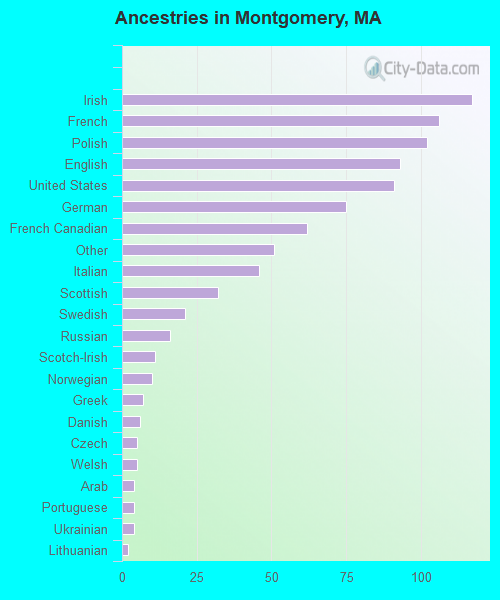
First ancestries reported:
- Irish: 117 (13.4%)
- French: 106 (12.2%)
- Polish: 102 (11.7%)
- English: 93 (10.7%)
- United States: 91 (10.5%)
- German: 75 (8.6%)
- French Canadian: 62 (7.1%)
- Other: 51 (5.9%)
- Italian: 46 (5.3%)
- Scottish: 32 (3.7%)
- Swedish: 21 (2.4%)
- Russian: 16 (1.8%)
- Scotch-Irish: 11 (1.3%)
- Norwegian: 10 (1.1%)
- Greek: 7 (0.8%)
- Danish: 6 (0.7%)
- Czech: 5 (0.6%)
- Welsh: 5 (0.6%)
- Arab: 4 (0.5%)
- Portuguese: 4 (0.5%)
- Ukrainian: 4 (0.5%)
- Lithuanian: 2 (0.2%)
Most common places of birth for foreign-born residents (%):
| Montgomery: | 20.0% (3) |
| Massachusetts: | 0.2% (1,700) |
| Montgomery: | 13.3% (2) |
| Massachusetts: | 0.4% (3,051) |
| Montgomery: | 13.3% (2) |
| Massachusetts: | 1.6% (12,350) |
| Montgomery: | 13.3% (2) |
| Massachusetts: | 1.7% (13,456) |
| Montgomery: | 13.3% (2) |
| Massachusetts: | 0.2% (1,855) |
| Montgomery: | 13.3% (2) |
| Massachusetts: | 0.2% (1,729) |
| Montgomery: | 13.3% (2) |
| Massachusetts: | 5.2% (40,247) |
Place of birth for U.S.-born residents:
- This state: 511
- Other state: 128
- Northeast: 98
- Midwest: 7
- South: 19
- West: 4
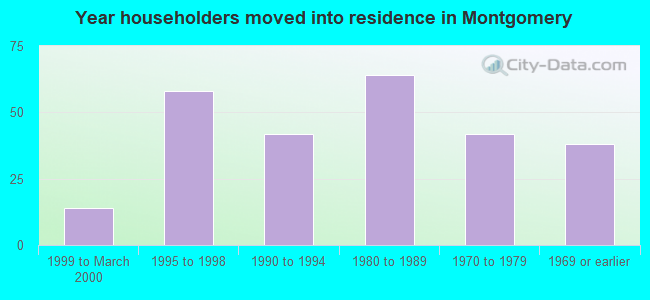
71% of Montgomery residents lived in the same house 5 years ago.
Out of people who lived in different houses, 81% lived in this county.
Out of people who lived in different counties, 35% lived in Massachusetts.
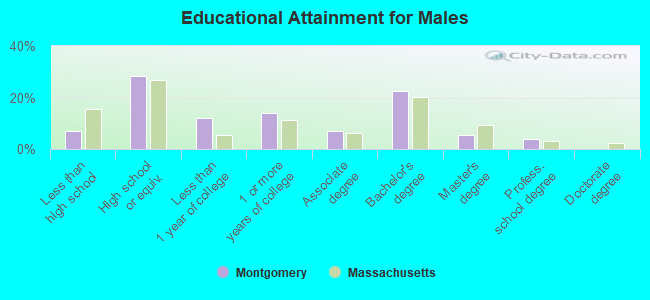
Education attainment for males 25 years and older:
- No schooling: 3
- Nursery to 4th grade: 0
- 5th and 6th grade: 0
- 7th and 8th grade: 2
- 9th grade: 7
- 10th grade: 0
- 11th grade: 2
- 12th grade, no diploma: 2
- High school graduate (or equivalency): 64
- Less than 1 year of college: 27
- Some college more than 1 year, no degree: 32
- Associate degree: 16
- Bachelor's degree: 51
- Master's degree: 12
- Professional school degree: 9
- Doctorate degree: 0
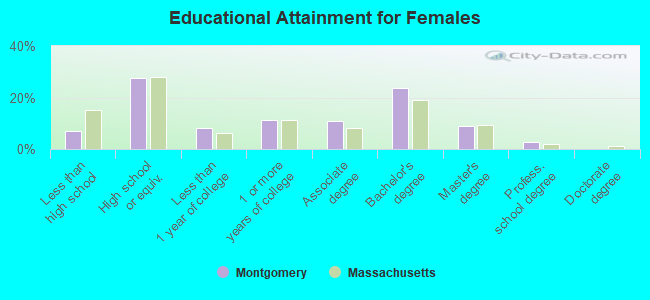
Education attainment for females 25 years and older:
- No schooling: 0
- Nursery to 4th grade: 0
- 5th and 6th grade: 0
- 7th and 8th grade: 2
- 9th grade: 0
- 10th grade: 6
- 11th grade: 6
- 12th grade, no diploma: 2
- High school graduate (or equivalency): 64
- Less than 1 year of college: 19
- Some college more than 1 year, no degree: 26
- Associate degree: 25
- Bachelor's degree: 55
- Master's degree: 21
- Professional school degree: 6
- Doctorate degree: 0
Housing units in structures:
- One, detached: 258
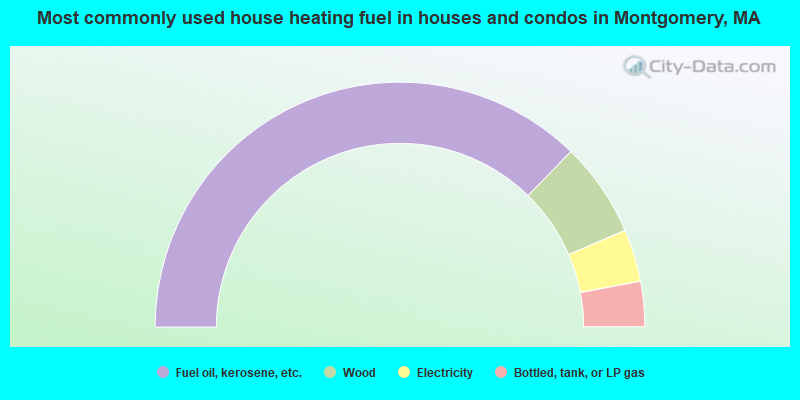
- 74.6%Fuel oil, kerosene, etc.
- 12.5%Wood
- 6.9%Electricity
- 6.0%Bottled, tank, or LP gas
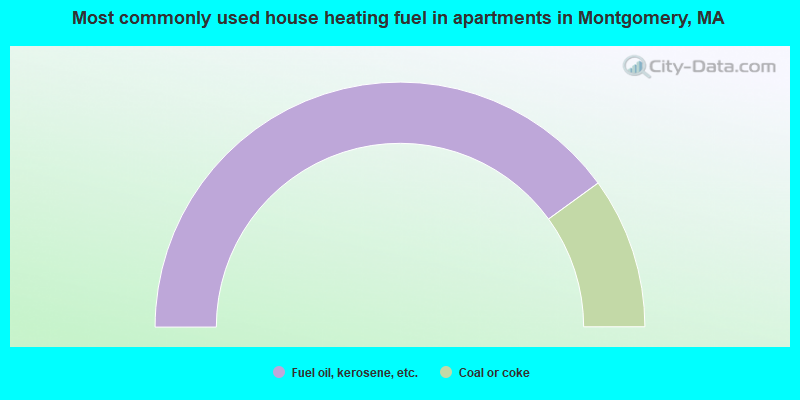
- 80.0%Fuel oil, kerosene, etc.
- 20.0%Coal or coke
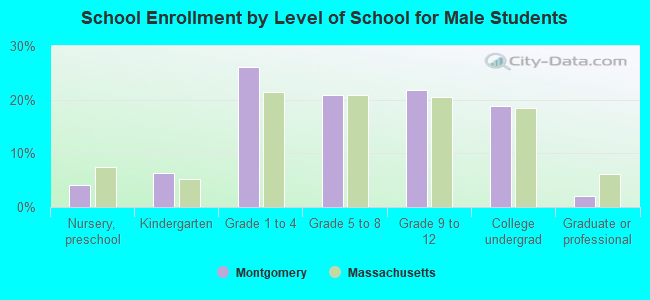
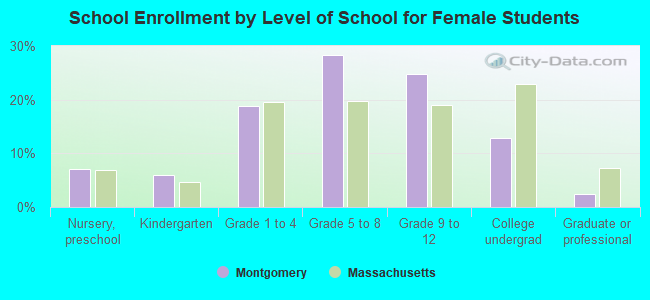
Private vs. public school enrollment:
| Here: | 2.4% |
| Massachusetts: | 10.8% |
| Here: | 4.8% |
| Massachusetts: | 12.2% |
| Here: | 41.4% |
| Massachusetts: | 48.2% |