Morehead City, NC (North Carolina) Houses and Residents
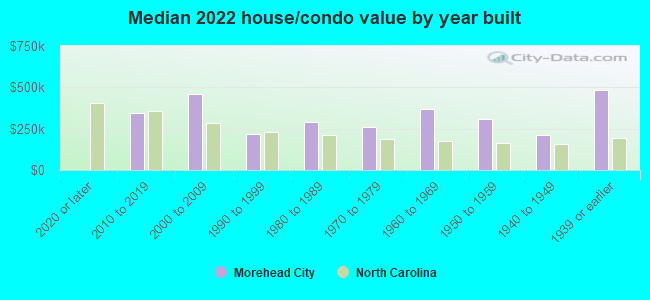
| Morehead City: | $352,326 |
| North Carolina: | $280,600 |
Mean price in 2022:
Detached houses: $409,999
Here: $409,999 State: $375,326 Townhouses or other attached units: $251,640
Here: $251,640 State: $317,935 In 3-to-4-unit structures: $136,529
Here: $136,529 State: $254,939 In 5-or-more-unit structures: $400,348
Here: $400,348 State: $329,290 Mobile homes: $21,037
Here: $21,037 State: $124,933
Total population: 9,258 (Urban population: 7,565 (all inside urban clusters), Rural population: 84 (all nonfarm))
Houses: 6,456 (5,067 occupied: 2,465 owner occupied, 2,639 renter occupied)
| % of renters here: | 52% |
| State: | 33% |
Housing density: 1,266 houses/condos per square mile
Median price asked for vacant for-sale houses and condos in 2022: $603,717.
Median contract rent in 2022: $887 (lower quartile is $673, upper quartile is $1,166)
Median rent asked for vacant for-rent units in 2022: $4,843
Median gross rent in Morehead City, NC in 2022: $1,060
Housing units in Morehead City with a mortgage: 1,377 (159 second mortgage, 12 home equity loan, 146 both second mortgage and home equity loan)
Houses without a mortgage: 134
Median household income for houses/condos with a mortgage: $110,253
Median household income for apartments without a mortgage: $63,984
Median monthly housing costs: $1,060
Compare current foreclosures near Morehead City, NC:
| Photo | Address | Area | Beds / Baths | Price | Details |
|---|---|---|---|---|---|

|
#1
Oak Dr
Morehead City, NC 28557
|
2,190 sq. feet
|
2 baths 3 beds |
show details | |

|
#2
N 35th St Apt 404
Morehead City, NC 28557
|
- sq. feet
|
- baths - beds |
show details | |

|
#3
Country Club Rd Unit C102
Morehead City, NC 28557
|
- sq. feet
|
- baths - beds |
show details | |

|
#4
Snowy Egret Dr
Morehead City, NC 28557
|
- sq. feet
|
- baths - beds |
show details | |

|
#5
Stratford Rd
Havelock, NC 28532
|
1,419 sq. feet
|
2 baths 4 beds |
show details | |

|
#6
Russells Creek Rd
Beaufort, NC 28516
|
1,458 sq. feet
|
2 baths 3 beds |
show details | |

|
#7
Pearson Cir
Newport, NC 28570
|
2,040 sq. feet
|
2 baths 3 beds |
show details | |

|
#8
Newport Loop Rd
Newport, NC 28570
|
2,024 sq. feet
|
2 baths 3 beds |
show details | |

|
#9
Sandy Ln
Havelock, NC 28532
|
1,404 sq. feet
|
1 baths 2 beds |
show details | |

|
#10
Duffy Rd
Beaufort, NC 28516
|
1,135 sq. feet
|
1 baths 3 beds |
show details |
| Photo | Address | Area | Beds / Baths | Price | Details |
|---|---|---|---|---|---|

|
#11
Secretariat Dr
Havelock, NC 28532
|
936 sq. feet
|
2 baths 3 beds |
show details | |

|
#12
Foxhunt Ln
Havelock, NC 28532
|
1,296 sq. feet
|
2 baths 3 beds |
show details | |

|
#13
Twin Wood Dr
Havelock, NC 28532
|
837 sq. feet
|
1 baths 2 beds |
show details | |

|
#14
Gooding Dr
Havelock, NC 28532
|
972 sq. feet
|
2 baths 2 beds |
show details | |

|
#15
John Ct
Havelock, NC 28532
|
1,092 sq. feet
|
2 baths 3 beds |
show details | |

|
#16
Emerald Dr
Emerald Isle, NC 28594
|
3,647 sq. feet
|
3 baths 3 beds |
show details | |

|
#17
Mill Creek Rd
Newport, NC 28570
|
1,662 sq. feet
|
2 baths 3 beds |
show details | |

|
#18
Mulberry St
Beaufort, NC 28516
|
1,952 sq. feet
|
1 baths 3 beds |
show details | |

|
#19
Shell Landing Rd
Beaufort, NC 28516
|
1,784 sq. feet
|
2 baths 3 beds |
show details | |

|
#20
Hatcher Dr
Newport, NC 28570
|
1,512 sq. feet
|
2 baths 3 beds |
show details |
| Photo | Address | Area | Beds / Baths | Price | Details |
|---|---|---|---|---|---|

|
#21
Green Cove Dr
Havelock, NC 28532
|
1,560 sq. feet
|
1 baths - beds |
show details | |

|
#22
Bogue Loop Rd
Newport, NC 28570
|
- sq. feet
|
2 baths 3 beds |
show details | |

|
#23
Colony St
Newport, NC 28570
|
- sq. feet
|
2 baths 3 beds |
show details | |

|
#24
Nc Highway 101
Havelock, NC 28532
|
1,250 sq. feet
|
1 baths - beds |
show details | |

|
#25
N Shore 1 Dr
Atlantic Beach, NC 28512
|
- sq. feet
|
- baths - beds |
show details | |

|
#26
E Fort Macon Rd
Atlantic Beach, NC 28512
|
- sq. feet
|
- baths - beds |
show details | |

|
#27
Broad St
Beaufort, NC 28516
|
- sq. feet
|
- baths - beds |
show details | |

|
#28
Gray Rd # 4
Havelock, NC 28532
|
- sq. feet
|
- baths - beds |
show details | |

|
#29
Thurman Rd
Beaufort, NC 28516
|
- sq. feet
|
- baths - beds |
show details | |

|
#30
Goose Creek Resort
Newport, NC 28570
|
- sq. feet
|
- baths - beds |
show details |
| Photo | Address | Area | Beds / Baths | Price | Details |
|---|---|---|---|---|---|

|
#31
Wildwood Rd Apt 113
Newport, NC 28570
|
- sq. feet
|
- baths - beds |
show details | |

|
#32
Cyrus Pollard Rd Lot 6
Newport, NC 28570
|
- sq. feet
|
- baths - beds |
show details | |

|
#33
Elizabeth St # A
Emerald Isle, NC 28594
|
- sq. feet
|
- baths - beds |
show details | |

|
#34
Issac Murray Dr
Beaufort, NC 28516
|
- sq. feet
|
- baths - beds |
show details | |

|
#35
Hayden Ct
Havelock, NC 28532
|
- sq. feet
|
- baths - beds |
show details | |

|
#36
Glenda Dr
Beaufort, NC 28516
|
- sq. feet
|
- baths - beds |
show details | |

|
#37
Eastern Ave
Beaufort, NC 28516
|
- sq. feet
|
- baths - beds |
show details | |

|
#38
Gull Ct
Beaufort, NC 28516
|
- sq. feet
|
- baths - beds |
show details | |

|
#39
Quinn Hill Rd
Newport, NC 28570
|
- sq. feet
|
- baths - beds |
show details | |

|
#40
Brook Ln
Newport, NC 28570
|
- sq. feet
|
- baths - beds |
show details |
| Photo | Address | Area | Beds / Baths | Price | Details |
|---|---|---|---|---|---|

|
#41
Hilltop Rd
Newport, NC 28570
|
- sq. feet
|
- baths - beds |
show details | |

|
#42
Kathryn Ct
Newport, NC 28570
|
- sq. feet
|
- baths - beds |
show details | |

|
#43
Chimney Branch Rd
Newport, NC 28570
|
- sq. feet
|
- baths - beds |
show details | |

|
Check over 1 million property listings on Foreclosure.com!
|
browse all offers | |||


 | Permanent Inexpensive Apartments - Ocracoke Island (6 replies) |
| Moving to Morehead - nice, affordable condos and townhomes? (7 replies) |
| Morehead City (10 replies) |
| Morehead city / Beaufort move without car? (17 replies) |
| Morehead City NC Schools (3 replies) |
| Cheap Monthly rentals in Atlantic beach/Morehead City? (2 replies) |
Median year apartment built: 1991
Household type by relationship:
Households: 9,776- Male householders: 2,140 (976 living alone), Female householders: 2,894 (1,255 living alone)
1,653 spouses (1,640 opposite-sex spouses), 306 unmarried partners, (306 opposite-sex unmarried partners), 2,018 children (1,772 natural, 207 adopted, 39 stepchildren), 72 grandchildren, 193 brothers or sisters, 93 parents, 0 foster children, 69 other relatives, 132 non-relatives
- In group quarters: 200
Size of family households: 1,347 2-persons, 499 3-persons, 294 4-persons, 59 5-persons, 36 6-persons, 7 7-or-more-persons.
Size of nonfamily households: 2,400 1-person, 363 2-persons, 14 3-persons.
1,131 married couples with children.
439 single-parent households (20 men, 419 women).
92.4% of residents of Morehead City speak English at home.
4.8% of residents speak Spanish at home (83% speak English very well, 16% speak English well, 1% speak English not well).
2.8% of residents speak other Indo-European language at home (88% speak English very well, 7% speak English well, 2% speak English not well, 3% don't speak English at all).
0.2% of residents speak Asian or Pacific Island language at home (100% speak English very well).
Foreign born population: 337 (3.4%)
(34.7% of them are naturalized citizens)
| Here: | 6.3 |
| State: | 6.4 |
| Here: | 4.4 |
| State: | 4.4 |
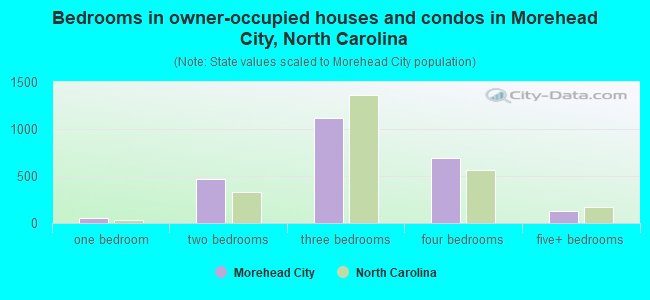
- Bedrooms in owner-occupied houses and condos in Morehead City, North Carolina
- 7no bedroom
- 481 bedroom
- 4692 bedrooms
- 1,1223 bedrooms
- 6904 bedrooms
- 1295+ bedrooms
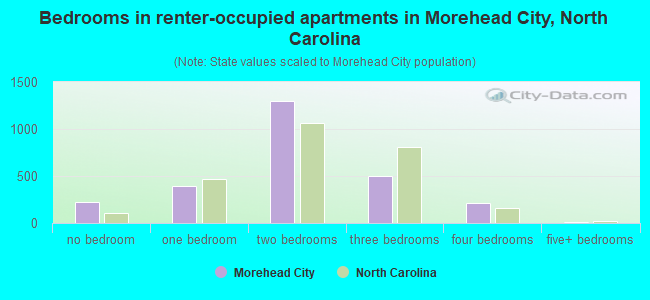
- Bedrooms in renter-occupied apartments in Morehead City, North Carolina
- 223no bedroom
- 3931 bedroom
- 1,3002 bedrooms
- 5023 bedrooms
- 2144 bedrooms
- 75+ bedrooms
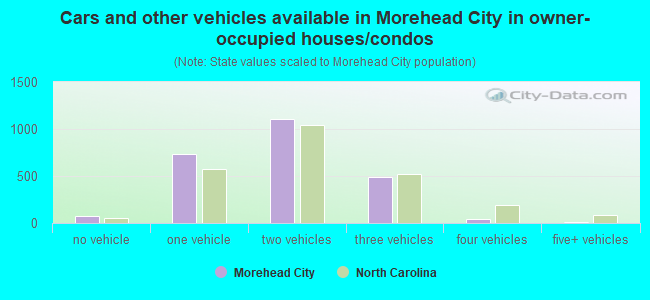
- Cars and other vehicles available in Morehead City in owner-occupied houses/condos
- 70no vehicle
- 7381 vehicle
- 1,1112 vehicles
- 4863 vehicles
- 454 vehicles
- 155+ vehicles
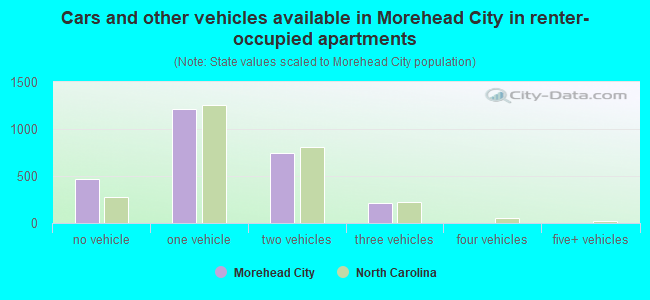
- Cars and other vehicles available in Morehead City in renter-occupied apartments
- 468no vehicle
- 1,2131 vehicle
- 7482 vehicles
- 2103 vehicles
- 04 vehicles
- 05+ vehicles
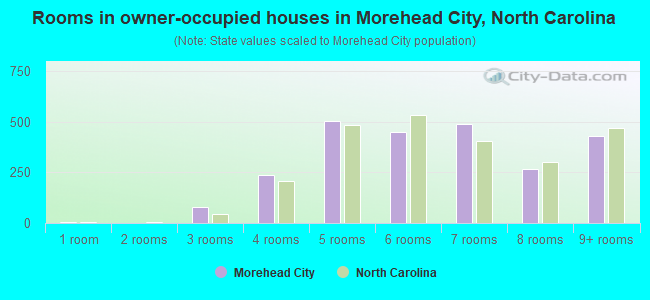
- Rooms in owner-occupied houses in Morehead City, North Carolina
- 71 room
- 02 rooms
- 813 rooms
- 2374 rooms
- 5035 rooms
- 4516 rooms
- 4917 rooms
- 2688 rooms
- 4289+ rooms
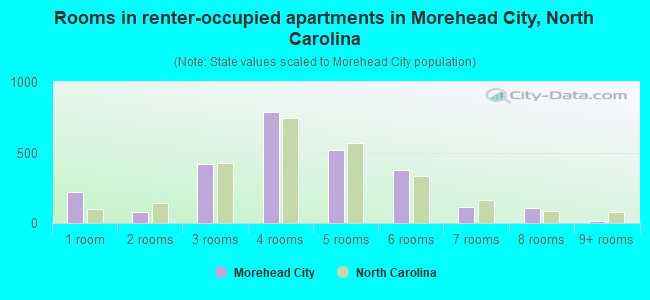
- Rooms in renter-occupied apartments in Morehead City, North Carolina
- 2231 room
- 802 rooms
- 4183 rooms
- 7904 rooms
- 5175 rooms
- 3796 rooms
- 1137 rooms
- 1038 rooms
- 169+ rooms
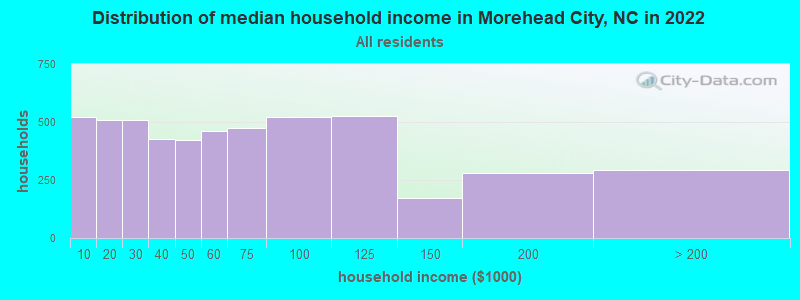
Morehead City, NC household income distribution

- 521Less than $10,000
- 507$10,000 to $19,999
- 508$20,000 to $29,999
- 428$30,000 to $39,999
- 421$40,000 to $49,999
- 463$50,000 to $59,999
- 475$60,000 to $74,999
- 522$75,000 to $99,999
- 528$100,000 to $124,999
- 171$125,000 to $149,999
- 280$150,000 to $199,999
- 295$200,000 or more
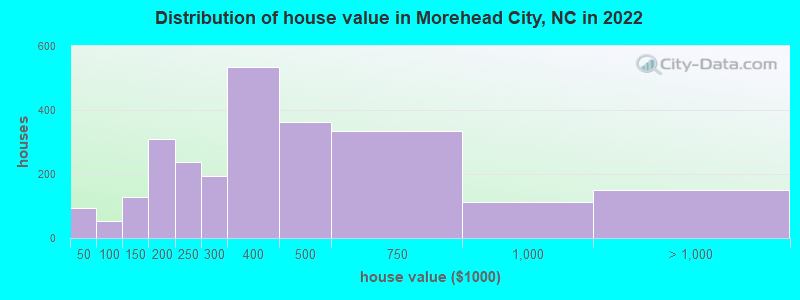
Home value of owner - occupied houses in 2022 in Morehead City, NC
-
- 45Less than $10,000
- 26$20,000 to $24,999
- 10$25,000 to $29,999
- 11$30,000 to $34,999
- 6$50,000 to $59,999
- 40$80,000 to $89,999
- 5$90,000 to $99,999
- 37$100,000 to $124,999
- 89$125,000 to $149,999
- 230$150,000 to $174,999
- 79$175,000 to $199,999
- 236$200,000 to $249,999
- 193$250,000 to $299,999
- 533$300,000 to $399,999
- 363$400,000 to $499,999
- 334$500,000 to $749,999
- 111$750,000 to $999,999
- 36$1,000,000 to $1,499,999
- 75$1,500,000 to $1,999,999
- 38$2,000,000 or more
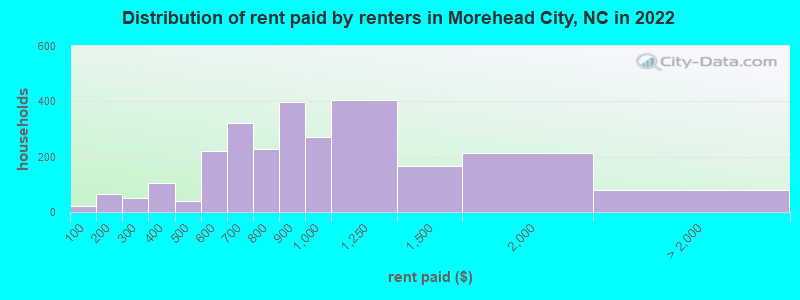
Rent paid by renters in 2022 in Morehead City, NC
-
- 22Less than $100
- 38$100 to $149
- 26$150 to $199
- 23$200 to $249
- 26$250 to $299
- 103$350 to $399
- 15$400 to $449
- 24$450 to $499
- 87$500 to $549
- 132$550 to $599
- 220$600 to $649
- 99$650 to $699
- 107$700 to $749
- 121$750 to $799
- 399$800 to $899
- 272$900 to $999
- 405$1,000 to $1,249
- 167$1,250 to $1,499
- 214$1,500 to $1,999
- 79No cash rent
Percentage of workers working in this county: 85.7%
Number of people working at home: 552 (11.9% of all workers)
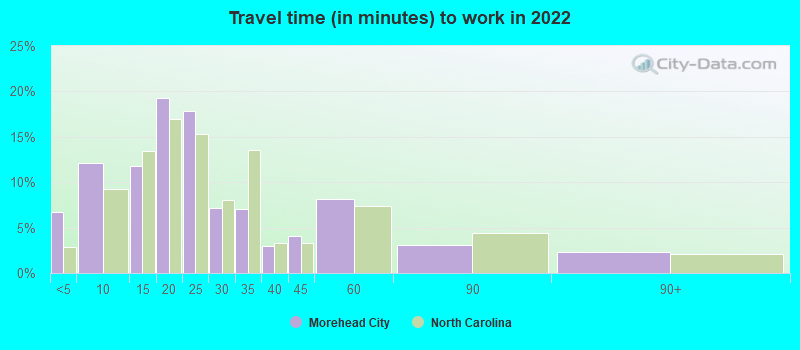
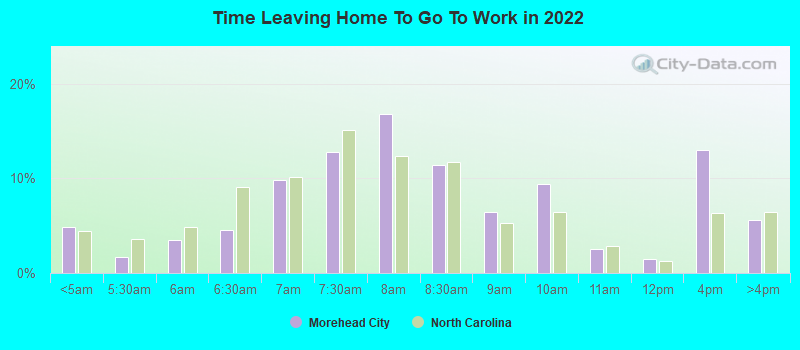
Travel time to work (commute)
- Less than 5 minutes: 385
- 5 to 9 minutes: 871
- 10 to 14 minutes: 452
- 15 to 19 minutes: 689
- 20 to 24 minutes: 281
- 25 to 29 minutes: 241
- 30 to 34 minutes: 325
- 35 to 39 minutes: 216
- 40 to 44 minutes: 78
- 45 to 59 minutes: 125
- 60 to 89 minutes: 146
- 90 or more minutes: 31
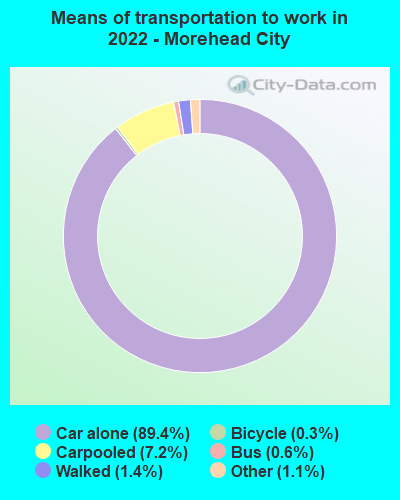
Means of transportation to work:
- Drove a car alone: 9,711 (81.7%)
- Carpooled: 813 (6.8%)
- Bus: 46 (0.4%)
- Taxi: 127 (1.1%)
- Bicycle: 35 (0.3%)
- Walked: 159 (1.3%)
- Worked at home: 552 (4.6%)
- Unemployment by race in 2022
- Unemployment rate for White non-Hispanic residents
- 2.1%Males
- 2.2%Females
- Unemployment rate for Black residents
- 5.6%Males
- Unemployment rate for two or more race residents
- 10.7%Females
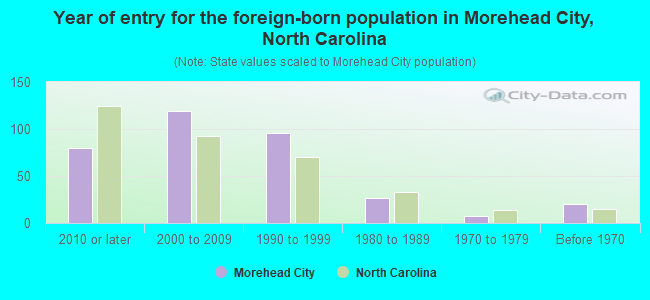
- Year of entry for the foreign-born population in Morehead City, North Carolina
- 802010 or later
- 1192000 to 2009
- 961990 to 1999
- 271980 to 1989
- 71970 to 1979
- 20Before 1970
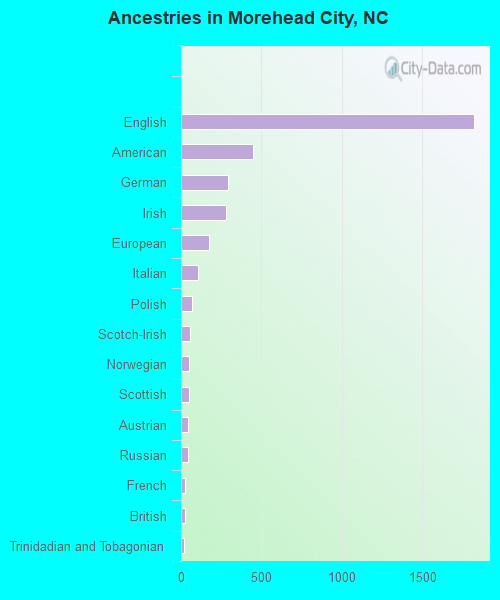
First ancestries reported:
- English: 1,823 (38.2%)
- American: 450 (9.4%)
- German: 293 (6.1%)
- Irish: 280 (5.9%)
- European: 173 (3.6%)
- Italian: 108 (2.3%)
- Polish: 66 (1.4%)
- Scotch-Irish: 56 (1.2%)
- Norwegian: 48 (1.0%)
- Scottish: 47 (1.0%)
- Austrian: 42 (0.9%)
- Russian: 42 (0.9%)
- French: 24 (0.5%)
- British: 22 (0.5%)
- Trinidadian and Tobagonian: 18 (0.4%)
- Greek: 14 (0.3%)
- Lebanese: 11 (0.2%)
- Dutch: 11 (0.2%)
- French Canadian: 11 (0.2%)
- Danish: 8 (0.2%)
- Scandinavian: 8 (0.2%)
- Ugandan: 6 (0.1%)
- Canadian: 4 (0.08%)
- African: 4 (0.08%)
- Ukrainian: 4 (0.08%)
- Czech: 3 (0.06%)
- Eastern European: 3 (0.06%)
- Hungarian: 3 (0.06%)
- Serbian: 2 (0.04%)
Most common places of birth for foreign-born residents (%):
| Morehead City: | 17.7% (63) |
| North Carolina: | 24.7% (214,776) |
| Morehead City: | 12.1% (43) |
| North Carolina: | 0.4% (3,587) |
| Morehead City: | 11.0% (39) |
| North Carolina: | 1.1% (9,831) |
| Morehead City: | 10.1% (36) |
| North Carolina: | 0.0% (73) |
| Morehead City: | 9.3% (33) |
| North Carolina: | 1.2% (10,140) |
| Morehead City: | 8.5% (30) |
| North Carolina: | 9.3% (80,594) |
| Morehead City: | 5.4% (19) |
| North Carolina: | 0.7% (6,091) |
| Morehead City: | 4.8% (17) |
| North Carolina: | 2.1% (18,105) |
| Morehead City: | 3.9% (14) |
| North Carolina: | 1.8% (15,534) |
| Morehead City: | 3.9% (14) |
| North Carolina: | 2.4% (20,695) |
| Morehead City: | 2.3% (8) |
| North Carolina: | 0.1% (1,162) |
| Morehead City: | 2.0% (7) |
| North Carolina: | 0.3% (2,520) |
| Morehead City: | 1.7% (6) |
| North Carolina: | 0.1% (994) |
| Morehead City: | 1.7% (6) |
| North Carolina: | 0.1% (998) |
Place of birth for U.S.-born residents:
- This state: 5,206
- Other state: 3,988
- Northeast: 1,091
- Midwest: 1,053
- South: 1,618
- West: 258
84.4% of Morehead City residents lived in the same house 1 years ago.
Out of people who lived in different houses, 23.0% lived in this county.
Out of people who lived in different counties, 33.3% lived in North Carolina.
| Morehead City: | 84.4% |
| State average: | 87.3% |
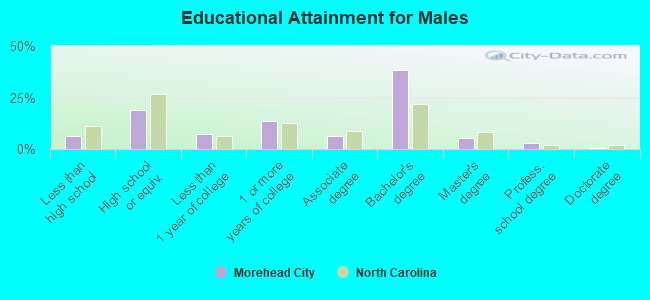
Education attainment for males 25 years and older:
- No schooling: 46
- Nursery to 4th grade: 0
- 5th and 6th grade: 0
- 7th and 8th grade: 5
- 9th grade: 10
- 10th grade: 99
- 11th grade: 0
- 12th grade, no diploma: 63
- High school graduate (or equivalency): 647
- Less than 1 year of college: 253
- Some college more than 1 year, no degree: 475
- Associate degree: 219
- Bachelor's degree: 1,310
- Master's degree: 186
- Professional school degree: 103
- Doctorate degree: 18
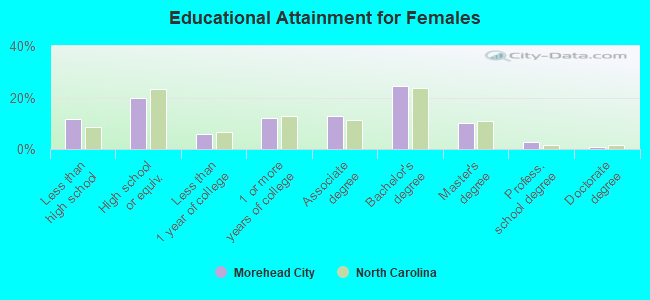
Education attainment for females 25 years and older:
- No schooling: 6
- Nursery to 4th grade: 22
- 5th and 6th grade: 15
- 7th and 8th grade: 27
- 9th grade: 128
- 10th grade: 108
- 11th grade: 153
- 12th grade, no diploma: 30
- High school graduate (or equivalency): 823
- Less than 1 year of college: 239
- Some college more than 1 year, no degree: 508
- Associate degree: 533
- Bachelor's degree: 1,013
- Master's degree: 414
- Professional school degree: 115
- Doctorate degree: 39
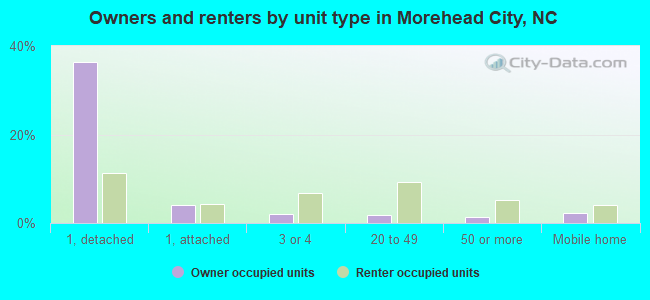
Housing units in structures:
- One, detached: 3,372
- One, attached: 509
- Two: 263
- 3 or 4: 484
- 5 to 9: 457
- 10 to 19: 266
- 20 to 49: 541
- 50 or more: 257
- Mobile homes: 298
- Boats, RVs, vans, etc.: 5
Housing units lacking complete kitchen facilities in 2022: 2.2%
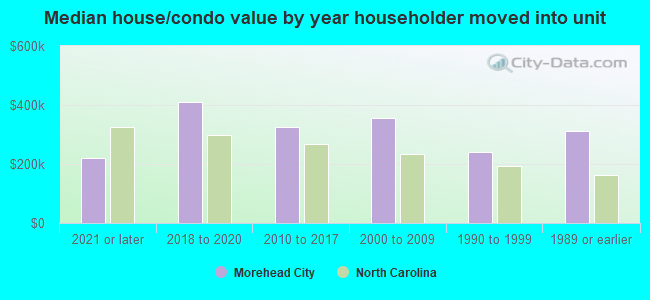
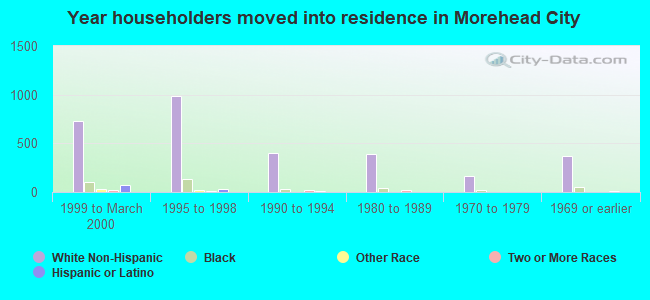
House/condo owner moved in on average 8 years ago
Renter moved in on average 3 years ago
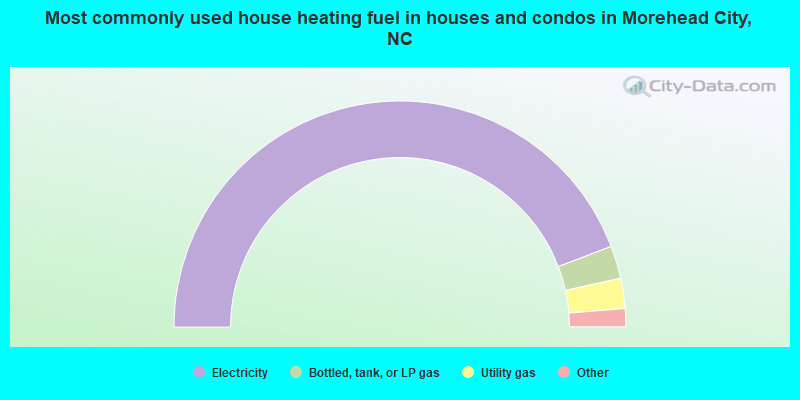
- 88.4%Electricity
- 4.7%Bottled, tank, or LP gas
- 4.3%Utility gas
- 1.8%Fuel oil, kerosene, etc.
- 0.5%No fuel used
- 0.3%Solar energy
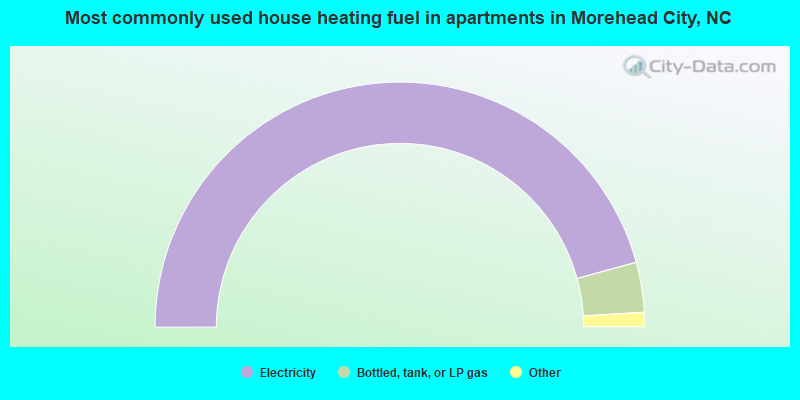
- 91.5%Electricity
- 6.6%Bottled, tank, or LP gas
- 1.2%Utility gas
- 0.5%Fuel oil, kerosene, etc.
- 0.2%No fuel used
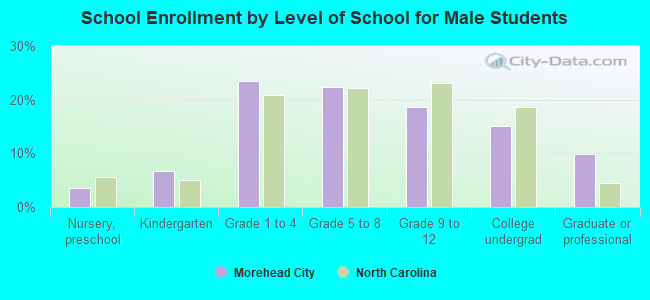
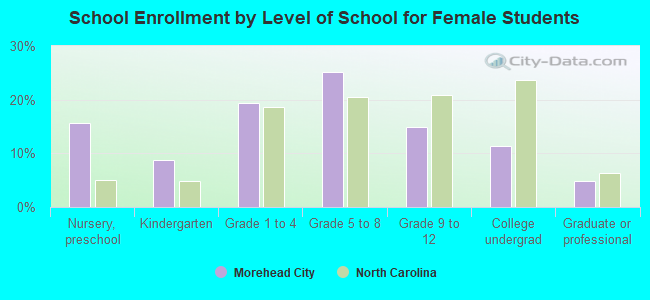
Private vs. public school enrollment:
| Here: | 23.1% |
| North Carolina: | 13.8% |
| Here: | 7.9% |
| North Carolina: | 11.9% |
| Here: | 21.5% |
| North Carolina: | 19.3% |