Housing density: 1,307 houses/condos per square mile
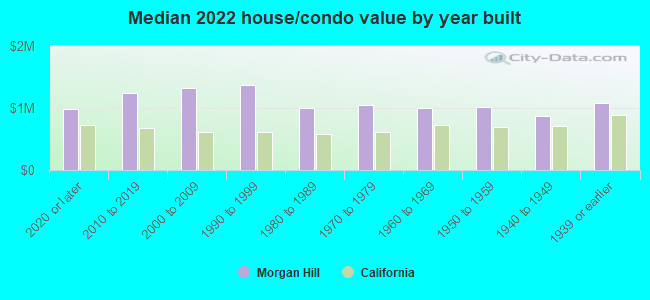
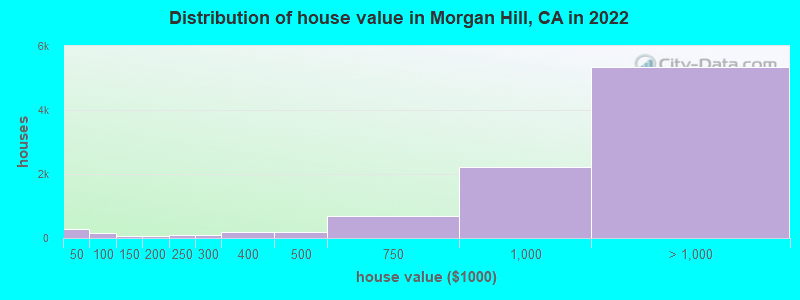
Median price asked for vacant for-sale houses and condos in 2022: $1,244,086.
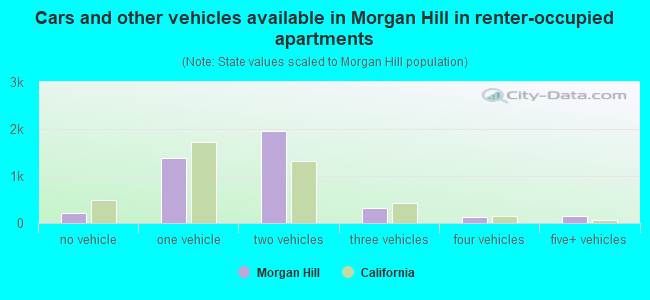
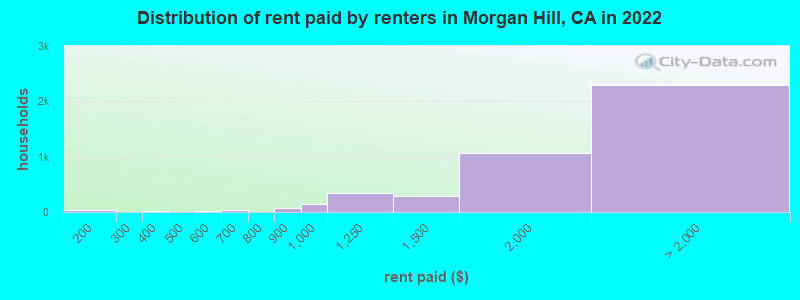
Median contract rent in 2022: over $2,000 (lower quartile is $1,473, upper quartile is over $2,000)
Median rent asked for vacant for-rent units in 2022: $3,114
Median gross rent in Morgan Hill, CA in 2022: over $2,000
Housing units in Morgan Hill with a mortgage: 7,519 (906 second mortgage, 20 home equity loan, 648 both second mortgage and home equity loan) Houses without a mortgage: 164
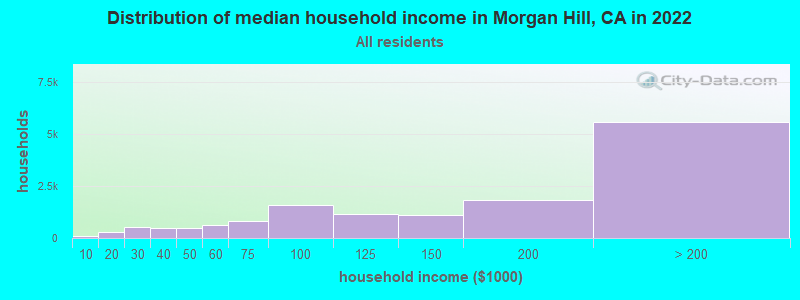
Median household income for houses/condos with a mortgage: $222,801
Median household income for apartments without a mortgage: $107,610
Median monthly housing costs: $2,711
Compare current foreclosures near Morgan Hill, CA:
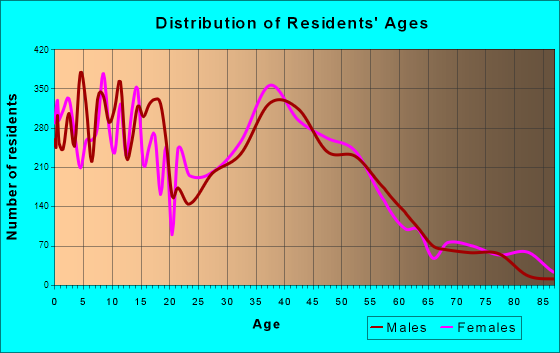
8,148 married couples with children.
1,705 single-parent households (289 men, 1,416 women).
66.4% of residents of Morgan Hill speak English at home.
18.2% of residents speak Spanish at home (70% speak English very well, 12% speak English well, 13% speak English not well, 5% don't speak English at all).
4.1% of residents speak other Indo-European language at home (80% speak English very well, 11% speak English well, 7% speak English not well, 2% don't speak English at all).
9.1% of residents speak Asian or Pacific Island language at home (62% speak English very well, 27% speak English well, 9% speak English not well, 2% don't speak English at all).
0.8% of residents speak other language at home (95% speak English very well, 2% speak English well, 3% speak English not well).
Foreign born population: 9,418 (21.3%)
(58.4% of them are naturalized citizens)
Percentage of workers working in this county: 94.1% Number of people working at home: 4,500 (21.6% of all workers)
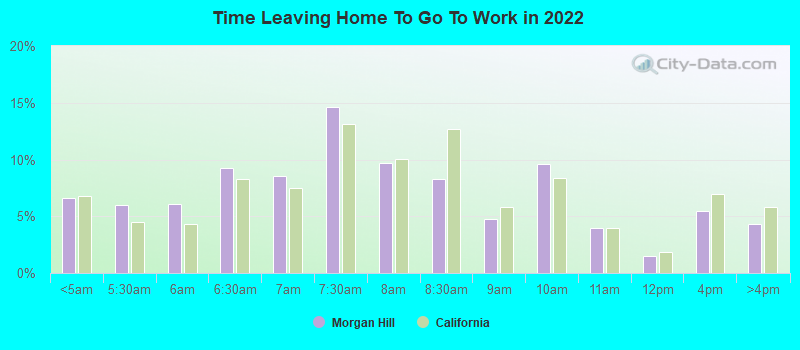
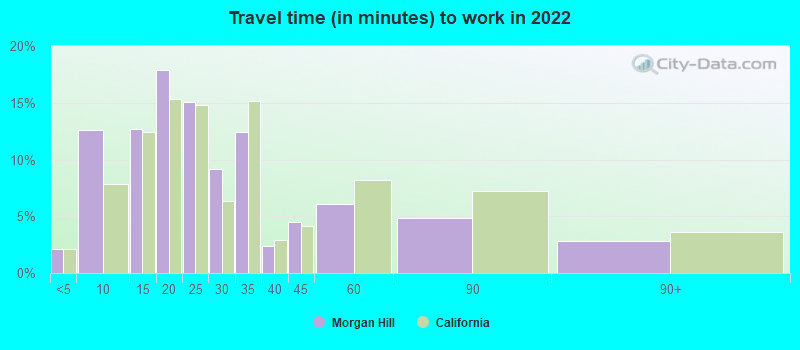
Travel time to work (commute)
Less than 5 minutes: 258
5 to 9 minutes: 1,700
10 to 14 minutes: 1,699
15 to 19 minutes: 1,747
20 to 24 minutes: 1,300
25 to 29 minutes: 618
30 to 34 minutes: 1,598
35 to 39 minutes: 773
40 to 44 minutes: 1,039
45 to 59 minutes: 1,991
60 to 89 minutes: 2,034
90 or more minutes: 562
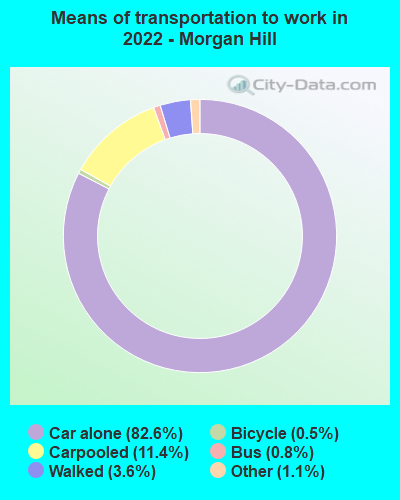
Means of transportation to work:
Drove a car alone: 11,598 (63.1%)
Carpooled: 1,641 (8.9%)
Bus: 79 (0.4%)
Ferryboat: 9 (0.0%)
Taxi: 165 (0.9%)
Bicycle: 82 (0.4%)
Walked: 510 (2.8%)
Worked at home: 4,500 (24.5%)
Unemployment by race in 2022
Unemployment rate for White non-Hispanic residents
3.0%Males
2.8%Females
Unemployment rate for American Indian and Alaska Native residents
10.7%Males
11.7%Females
Unemployment rate for Asian residents
4.3%Males
5.2%Females
Unemployment rate for other race residents
6.1%Males
7.2%Females
Unemployment rate for two or more race residents
5.8%Males
6.9%Females
Unemployment rate for Hispanic or Latino residents
4.9%Males
6.4%Females
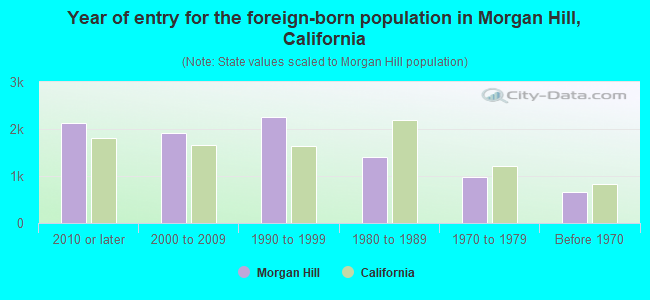
Year of entry for the foreign-born population in Morgan Hill, California
2,1362010 or later
1,9182000 to 2009
2,2521990 to 1999
1,4121980 to 1989
9831970 to 1979
652Before 1970
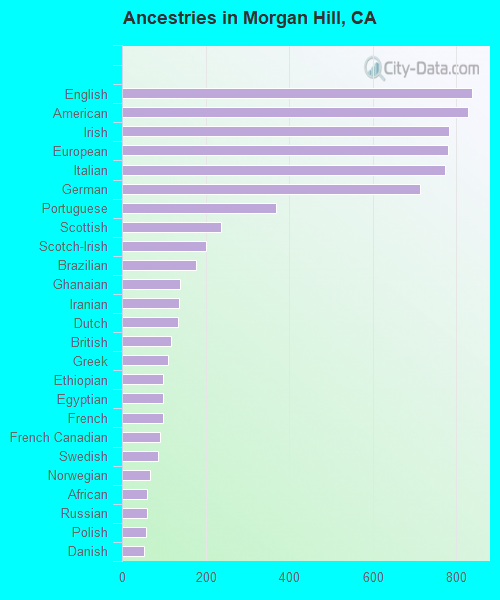
First ancestries reported:
English: 837 (3.7%)
American: 828 (3.7%)
Irish: 783 (3.5%)
European: 781 (3.5%)
Italian: 774 (3.4%)
German: 713 (3.2%)
Portuguese: 369 (1.6%)
Scottish: 237 (1.0%)
Scotch-Irish: 202 (0.9%)
Brazilian: 177 (0.8%)
Ghanaian: 140 (0.6%)
Iranian: 137 (0.6%)
Dutch: 133 (0.6%)
British: 118 (0.5%)
Greek: 111 (0.5%)
Ethiopian: 98 (0.4%)
Egyptian: 97 (0.4%)
French: 97 (0.4%)
French Canadian: 91 (0.4%)
Swedish: 87 (0.4%)
Norwegian: 67 (0.3%)
African: 60 (0.3%)
Russian: 59 (0.3%)
Polish: 58 (0.3%)
Danish: 53 (0.2%)
Scandinavian: 52 (0.2%)
Croatian: 48 (0.2%)
Pennsylvania German: 42 (0.2%)
Lithuanian: 31 (0.1%)
Eastern European: 29 (0.1%)
Welsh: 29 (0.1%)
West Indian: 29 (0.1%)
Swiss: 28 (0.1%)
Canadian: 25 (0.1%)
Slavic: 24 (0.1%)
Czech: 21 (0.09%)
Northern European: 18 (0.08%)
Jamaican: 17 (0.08%)
Israeli: 13 (0.06%)
Haitian: 12 (0.05%)
South African: 10 (0.04%)
Assyrian: 9 (0.04%)
Yugoslavian: 9 (0.04%)
Finnish: 8 (0.04%)
Romanian: 8 (0.04%)
Slovak: 8 (0.04%)
Iraqi: 8 (0.04%)
Belgian: 6 (0.03%)
Ukrainian: 6 (0.03%)
Slovene: 5 (0.02%)
Turkish: 5 (0.02%)
Palestinian: 4 (0.02%)
Lebanese: 3 (0.01%)
Most common places of birth for foreign-born residents (%):
Mexico
Morgan Hill:
33.2% (3,123)
California:
37.2% (3,881,193)
India
Morgan Hill:
11.0% (1,034)
California:
5.2% (539,184)
Vietnam
Morgan Hill:
10.8% (1,015)
California:
4.9% (512,335)
Philippines
Morgan Hill:
8.2% (775)
California:
7.8% (818,297)
China, excluding Hong Kong and Taiwan
Morgan Hill:
5.3% (497)
California:
6.6% (684,672)
United Kingdom, excluding England and Scotland
Morgan Hill:
2.7% (257)
California:
0.6% (60,582)
Canada
Morgan Hill:
2.7% (257)
California:
1.2% (127,477)
Korea
Morgan Hill:
2.5% (235)
California:
3.0% (315,248)
Taiwan
Morgan Hill:
2.0% (193)
California:
1.7% (176,274)
Cameroon
Morgan Hill:
1.9% (182)
California:
0.0% (3,174)
Place of birth for U.S.-born residents:
This state: 27,233
Other state: 6,743
Northeast: 1,906
Midwest: 1,543
South: 1,760
West: 1,529
87.7% of Morgan Hill residents lived in the same house 1 years ago. Out of people who lived in different houses, 42.4% lived in this county. Out of people who lived in different counties, 62.3% lived in California.
Morgan Hill:
87.7%
State average:
88.9%
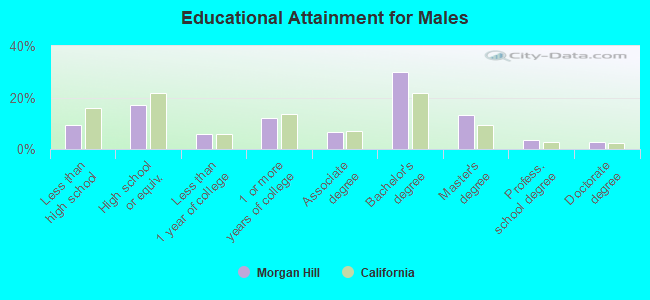
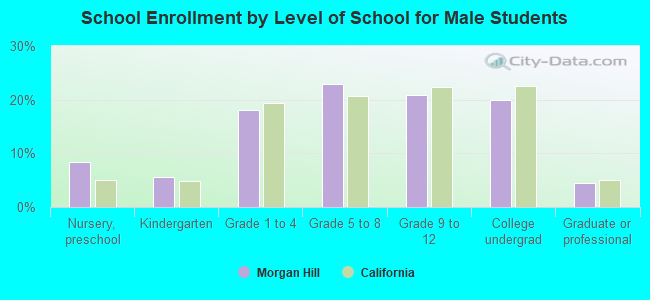
Education attainment for males 25 years and older:
No schooling: 337
Nursery to 4th grade: 146
5th and 6th grade: 220
7th and 8th grade: 6
9th grade: 96
10th grade: 151
11th grade: 89
12th grade, no diploma: 285
High school graduate (or equivalency): 2,470
Less than 1 year of college: 851
Some college more than 1 year, no degree: 1,730
Associate degree: 985
Bachelor's degree: 4,349
Master's degree: 1,919
Professional school degree: 536
Doctorate degree: 400
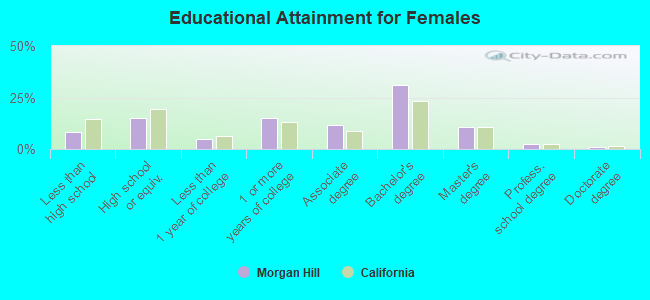
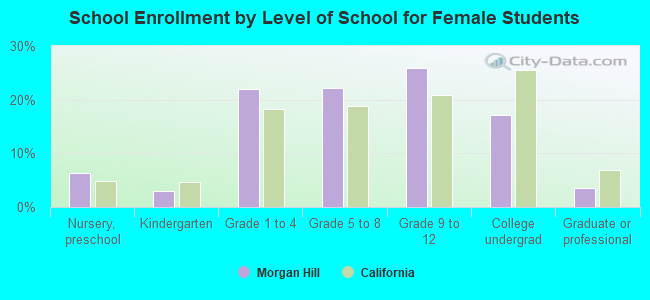
Education attainment for females 25 years and older:
No schooling: 242
Nursery to 4th grade: 156
5th and 6th grade: 177
7th and 8th grade: 87
9th grade: 132
10th grade: 109
11th grade: 101
12th grade, no diploma: 203
High school graduate (or equivalency): 2,185
Less than 1 year of college: 729
Some college more than 1 year, no degree: 2,202
Associate degree: 1,728
Bachelor's degree: 4,588
Master's degree: 1,552
Professional school degree: 346
Doctorate degree: 125
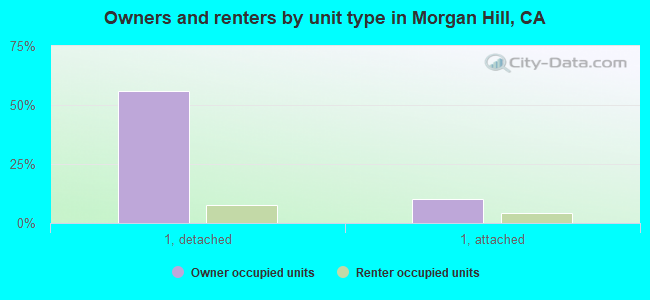
Housing units in structures:
One, detached: 8,992
One, attached: 2,570
Two: 120
3 or 4: 450
5 to 9: 646
10 to 19: 618
20 to 49: 314
50 or more: 433
Mobile homes: 1,008
Boats, RVs, vans, etc.: 89
Median worth of mobile homes: $274,424
Housing units lacking complete plumbing facilities in 2022: 0.0%
Housing units lacking complete kitchen facilities in 2022: 0.9%