Mount Prospect, IL (Illinois) Houses and Residents
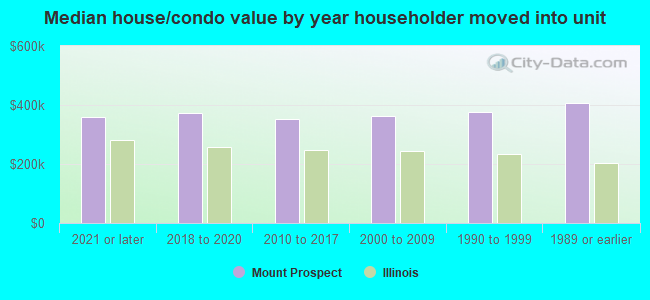
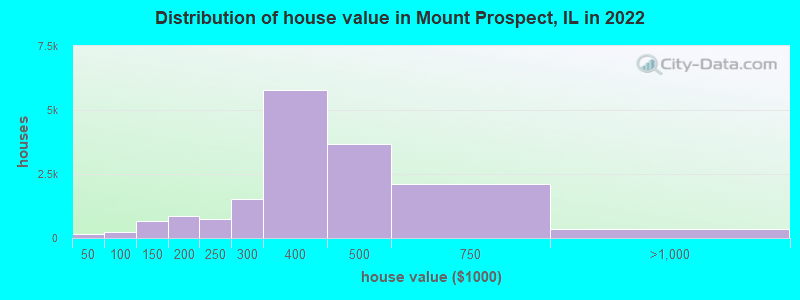
Estimated median house or condo value in 2022: $377,545 (it was $204,700 in 2000 )
Mount Prospect:
$377,545Illinois:
$251,600
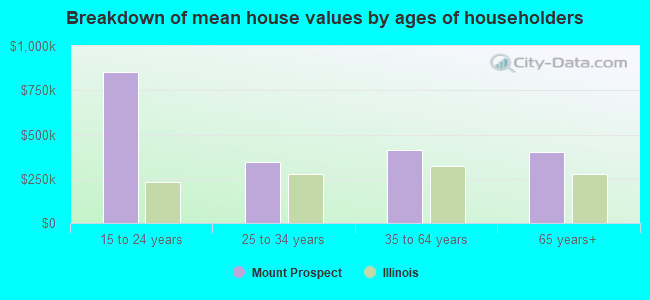
Lower value quartile - upper value quartile: $299,535 - $460,218Mean price in 2022: Detached houses: $469,763 Here:
$469,763State:
$310,164
Townhouses or other attached units: $258,980 Here:
$258,980State:
$286,230
In 2-unit structures: $449,996 Here:
$449,996State:
$299,638
In 3-to-4-unit structures: $295,740 Here:
$295,740State:
$330,907
In 5-or-more-unit structures: $249,591 Here:
$249,591State:
$318,887
Total population: 54,951 (All urban)
Houses: 23,132 (22,010 occupied: 15,639 owner occupied, 6,746 renter occupied )
% of renters here:
30%State:
33%
Housing density: 2,267 houses/condos per square mile
Median price asked for vacant for-sale houses and condos in 2022: $213,056.
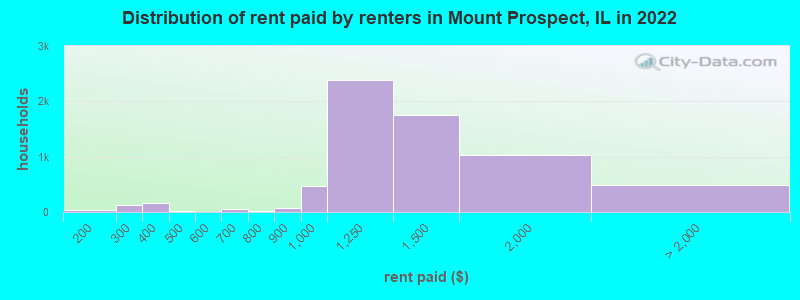
Median contract rent in 2022: $1,231 (lower quartile is $1,060, upper quartile is $1,455)
Median rent asked for vacant for-rent units in 2022: $1,357
Median gross rent in Mount Prospect, IL in 2022: $1,361
Housing units in Mount Prospect with a mortgage: 9,248 (1,051 second mortgage, 0 home equity loan, 960 both second mortgage and home equity loan )Houses without a mortgage: 303
Median household income for houses/condos with a mortgage: $136,816
Median household income for apartments without a mortgage: $96,300
Median monthly housing costs: $1,458
Data:
Median house or condo value ($)
Median house or condo value ($ change since 2000)
Median house or condo value ($) - White
Median house or condo value ($) - Black or African American
Median house or condo value ($) - Asian
Median house or condo value ($) - Hispanic or Latino
Median house or condo value ($) - American Indian and Alaska Native
Median house or condo value ($) - Multirace
Median house or condo value ($) - Other Race
Median price asked for mobile homes ($)
Household density (households per square mile)
Mean house or condo value by units in structure - 1, detached ($)
Mean house or condo value by units in structure - 1, attached ($)
Mean house or condo value by units in structure - 2 ($)
Mean house or condo value by units in structure by units in structure - 3 or 4 ($)
Mean house or condo value by units in structure - 5 or more ($)
Mean house or condo value by units in structure - Boat, RV, van, etc. ($)
Mean house or condo value by units in structure - Mobile home ($)
Median contract rent ($)
Median contract rent - Lower quartile ($)
Median contract rent - Upper quartile ($)
Median gross rent ($)
Urban houses (%)
Rural houses (%)
Houses occupied (%)
Houses occupied (% change since 2000)
Houses owner occupied (%)
Houses owner occupied (% change since 2000)
Houses renter occupied (%)
Houses renter occupied (% change since 2000)
Vacant housing units - For rent (%)
Vacant housing units - For rent (% change since 2000)
Vacant housing units - For sale only (%)
Vacant housing units - For sale only (% change since 2000)
Vacant housing units - Rented or sold, not occupied (%)
Vacant housing units - Rented or sold, not occupied (% change since 2000)
Vacant housing units - For seasonal, recreational, or occasional use (%)
Vacant housing units - For seasonal, recreational, or occasional use (% change since 2000)
Vacant housing units - For migrant workers (%)
Vacant housing units - For migrant workers (% change since 2000)
Vacant housing units - Other vacant (%)
Vacant housing units - Other vacant (% change since 2000)
Median monthly housing costs ($)
Median household income for houses/condos with a mortgage ($)
Median household income for houses/condos without a mortgage ($)
Median household income ($)
Median household income ($) - White
Median household income ($) - Black or African American
Median household income ($) - Asian
Median household income ($) - Hispanic or Latino
Median household income ($) - American Indian and Alaska Native
Median household income ($) - Multirace
Median household income ($) - Other Race
Mortgage status - with mortgage (%)
Mortgage status - with second mortgage (%)
Mortgage status - with home equity loan (%)
Mortgage status - with both second mortgage and home equity loan (%)
Mortgage status - without a mortgage (%)
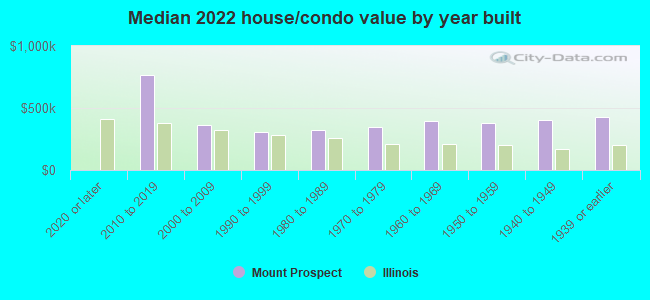
Median year house/condo built
Median year apartment built
Household type by relationship - Male householder living alone (%)
Household type by relationship - Male householder not living alone (%)
Household type by relationship - Female householder living alone (%)
Household type by relationship - Female householder not living alone (%)
Household type by relationship - Opposite-Sex spouse (%)
Household type by relationship - Same-Sex spouse (%)
Household type by relationship - Opposite-Sex unmarried partner (%)
Household type by relationship - Same-Sex unmarried partner (%)
Household type by relationship - In group quarters (%)
Size of family households - 2-person household (%)
Size of family households - 3-person household (%)
Size of family households - 4-person household (%)
Size of family households - 5-person household (%)
Size of family households - 6-person household (%)
Size of family households - 7-or-more-person household (%)
Size of nonfamily households - 1-person household (%)
Size of nonfamily households - 2-person household (%)
Size of nonfamily households - 3-person household (%)
Size of nonfamily households - 4-person household (%)
Size of nonfamily households - 5-person household (%)
Size of nonfamily households - 6-person household (%)
Size of nonfamily households - 7-or-moreperson household (%)
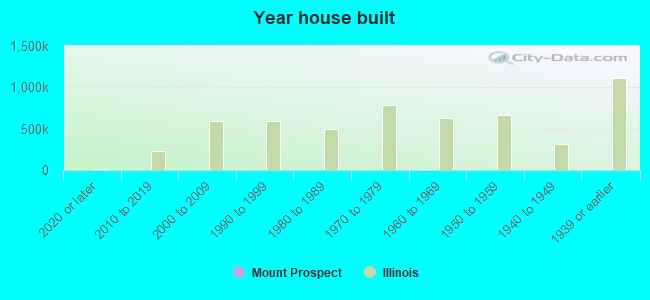
Year house built - Built 2010 or later (%)
Year house built - Built 2000 to 2009 (%)
Year house built - Built 1990 to 1999 (%)
Year house built - Built 1980 to 1989 (%)
Year house built - Built 1970 to 1979 (%)
Year house built - Built 1960 to 1969 (%)
Year house built - Built 1950 to 1959 (%)
Year house built - Built 1940 to 1949 (%)
Year house built - Built 1939 or earlier (%)
Median number of rooms in houses and condos
Median number of rooms in apartments
Median number of bedrooms in owner occupied houses
Mean number of bedrooms in owner occupied houses
Median number of bedrooms in renter occupied houses
Mean number of bedrooms in renter occupied houses
Median number of vehichles in owner occupied houses
Mean number of vehichles in owner occupied houses
Median number of vehichles in renter occupied houses
Mean number of vehichles in renter occupied houses
Rooms in owner-occupied houses - 1 room (%)
Rooms in owner-occupied houses - 2 rooms (%)
Rooms in owner-occupied houses - 3 rooms (%)
Rooms in owner-occupied houses - 4 rooms (%)
Rooms in owner-occupied houses - 5 rooms (%)
Rooms in owner-occupied houses - 6 rooms (%)
Rooms in owner-occupied houses - 7 rooms (%)
Rooms in owner-occupied houses - 8 rooms (%)
Rooms in owner-occupied houses - 9+ rooms (%)
Rooms in renter-occupied houses - 1 room (%)
Rooms in renter-occupied houses - 2 rooms (%)
Rooms in renter-occupied houses - 3 rooms (%)
Rooms in renter-occupied houses - 4 rooms (%)
Rooms in renter-occupied houses - 5 rooms (%)
Rooms in renter-occupied houses - 6 rooms (%)
Rooms in renter-occupied houses - 7 rooms (%)
Rooms in renter-occupied houses - 8 rooms (%)
Rooms in renter-occupied houses - 9+ rooms (%)
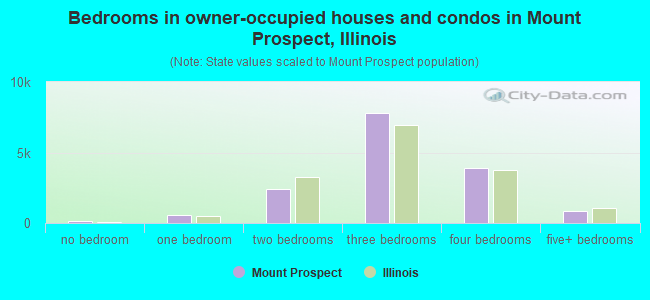
Bedrooms in owner-occupied houses - no bedrooms (%)
Bedrooms in owner-occupied houses - 1 bedroom (%)
Bedrooms in owner-occupied houses - 2 bedrooms (%)
Bedrooms in owner-occupied houses - 3 bedrooms (%)
Bedrooms in owner-occupied houses - 4 bedrooms (%)
Bedrooms in owner-occupied houses - 5+ bedrooms (%)
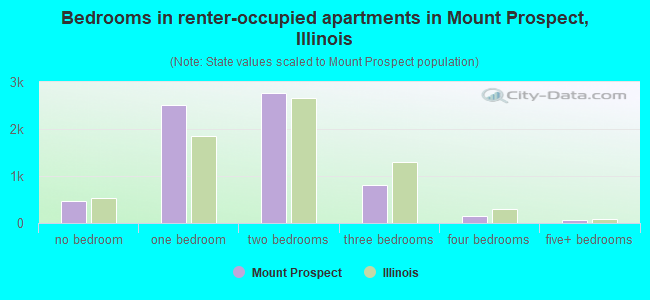
Bedrooms in renter-occupied houses - no bedrooms (%)
Bedrooms in renter-occupied houses - 1 bedroom (%)
Bedrooms in renter-occupied houses - 2 bedrooms (%)
Bedrooms in renter-occupied houses - 3 bedrooms (%)
Bedrooms in renter-occupied houses - 4 bedrooms (%)
Bedrooms in renter-occupied houses - 5+ bedrooms (%)
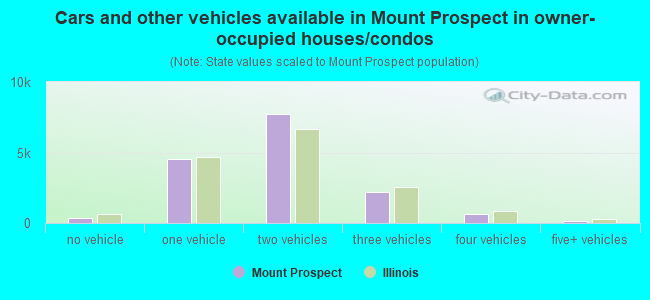
Vehicles available in owner-occupied houses - no vehicle available (%)
Vehicles available in owner-occupied houses - 1 vehicle available(%)
Vehicles available in owner-occupied houses - 2 Vehicles available (%)
Vehicles available in owner-occupied houses - 3 Vehicles available (%)
Vehicles available in owner-occupied houses - 4 Vehicles available (%)
Vehicles available in owner-occupied houses - 5+ Vehicles available (%)
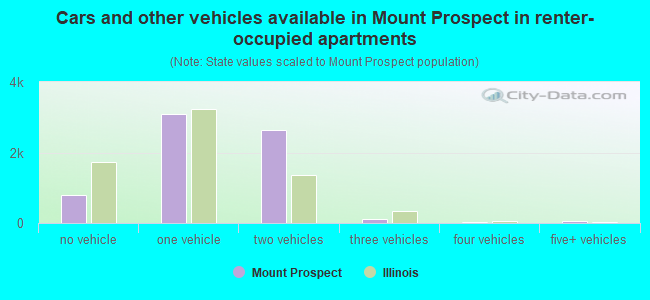
Vehicles available in renter-occupied houses - no vehicle available (%)
Vehicles available in renter-occupied houses - 1 vehicle available (%)
Vehicles available in renter-occupied houses - 2 Vehicles available (%)
Vehicles available in renter-occupied houses - 3 Vehicles available (%)
Vehicles available in renter-occupied houses - 4 Vehicles available (%)
Vehicles available in renter-occupied houses - 5+ Vehicles available (%)
Housing units in structures - 1, detached (%)
Housing units in structures - 1, attached (%)
Housing units in structures - 2 (%)
Housing units in structures - 3 or 4 (%)
Housing units in structures - 5 to 9 (%)
Housing units in structures - 10 to 19 (%)
Housing units in structures - 20 to 49 (%)
Housing units in structures - 50 or more (%)
Housing units in structures - Mobile home (%)
Housing units in structures - Boat, RV, van, etc. (%)
Housing units in structures - Owners - 1, detached (%)
Housing units in structures - Owners - 1, attached (%)
Housing units in structures - Owners - 2 (%)
Housing units in structures - Owners - 3 or 4 (%)
Housing units in structures - Owners - 5 to 9 (%)
Housing units in structures - Owners - 10 to 19 (%)
Housing units in structures - Owners - 20 to 49 (%)
Housing units in structures - Owners - 50 or more (%)
Housing units in structures - Owners - Mobile home (%)
Housing units in structures - Owners - Boat, RV, van, etc. (%)
Housing units in structures - Renters - 1, detached (%)
Housing units in structures - Renters - 1, attached (%)
Housing units in structures - Renters - 2 (%)
Housing units in structures - Renters - 3 or 4 (%)
Housing units in structures - Renters - 5 to 9 (%)
Housing units in structures - Renters - 10 to 19 (%)
Housing units in structures - Renters - 20 to 49 (%)
Housing units in structures - Renters - 50 or more (%)
Housing units in structures - Renters - Mobile home (%)
Housing units in structures - Renters - Boat, RV, van, etc. (%)
House/condo owner moved in on average (years ago)
Renter moved in on average (years ago)
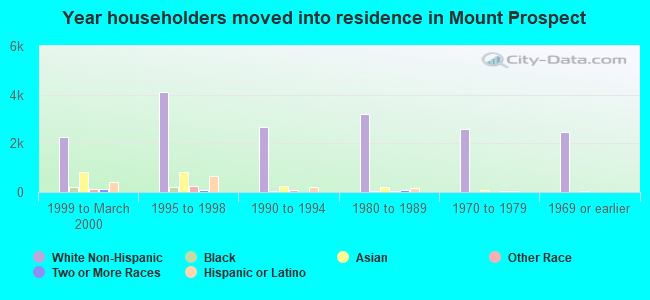
Year householder moved into unit - Moved in 1999 to March 2000 (%)
Year householder moved into unit - Moved in 1999 to March 2000 (%) - White
Year householder moved into unit - Moved in 1999 to March 2000 (%) - Black or African American
Year householder moved into unit - Moved in 1999 to March 2000 (%) - Asian
Year householder moved into unit - Moved in 1999 to March 2000 (%) - Hispanic or Latino
Year householder moved into unit - Moved in 1999 to March 2000 (%) - American Indian and Alaska Native
Year householder moved into unit - Moved in 1999 to March 2000 (%) - Multirace
Year householder moved into unit - Moved in 1999 to March 2000 (%) - Other Race
Year householder moved into unit - Moved in 1995 to 1998 (%)
Year householder moved into unit - Moved in 1995 to 1998 (%) - White
Year householder moved into unit - Moved in 1995 to 1998 (%) - Black or African American
Year householder moved into unit - Moved in 1995 to 1998 (%) - Asian
Year householder moved into unit - Moved in 1995 to 1998 (%) - Hispanic or Latino
Year householder moved into unit - Moved in 1995 to 1998 (%) - American Indian and Alaska Native
Year householder moved into unit - Moved in 1995 to 1998 (%) - Multirace
Year householder moved into unit - Moved in 1995 to 1998 (%) - Other Race
Year householder moved into unit - Moved in 1990 to 1994 (%)
Year householder moved into unit - Moved in 1990 to 1994 (%) - White
Year householder moved into unit - Moved in 1990 to 1994 (%) - Black or African American
Year householder moved into unit - Moved in 1990 to 1994 (%) - Asian
Year householder moved into unit - Moved in 1990 to 1994 (%) - Hispanic or Latino
Year householder moved into unit - Moved in 1990 to 1994 (%) - American Indian and Alaska Native
Year householder moved into unit - Moved in 1990 to 1994 (%) - Multirace
Year householder moved into unit - Moved in 1990 to 1994 (%) - Other Race
Year householder moved into unit - Moved in 1980 to 1989 (%)
Year householder moved into unit - Moved in 1980 to 1989 (%) - White
Year householder moved into unit - Moved in 1980 to 1989 (%) - Black or African American
Year householder moved into unit - Moved in 1980 to 1989 (%) - Asian
Year householder moved into unit - Moved in 1980 to 1989 (%) - Hispanic or Latino
Year householder moved into unit - Moved in 1980 to 1989 (%) - American Indian and Alaska Native
Year householder moved into unit - Moved in 1980 to 1989 (%) - Multirace
Year householder moved into unit - Moved in 1980 to 1989 (%) - Other Race
Year householder moved into unit - Moved in 1970 to 1979 (%)
Year householder moved into unit - Moved in 1970 to 1979 (%) - White
Year householder moved into unit - Moved in 1970 to 1979 (%) - Black or African American
Year householder moved into unit - Moved in 1970 to 1979 (%) - Asian
Year householder moved into unit - Moved in 1970 to 1979 (%) - Hispanic or Latino
Year householder moved into unit - Moved in 1970 to 1979 (%) - American Indian and Alaska Native
Year householder moved into unit - Moved in 1970 to 1979 (%) - Multirace
Year householder moved into unit - Moved in 1970 to 1979 (%) - Other Race
Year householder moved into unit - Moved in 1969 or earlier (%)
Year householder moved into unit - Moved in 1969 or earlier (%) - White
Year householder moved into unit - Moved in 1969 or earlier (%) - Black or African American
Year householder moved into unit - Moved in 1969 or earlier (%) - Asian
Year householder moved into unit - Moved in 1969 or earlier (%) - Hispanic or Latino
Year householder moved into unit - Moved in 1969 or earlier (%) - American Indian and Alaska Native
Year householder moved into unit - Moved in 1969 or earlier (%) - Multirace
Year householder moved into unit - Moved in 1969 or earlier (%) - Other Race
Housing units lacking complete plumbing facilities (%)
Housing units lacking complete kitchen facilities (%)
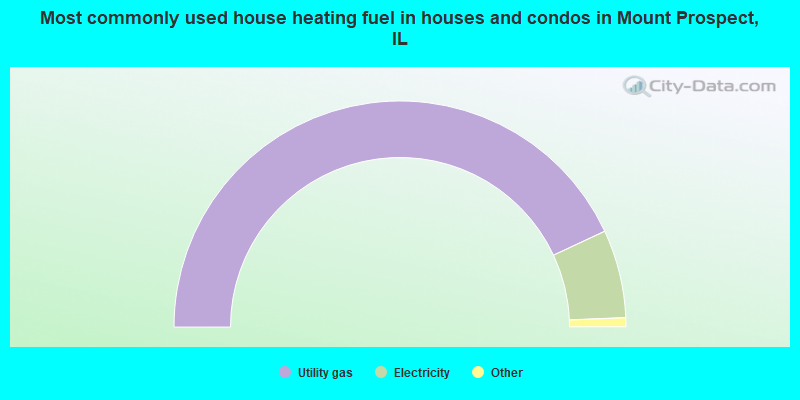
House heating fuel used in houses and condos - Utility gas (%)
House heating fuel used in houses and condos - Bottled, tank, or LP gas (%)
House heating fuel used in houses and condos - Electricity (%)
House heating fuel used in houses and condos - Fuel oil, kerosene, etc. (%)
House heating fuel used in houses and condos - Coal or coke (%)
House heating fuel used in houses and condos - Wood (%)
House heating fuel used in houses and condos - Solar energy (%)
House heating fuel used in houses and condos - Other fuel (%)
House heating fuel used in houses and condos - No fuel used (%)
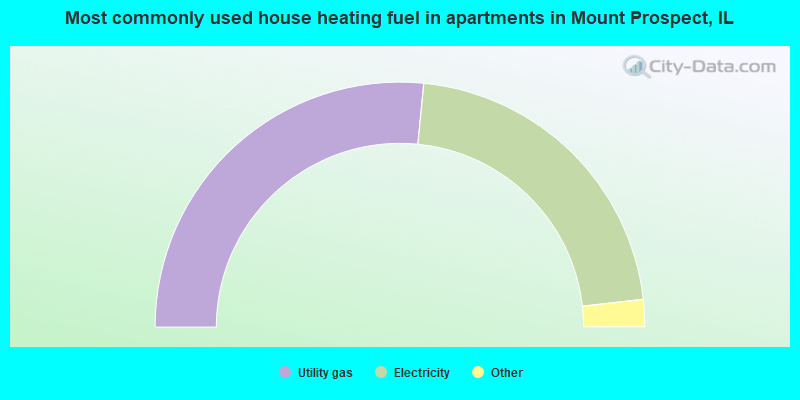
House heating fuel used in apartments - Utility gas (%)
House heating fuel used in apartments - Bottled, tank, or LP gas (%)
House heating fuel used in apartments - Electricity (%)
House heating fuel used in apartments - Fuel oil, kerosene, etc. (%)
House heating fuel used in apartments - Coal or coke (%)
House heating fuel used in apartments - Wood (%)
House heating fuel used in apartments - Solar energy (%)
House heating fuel used in apartments - Other fuel (%)
House heating fuel used in apartments - No fuel used (%)
Median year house/condo built: 1965Median year apartment built: 1979Household type by relationship:
Households: 54,942
Male householders: 11,458 (2,267 living alone ), Female householders: 9,971 (3,161 living alone )12,118 spouses (12,063 opposite-sex spouses ), 1,056 unmarried partners , (1,043 opposite-sex unmarried partners ), 15,488 children (14,801 natural , 274 adopted , 411 stepchildren ), 495 grandchildren , 729 brothers or sisters , 1,598 parents , 0 foster children , 459 other relatives , 1,443 non-relatives In group quarters: 123
Size of family households: 6,233 2-persons , 3,650 3-persons , 3,306 4-persons , 1,351 5-persons , 257 6-persons , 98 7-or-more-persons .
Size of nonfamily households: 5,831 1-person , 1,240 2-persons , 90 3-persons , 205 4-persons .
8,720 married couples with children. single-parent households (128 men , 1,607 women ).
57.5% of residents of Mount Prospect speak English at home. of residents speak Spanish at home (58% speak English very well , 20% speak English well , 12% speak English not well , 10% don't speak English at all ).of residents speak other Indo-European language at home (60% speak English very well , 24% speak English well , 12% speak English not well , 3% don't speak English at all ).of residents speak Asian or Pacific Island language at home (64% speak English very well , 23% speak English well , 9% speak English not well , 4% don't speak English at all ).of residents speak other language at home (76% speak English very well , 22% speak English well , 1% speak English not well ).
Foreign born population: 16,767 (30.5%)of them are naturalized citizens )
Median number of rooms in houses and condos:
Median number of rooms in apartments
Owner-occupied Renter-occupied
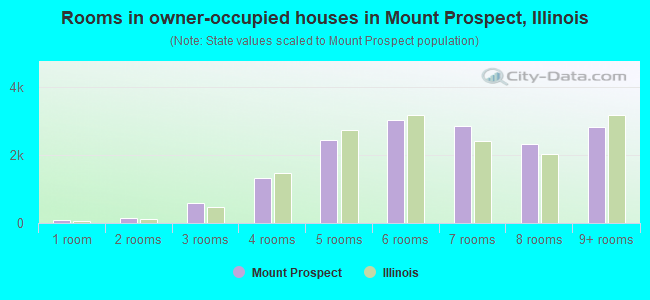
Rooms in owner-occupied houses in Mount Prospect, Illinois
93 1 room 143 2 rooms 599 3 rooms 1,329 4 rooms 2,436 5 rooms 3,037 6 rooms 2,850 7 rooms 2,321 8 rooms 2,833 9+ rooms
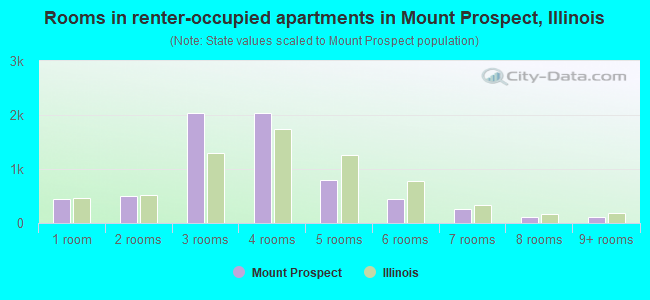
Rooms in renter-occupied apartments in Mount Prospect, Illinois
443 1 room 509 2 rooms 2,030 3 rooms 2,034 4 rooms 799 5 rooms 451 6 rooms 253 7 rooms 109 8 rooms 118 9+ rooms
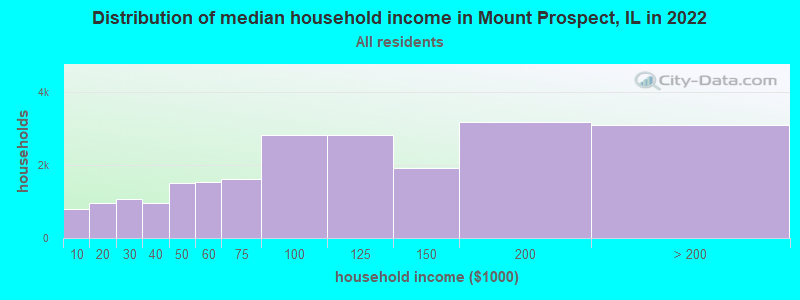
Mount Prospect, IL household income distribution 790 Less than $10,000966 $10,000 to $19,9991,074 $20,000 to $29,999964 $30,000 to $39,9991,510 $40,000 to $49,9991,531 $50,000 to $59,9991,602 $60,000 to $74,9992,826 $75,000 to $99,9992,825 $100,000 to $124,9991,904 $125,000 to $149,9993,174 $150,000 to $199,9993,104 $200,000 or more
Home value of owner - occupied houses in 2022 in Mount Prospect, IL 58 Less than $10,0007 $10,000 to $14,9999 $20,000 to $24,9998 $25,000 to $29,99916 $35,000 to $39,99948 $40,000 to $49,99911 $50,000 to $59,99934 $70,000 to $79,99937 $80,000 to $89,99983 $90,000 to $99,999421 $100,000 to $124,999232 $125,000 to $149,999354 $150,000 to $174,999521 $175,000 to $199,999745 $200,000 to $249,9991,514 $250,000 to $299,9995,763 $300,000 to $399,9993,663 $400,000 to $499,9992,111 $500,000 to $749,999307 $750,000 to $999,9998 $1,000,000 to $1,499,9996 $1,500,000 to $1,999,99925 $2,000,000 or moreRent paid by renters in 2022 in Mount Prospect, IL 15 Less than $10045 $150 to $199113 $200 to $24921 $250 to $299111 $300 to $34944 $350 to $3998 $400 to $44913 $450 to $4992 $550 to $5999 $600 to $64944 $650 to $69920 $700 to $74975 $800 to $899470 $900 to $9992,393 $1,000 to $1,2491,752 $1,250 to $1,4991,034 $1,500 to $1,999260 $2,000 to $2,49959 $2,500 to $2,99910 $3,000 to $3,499151 No cash rent
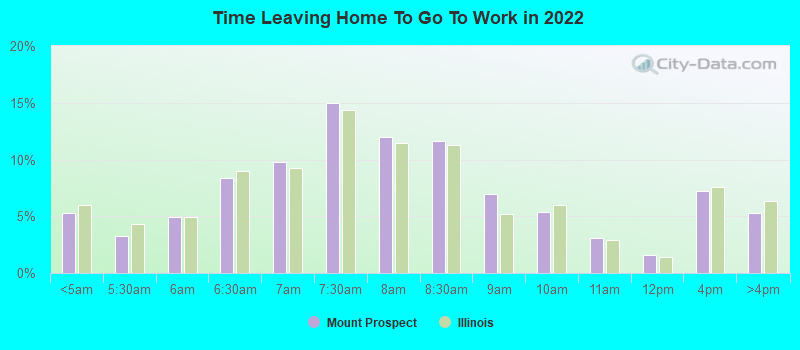
Percentage of workers working in this county: 86.1%Number of people working at home: 5,112 (17.5% of all workers )
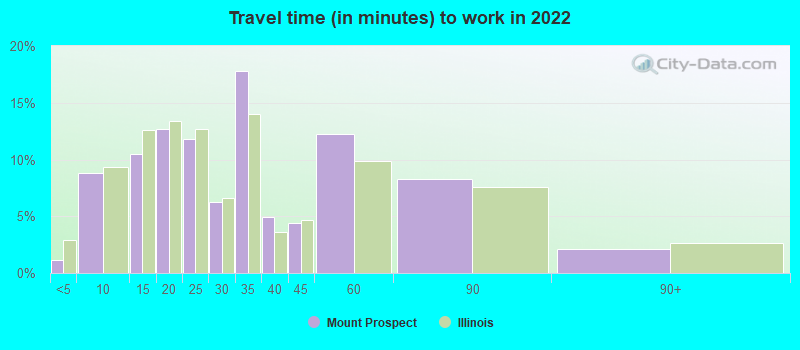
Travel time to work (commute)
Less than 5 minutes: 3095 to 9 minutes: 2,41110 to 14 minutes: 3,13015 to 19 minutes: 3,45820 to 24 minutes: 3,15925 to 29 minutes: 1,39030 to 34 minutes: 3,75535 to 39 minutes: 70840 to 44 minutes: 1,09445 to 59 minutes: 2,34660 to 89 minutes: 1,87190 or more minutes: 496
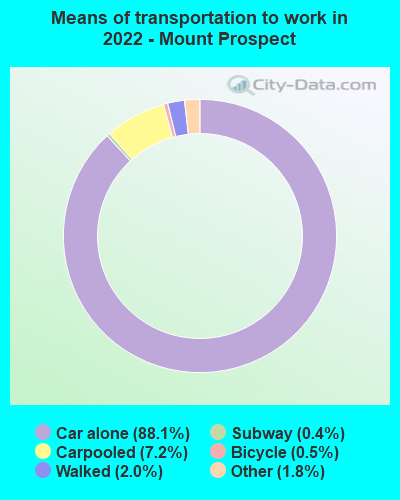
Means of transportation to work:
Drove a car alone: 16,892 (71.7%)Carpooled: 1,472 (6.2%)Bus : 12 (0.1%)Long-distance train or commuter rail : 54 (0.2%)Taxi: 343 (1.5%)Bicycle: 93 (0.4%)Walked: 392 (1.7%)Worked at home: 5,112 (21.7%)
Unemployment by race in 2022
Unemployment rate for White non-Hispanic residents 2.3% Males3.5% FemalesUnemployment rate for Black residents 5.5% Males0.3% FemalesUnemployment rate for Asian residents 4.6% Males0.2% FemalesUnemployment rate for other race residents 2.7% Males0.6% FemalesUnemployment rate for two or more race residents 9.0% Males0.7% FemalesUnemployment rate for Hispanic or Latino residents 3.7% Males0.2% Females
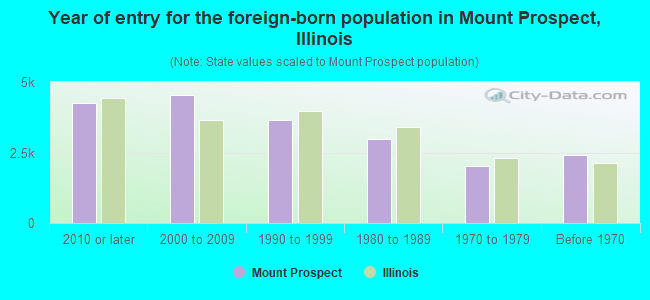
Year of entry for the foreign-born population in Mount Prospect, Illinois
4,268 2010 or later 4,555 2000 to 2009 3,639 1990 to 1999 2,972 1980 to 1989 2,004 1970 to 1979 2,420 Before 1970
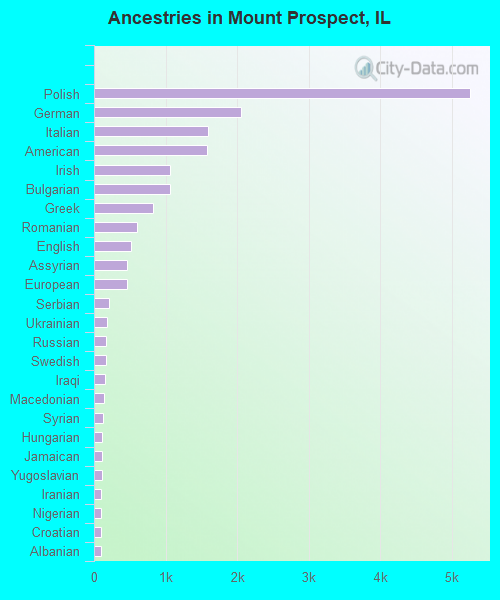
First ancestries reported:
Polish: 5,259 (16.8%)
German: 2,051 (6.5%)
Italian: 1,588 (5.1%)
American: 1,584 (5.1%)
Irish: 1,067 (3.4%)
Bulgarian: 1,056 (3.4%)
Greek: 824 (2.6%)
Romanian: 603 (1.9%)
English: 515 (1.6%)
Assyrian: 468 (1.5%)
European: 456 (1.5%)
Serbian: 203 (0.6%)
Ukrainian: 182 (0.6%)
Russian: 174 (0.6%)
Swedish: 163 (0.5%)
Iraqi: 157 (0.5%)
Macedonian: 135 (0.4%)
Syrian: 125 (0.4%)
Hungarian: 108 (0.3%)
Jamaican: 108 (0.3%)
Yugoslavian: 105 (0.3%)
Iranian: 103 (0.3%)
Nigerian: 100 (0.3%)
Croatian: 99 (0.3%)
Albanian: 92 (0.3%)
Canadian: 90 (0.3%)
Scotch-Irish: 86 (0.3%)
Slovak: 84 (0.3%)
Lithuanian: 84 (0.3%)
Norwegian: 82 (0.3%)
Czech: 68 (0.2%)
French: 55 (0.2%)
Latvian: 54 (0.2%)
Turkish: 51 (0.2%)
Dutch: 48 (0.2%)
Eastern European: 43 (0.1%)
African: 40 (0.1%)
Scottish: 36 (0.1%)
Scandinavian: 28 (0.09%)
Cypriot: 26 (0.08%)
Palestinian: 24 (0.08%)
Australian: 24 (0.08%)
Arab: 21 (0.07%)
Jordanian: 16 (0.05%)
Brazilian: 16 (0.05%)
Egyptian: 16 (0.05%)
Welsh: 15 (0.05%)
Lebanese: 13 (0.04%)
British: 13 (0.04%)
Austrian: 13 (0.04%)
Czechoslovakian: 12 (0.04%)
Portuguese: 11 (0.04%)
Swiss: 11 (0.04%)
Danish: 9 (0.03%)
Slavic: 9 (0.03%)
Slovene: 9 (0.03%)
Armenian: 8 (0.03%)
Northern European: 7 (0.02%)
Belgian: 6 (0.02%)
Luxembourger: 5 (0.02%)
Most common places of birth for foreign-born residents (%): Mexico Mount Prospect:
19.7% (3,307)Illinois:
34.7% (626,958)
Poland Mount Prospect:
18.5% (3,097)Illinois:
6.9% (124,474)
India Mount Prospect:
11.2% (1,885)Illinois:
9.2% (166,409)
Bulgaria Mount Prospect:
5.3% (883)Illinois:
0.8% (14,165)
Philippines Mount Prospect:
4.1% (686)Illinois:
5.2% (93,003)
Korea Mount Prospect:
4.0% (673)Illinois:
2.2% (40,393)
Other South Central Asia Mount Prospect:
3.9% (648)Illinois:
0.1% (2,412)
Italy Mount Prospect:
2.6% (433)Illinois:
0.9% (15,679)
Romania Mount Prospect:
2.4% (400)Illinois:
0.8% (14,736)
Ukraine Mount Prospect:
2.3% (393)Illinois:
1.6% (29,316)
Greece Mount Prospect:
2.1% (357)Illinois:
0.6% (10,720)
Moldova Mount Prospect:
1.8% (300)Illinois:
0.3% (4,938)
Iraq Mount Prospect:
1.6% (276)Illinois:
0.7% (13,214)
Place of birth for U.S.-born residents:
This state: 32,304Other state: 5,425Northeast: 753Midwest: 3,111South: 892West: 734 89.4% of Mount Prospect residents lived in the same house 1 years ago.
Out of people who lived in different houses, 45.1% lived in this county.
Out of people who lived in different counties, 40.8% lived in Illinois.
Mount Prospect:
89.4%State average:
88.3%
Education attainment for males 25 years and older:
No schooling: 619Nursery to 4th grade: 175th and 6th grade: 3127th and 8th grade: 2069th grade: 10010th grade: 7611th grade: 12612th grade, no diploma: 269High school graduate (or equivalency): 4,256Less than 1 year of college: 980Some college more than 1 year, no degree: 1,972Associate degree: 1,593Bachelor's degree: 6,104Master's degree: 2,213Professional school degree: 583Doctorate degree: 449
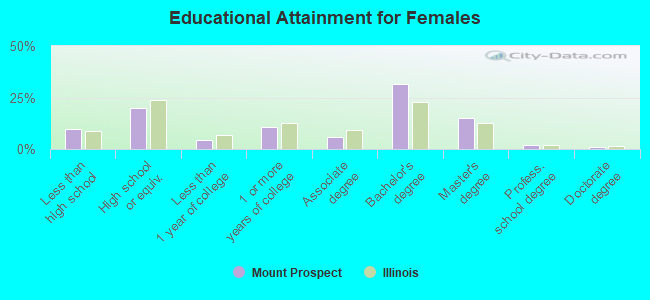
Education attainment for females 25 years and older:
No schooling: 753Nursery to 4th grade: 445th and 6th grade: 3317th and 8th grade: 1339th grade: 16910th grade: 12811th grade: 12612th grade, no diploma: 332High school graduate (or equivalency): 4,107Less than 1 year of college: 917Some college more than 1 year, no degree: 2,186Associate degree: 1,204Bachelor's degree: 6,447Master's degree: 3,079Professional school degree: 408Doctorate degree: 178
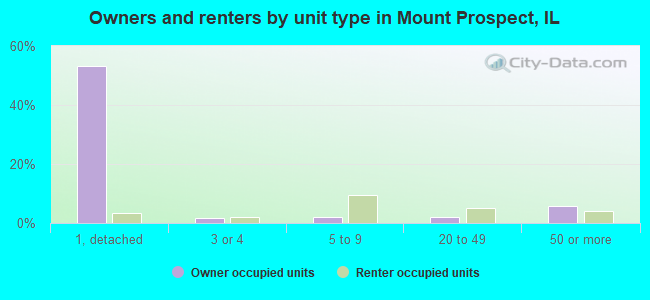
Housing units in structures:
One, detached: 13,225One, attached: 772Two: 1923 or 4: 5575 to 9: 2,38610 to 19: 2,18120 to 49: 1,62350 or more: 2,147Mobile homes: 19Boats, RVs, vans, etc.: 27Housing units lacking complete plumbing facilities in 2022: 0.7%Housing units lacking complete kitchen facilities in 2022: 0.4%House/condo owner moved in on average 16 years ago
Renter moved in on average 1 years ago
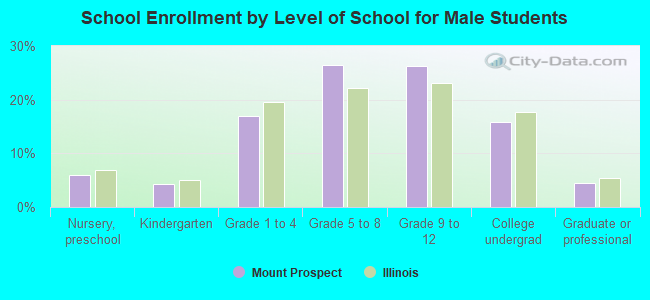
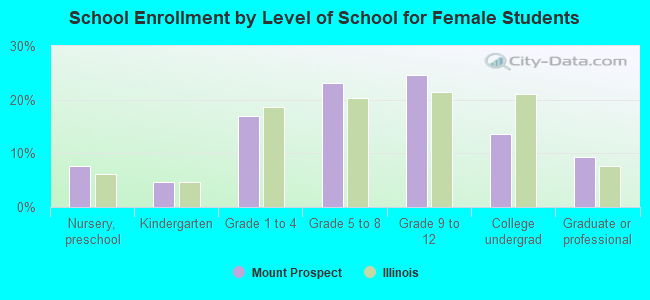
Private vs. public school enrollment:
Students in private schools in grades 1 to 8 (elementary and middle school): 489 Students in private schools in grades 9 to 12 (high school): 86 Students in private undergraduate colleges: 508