Mount Rainier, MD (Maryland) Houses and Residents
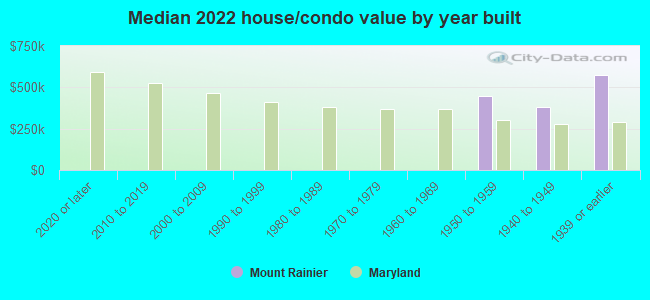
| Mount Rainier: | $537,873 |
| Maryland: | $398,100 |
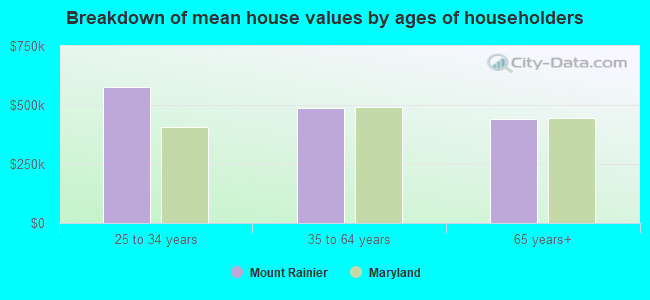
Mean price in 2022:
Detached houses: $492,564
Here: $492,564 State: $526,819 Townhouses or other attached units: $404,066
Here: $404,066 State: $328,305
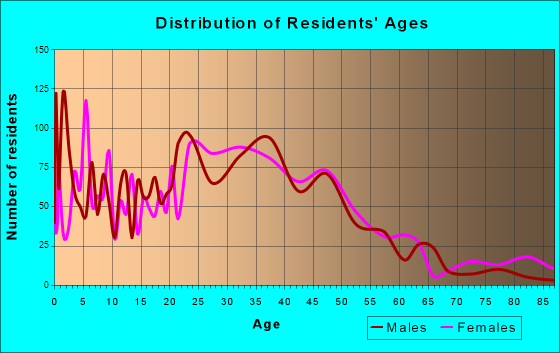
Total population: 8,430 (All urban)
Houses: 4,330 (4,208 occupied: 1,076 owner occupied, 3,151 renter occupied)
| % of renters here: | 75% |
| State: | 32% |
Housing density: 6,644 houses/condos per square mile
Median price asked for vacant for-sale houses and condos in 2022 in this county: $422,373.
Median contract rent in 2022: $1,252 (lower quartile is $1,085, upper quartile is $1,439)
Median rent asked for vacant for-rent units in 2022: $1,751
Median gross rent in Mount Rainier, MD in 2022: $1,351
Housing units in Mount Rainier with a mortgage: 811 (43 second mortgage, 0 home equity loan, 46 both second mortgage and home equity loan)
Houses without a mortgage: 0
Median household income for houses/condos with a mortgage: $109,149
Median household income for apartments without a mortgage: $61,192
Median monthly housing costs: $1,352
Compare current foreclosures near Mount Rainier, MD:
| Photo | Address | Area | Beds / Baths | Price | Details |
|---|---|---|---|---|---|

|
#1
Upshur St
Mount Rainier, MD 20712
|
992 sq. feet
|
2 baths - beds |
show details | |

|
#2
Upshur St
Mount Rainier, MD 20712
|
1,014 sq. feet
|
1 baths - beds |
show details | |

|
#3
32nd St
Mount Rainier, MD 20712
|
1,284 sq. feet
|
1 baths - beds |
show details | |

|
#4
30th St
Mount Rainier, MD 20712
|
1,916 sq. feet
|
2 baths - beds |
show details | |

|
#5
Bunker Hill Rd
Mount Rainier, MD 20712
|
929 sq. feet
|
1 baths - beds |
show details | |

|
#6
28th St
Mount Rainier, MD 20712
|
1,352 sq. feet
|
2 baths - beds |
show details | |

|
#7
30th St
Mount Rainier, MD 20712
|
1,790 sq. feet
|
2 baths - beds |
show details | |

|
#8
Eastern Ave
Mount Rainier, MD 20712
|
- sq. feet
|
- baths - beds |
show details | |

|
#9
Varnum St
Mount Rainier, MD 20712
|
- sq. feet
|
- baths - beds |
show details | |

|
#10
Carousel Ct
Upper Marlboro, MD 20772
|
2,112 sq. feet
|
2 baths 3 beds |
$412,000
|
show details |
| Photo | Address | Area | Beds / Baths | Price | Details |
|---|---|---|---|---|---|

|
#11
17th St NW Apt 504
Washington, DC 20009
|
800 sq. feet
|
1 baths 1 beds |
$419,900
|
show details |

|
#12
Pooks Hill Rd Apt 1612s
Bethesda, MD 20814
|
1,250 sq. feet
|
1 baths 2 beds |
$289,000
|
show details |

|
#13
Addison Rd
Capitol Heights, MD 20743
|
1,400 sq. feet
|
1 baths 3 beds |
$260,000
|
show details |

|
#14
Interlachen Dr Apt 111
Silver Spring, MD 20906
|
965 sq. feet
|
1 baths 2 beds |
$148,000
|
show details |

|
#15
Heming Ln
Bowie, MD 20716
|
1,800 sq. feet
|
2 baths 3 beds |
$400,000
|
show details |

|
#16
Cathedral Ave NW Apt 108
Washington, DC 20016
|
765 sq. feet
|
1 baths 1 beds |
$279,900
|
show details |

|
#17
Whistling Duck Dr
Upper Marlboro, MD 20774
|
1,740 sq. feet
|
2 baths 3 beds |
$389,500
|
show details |

|
#18
Hammersmith Cir
Silver Spring, MD 20906
|
1,152 sq. feet
|
1 baths 3 beds |
$353,600
|
show details |

|
#19
Eastern Ave NE
Washington, DC 20011
|
1,024 sq. feet
|
1 baths 3 beds |
$395,000
|
show details |

|
#20
Parkside Dr
Bowie, MD 20721
|
5,066 sq. feet
|
2 baths 5 beds |
$780,000
|
show details |
| Photo | Address | Area | Beds / Baths | Price | Details |
|---|---|---|---|---|---|

|
#21
Gladys Retreat Cir
Bowie, MD 20720
|
2,880 sq. feet
|
3 baths 3 beds |
$409,900
|
show details |

|
#22
19th St NW
Washington, DC 20036
|
2,515 sq. feet
|
6 baths 8 beds |
$1,684,800
|
show details |

|
#23
Old Fort Rd
Fort Washington, MD 20744
|
721 sq. feet
|
1 baths 2 beds |
$179,900
|
show details |

|
#24
Pickett Dr
Suitland, MD 20746
|
1,296 sq. feet
|
1 baths 2 beds |
$358,900
|
show details |

|
#25
Delaware Ave SW Apt N720
Washington, DC 20024
|
- sq. feet
|
1 baths 1 beds |
$155,000
|
show details |

|
#26
T St SE Apt 3
Washington, DC 20020
|
- sq. feet
|
2 baths 4 beds |
$339,900
|
show details |

|
#27
Willow Leaf Ct
Odenton, MD 21113
|
1,476 sq. feet
|
2 baths 2 beds |
show details | |

|
#28
4th St NE Apt 2
Washington, DC 20002
|
1,061 sq. feet
|
2 baths 2 beds |
show details | |

|
#29
Rugged Ln
Capitol Heights, MD 20743
|
- sq. feet
|
3 baths 4 beds |
show details | |

|
#30
S Arbory Ln
Laurel, MD 20707
|
1,283 sq. feet
|
3 baths 3 beds |
show details |
| Photo | Address | Area | Beds / Baths | Price | Details |
|---|---|---|---|---|---|

|
#31
Norge Ct
Bowie, MD 20716
|
1,160 sq. feet
|
1 baths 3 beds |
show details | |

|
#32
Aquarius Ave
Silver Spring, MD 20906
|
1,407 sq. feet
|
2 baths 4 beds |
show details | |

|
#33
Pearl Fog Way
Dunn Loring, VA 22027
|
3,356 sq. feet
|
4 baths 4 beds |
show details | |

|
#34
Connecticut Ave NW Apt 606
Washington, DC 20008
|
160 sq. feet
|
1 baths 1 beds |
show details | |

|
#35
Dennington Dr
Bowie, MD 20721
|
4,164 sq. feet
|
2 baths 4 beds |
show details | |

|
#36
Windbreak Dr
Alexandria, VA 22306
|
1,360 sq. feet
|
3 baths 3 beds |
show details | |

|
#37
English Ct
Suitland, MD 20746
|
1,296 sq. feet
|
2 baths 3 beds |
show details | |

|
#38
Trent St
Clinton, MD 20735
|
1,080 sq. feet
|
2 baths 3 beds |
show details | |

|
#39
Peppertree Ln
Silver Spring, MD 20906
|
1,309 sq. feet
|
2 baths 3 beds |
show details | |

|
#40
Secretariat Dr
Bowie, MD 20721
|
3,050 sq. feet
|
4 baths 5 beds |
show details |
| Photo | Address | Area | Beds / Baths | Price | Details |
|---|---|---|---|---|---|

|
#41
Tayack Pl Unit 203
Alexandria, VA 22312
|
1,322 sq. feet
|
2 baths 2 beds |
show details | |

|
#42
Clovis Ave
Capitol Heights, MD 20743
|
952 sq. feet
|
1 baths 3 beds |
show details | |

|
#43
1918 M Street NE
Washington, DC 20002
|
5,487 sq. feet
|
12 baths 18 beds |
show details | |

|
#44
Arbroath Dr
Clinton, MD 20735
|
1,432 sq. feet
|
2 baths 3 beds |
show details | |

|
#45
Cathedral Ave NW Apt 404w
Washington, DC 20016
|
803 sq. feet
|
1 baths 1 beds |
show details | |

|
#46
New Mark Esplanade
Rockville, MD 20850
|
1,428 sq. feet
|
3 baths 2 beds |
show details | |

|
#47
Lee Landing Dr
Falls Church, VA 22043
|
900 sq. feet
|
1 baths 2 beds |
show details | |

|
#48
Southern Ave SE
Washington, DC 20019
|
1,024 sq. feet
|
1 baths 3 beds |
show details | |

|
#49
Sutton Ct
Upper Marlboro, MD 20774
|
1,546 sq. feet
|
3 baths 5 beds |
show details | |

|
Check over 1 million property listings on Foreclosure.com!
|
browse all offers | |||


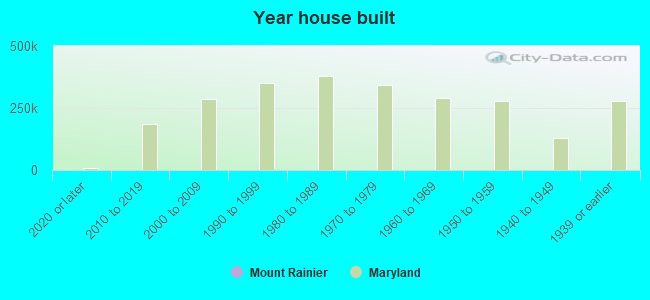
Median year apartment built: 1958
Household type by relationship:
Households: 8,173- Male householders: 1,955 (981 living alone), Female householders: 2,152 (1,110 living alone)
1,272 spouses (1,261 opposite-sex spouses), 169 unmarried partners, (141 opposite-sex unmarried partners), 2,088 children (1,871 natural, 0 adopted, 216 stepchildren), 105 grandchildren, 62 brothers or sisters, 12 parents, 37 foster children, 165 other relatives, 129 non-relatives
- In group quarters: 21
Size of family households: 848 2-persons, 565 3-persons, 300 4-persons, 192 5-persons, 32 6-persons, 36 7-or-more-persons.
Size of nonfamily households: 2,058 1-person, 145 2-persons.
1,039 married couples with children.
429 single-parent households (118 men, 311 women).
54.6% of residents of Mount Rainier speak English at home.
36.3% of residents speak Spanish at home (47% speak English very well, 22% speak English well, 16% speak English not well, 16% don't speak English at all).
4.7% of residents speak other Indo-European language at home (79% speak English very well, 1% speak English well, 20% speak English not well).
1.4% of residents speak Asian or Pacific Island language at home (76% speak English very well, 9% speak English well, 14% speak English not well).
3.2% of residents speak other language at home (62% speak English very well, 38% speak English well).
Foreign born population: 3,023 (37.0%)
(47.3% of them are naturalized citizens)
| Here: | 6.1 |
| State: | 7.3 |
| Here: | 3.4 |
| State: | 4.2 |
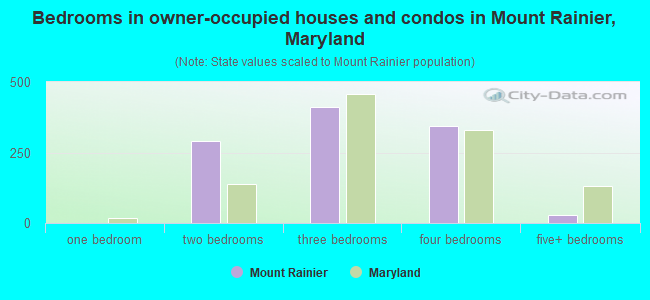
- Bedrooms in owner-occupied houses and condos in Mount Rainier, Maryland
- 0no bedroom
- 01 bedroom
- 2922 bedrooms
- 4133 bedrooms
- 3434 bedrooms
- 275+ bedrooms
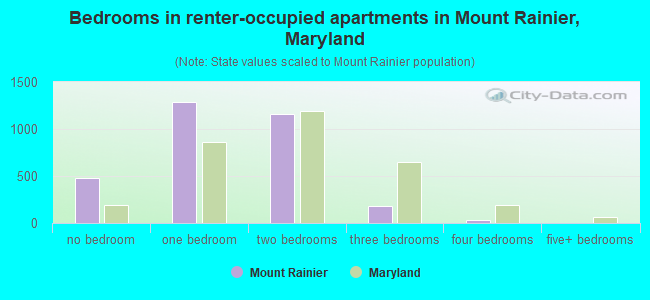
- Bedrooms in renter-occupied apartments in Mount Rainier, Maryland
- 482no bedroom
- 1,2901 bedroom
- 1,1612 bedrooms
- 1843 bedrooms
- 364 bedrooms
- 05+ bedrooms
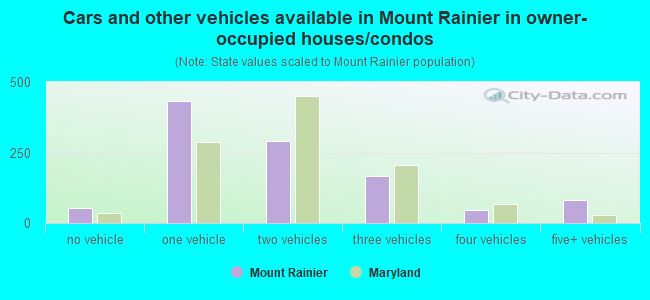
- Cars and other vehicles available in Mount Rainier in owner-occupied houses/condos
- 54no vehicle
- 4341 vehicle
- 2902 vehicles
- 1683 vehicles
- 474 vehicles
- 835+ vehicles
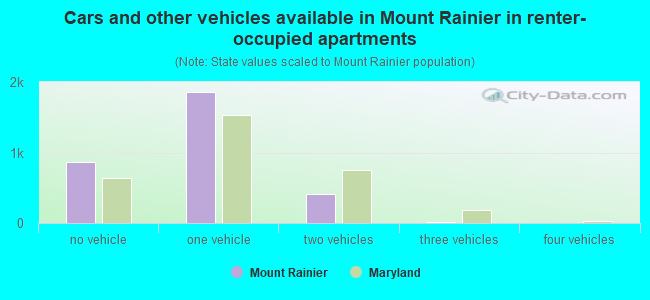
- Cars and other vehicles available in Mount Rainier in renter-occupied apartments
- 866no vehicle
- 1,8571 vehicle
- 4152 vehicles
- 133 vehicles
- 04 vehicles
- 05+ vehicles
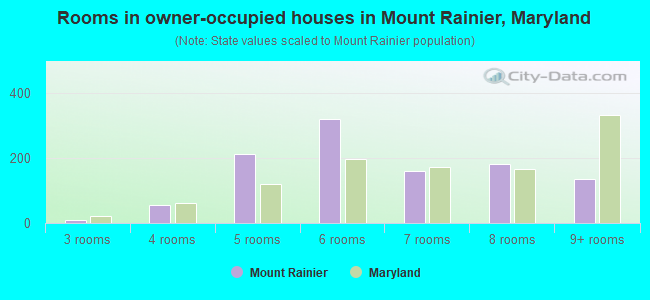
- Rooms in owner-occupied houses in Mount Rainier, Maryland
- 01 room
- 02 rooms
- 103 rooms
- 564 rooms
- 2125 rooms
- 3206 rooms
- 1617 rooms
- 1818 rooms
- 1369+ rooms
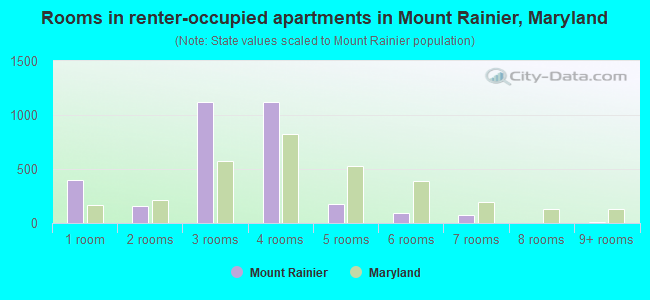
- Rooms in renter-occupied apartments in Mount Rainier, Maryland
- 3981 room
- 1552 rooms
- 1,1253 rooms
- 1,1214 rooms
- 1775 rooms
- 936 rooms
- 737 rooms
- 08 rooms
- 109+ rooms
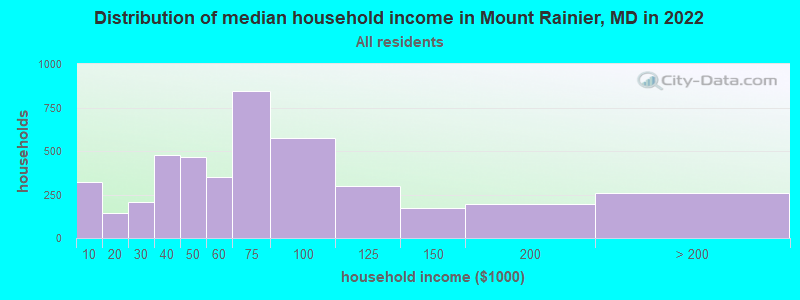
Mount Rainier, MD household income distribution

- 322Less than $10,000
- 146$10,000 to $19,999
- 207$20,000 to $29,999
- 475$30,000 to $39,999
- 463$40,000 to $49,999
- 351$50,000 to $59,999
- 847$60,000 to $74,999
- 575$75,000 to $99,999
- 298$100,000 to $124,999
- 173$125,000 to $149,999
- 193$150,000 to $199,999
- 256$200,000 or more
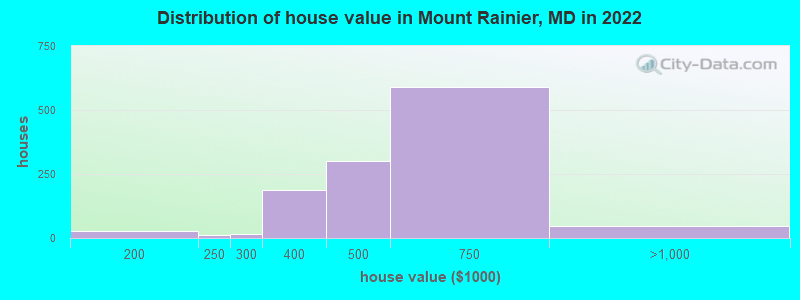
Home value of owner - occupied houses in 2022 in Mount Rainier, MD
-
- 28$175,000 to $199,999
- 12$200,000 to $249,999
- 15$250,000 to $299,999
- 185$300,000 to $399,999
- 299$400,000 to $499,999
- 588$500,000 to $749,999
- 45$750,000 to $999,999
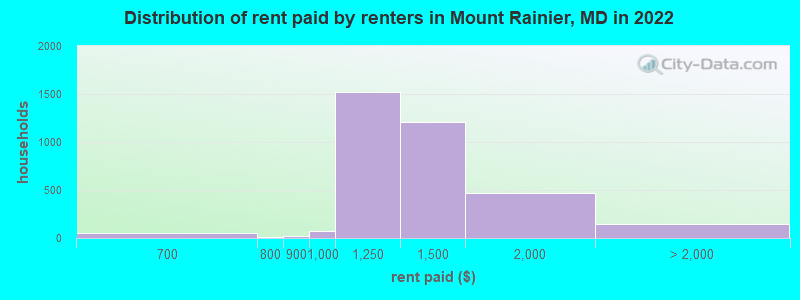
Rent paid by renters in 2022 in Mount Rainier, MD
-
- 55$650 to $699
- 14$750 to $799
- 24$800 to $899
- 68$900 to $999
- 1,518$1,000 to $1,249
- 1,210$1,250 to $1,499
- 468$1,500 to $1,999
- 65$2,000 to $2,499
- 3$2,500 to $2,999
- 77No cash rent
Percentage of workers working in this county: 41.0%
Number of people working at home: 869 (18.3% of all workers)
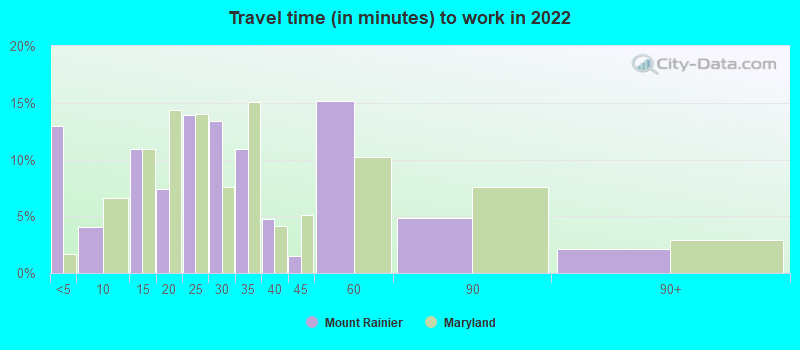
Travel time to work (commute)
- Less than 5 minutes: 206
- 5 to 9 minutes: 76
- 10 to 14 minutes: 278
- 15 to 19 minutes: 582
- 20 to 24 minutes: 403
- 25 to 29 minutes: 436
- 30 to 34 minutes: 699
- 35 to 39 minutes: 182
- 40 to 44 minutes: 148
- 45 to 59 minutes: 440
- 60 to 89 minutes: 275
- 90 or more minutes: 154
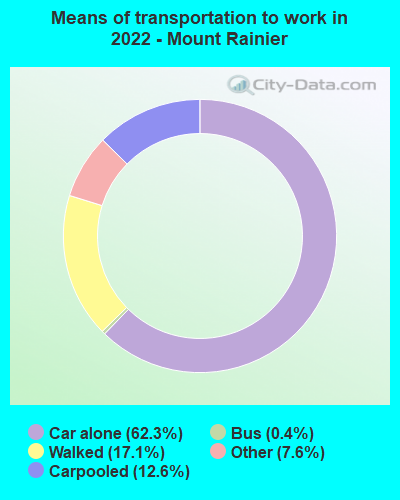
Means of transportation to work:
- Drove a car alone: 514 (33.6%)
- Carpooled: 94 (6.1%)
- Bus: 2 (0.1%)
- Taxi: 80 (5.2%)
- Walked: 140 (9.1%)
- Worked at home: 869 (56.8%)
- Unemployment by race in 2022
- Unemployment rate for White non-Hispanic residents
- 2.3%Males
- Unemployment rate for Black residents
- 8.9%Males
- 0.7%Females
- Unemployment rate for other race residents
- 4.0%Females
- Unemployment rate for two or more race residents
- 5.0%Females
- Unemployment rate for Hispanic or Latino residents
- 2.2%Males
- 3.9%Females
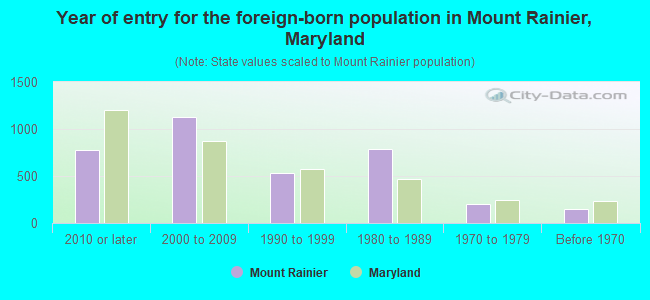
- Year of entry for the foreign-born population in Mount Rainier, Maryland
- 7762010 or later
- 1,1252000 to 2009
- 5351990 to 1999
- 7901980 to 1989
- 2011970 to 1979
- 154Before 1970
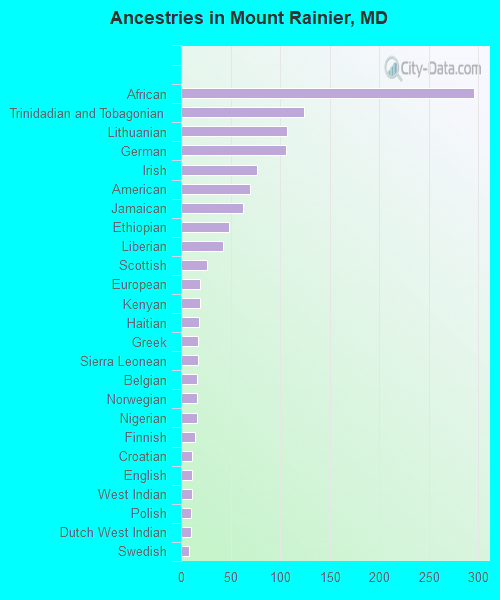
First ancestries reported:
- African: 296 (5.3%)
- Trinidadian and Tobagonian: 124 (2.2%)
- Lithuanian: 107 (1.9%)
- German: 106 (1.9%)
- Irish: 77 (1.4%)
- American: 70 (1.2%)
- Jamaican: 63 (1.1%)
- Ethiopian: 48 (0.9%)
- Liberian: 42 (0.7%)
- Scottish: 26 (0.5%)
- European: 19 (0.3%)
- Kenyan: 19 (0.3%)
- Haitian: 18 (0.3%)
- Greek: 17 (0.3%)
- Sierra Leonean: 17 (0.3%)
- Belgian: 16 (0.3%)
- Norwegian: 16 (0.3%)
- Nigerian: 16 (0.3%)
- Finnish: 14 (0.2%)
- Croatian: 11 (0.2%)
- English: 11 (0.2%)
- West Indian: 11 (0.2%)
- Polish: 10 (0.2%)
- Dutch West Indian: 10 (0.2%)
- Swedish: 8 (0.1%)
- Scotch-Irish: 4 (0.07%)
Most common places of birth for foreign-born residents (%):
| Mount Rainier: | 30.4% (905) |
| Maryland: | 12.0% (115,412) |
| Mount Rainier: | 10.7% (319) |
| Maryland: | 4.4% (42,350) |
| Mount Rainier: | 9.9% (294) |
| Maryland: | 2.5% (24,026) |
| Mount Rainier: | 7.4% (220) |
| Maryland: | 1.4% (13,947) |
| Mount Rainier: | 5.0% (150) |
| Maryland: | 1.3% (12,898) |
| Mount Rainier: | 4.0% (119) |
| Maryland: | 1.2% (11,481) |
| Mount Rainier: | 3.1% (92) |
| Maryland: | 0.3% (2,915) |
| Mount Rainier: | 2.7% (80) |
| Maryland: | 2.5% (23,969) |
| Mount Rainier: | 2.6% (77) |
| Maryland: | 1.1% (10,233) |
| Mount Rainier: | 2.4% (71) |
| Maryland: | 0.1% (916) |
| Mount Rainier: | 1.9% (56) |
| Maryland: | 0.3% (2,547) |
| Mount Rainier: | 1.8% (53) |
| Maryland: | 3.5% (34,065) |
| Mount Rainier: | 1.5% (45) |
| Maryland: | 0.8% (7,497) |
Place of birth for U.S.-born residents:
- This state: 915
- Other state: 4,015
- Northeast: 672
- Midwest: 444
- South: 2,610
- West: 359
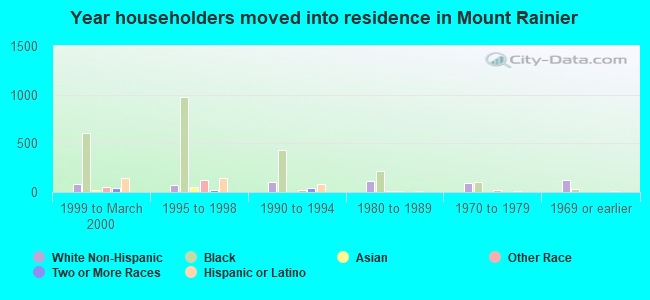
87.8% of Mount Rainier residents lived in the same house 1 years ago.
Out of people who lived in different houses, 38.2% lived in this county.
Out of people who lived in different counties, 33.2% lived in Maryland.
| Mount Rainier: | 87.8% |
| State average: | 88.5% |
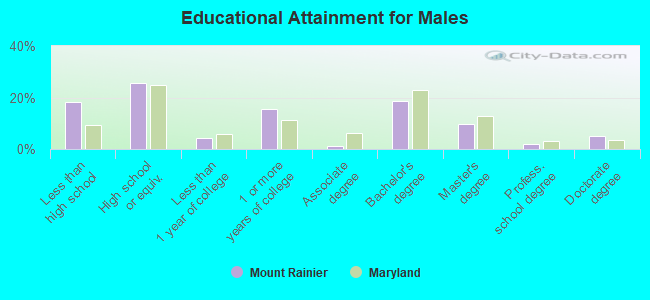
Education attainment for males 25 years and older:
- No schooling: 61
- Nursery to 4th grade: 53
- 5th and 6th grade: 81
- 7th and 8th grade: 211
- 9th grade: 16
- 10th grade: 12
- 11th grade: 65
- 12th grade, no diploma: 40
- High school graduate (or equivalency): 755
- Less than 1 year of college: 127
- Some college more than 1 year, no degree: 462
- Associate degree: 40
- Bachelor's degree: 548
- Master's degree: 288
- Professional school degree: 54
- Doctorate degree: 144
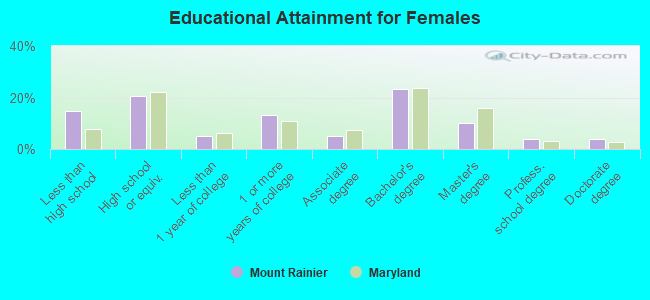
Education attainment for females 25 years and older:
- No schooling: 50
- Nursery to 4th grade: 30
- 5th and 6th grade: 52
- 7th and 8th grade: 108
- 9th grade: 65
- 10th grade: 66
- 11th grade: 20
- 12th grade, no diploma: 50
- High school graduate (or equivalency): 623
- Less than 1 year of college: 150
- Some college more than 1 year, no degree: 404
- Associate degree: 147
- Bachelor's degree: 709
- Master's degree: 309
- Professional school degree: 116
- Doctorate degree: 123
Housing units in structures:
- One, detached: 1,222
- One, attached: 58
- Two: 14
- 3 or 4: 716
- 5 to 9: 1,592
- 10 to 19: 456
- 20 to 49: 124
- 50 or more: 145
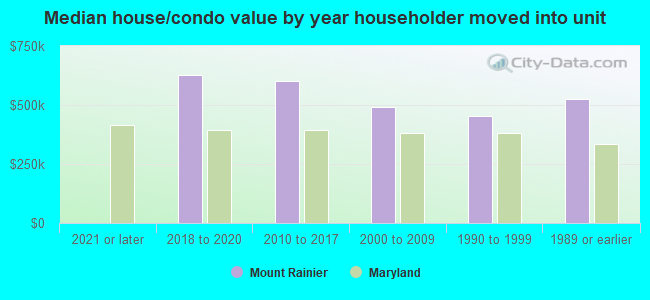
House/condo owner moved in on average 15 years ago
Renter moved in on average 5 years ago
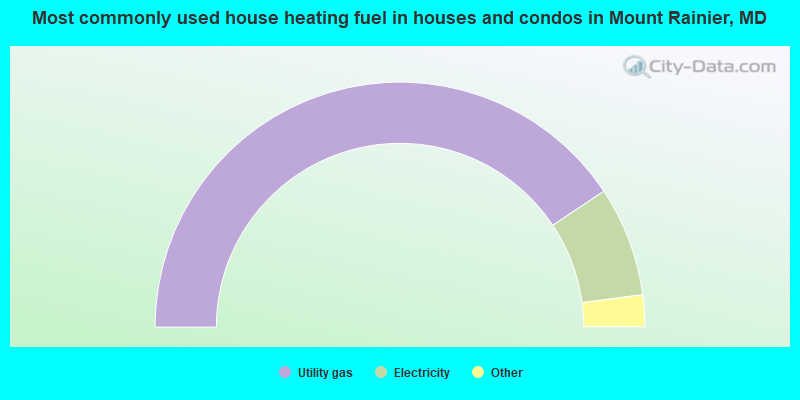
- 81.4%Utility gas
- 14.5%Electricity
- 2.4%Fuel oil, kerosene, etc.
- 1.8%Bottled, tank, or LP gas
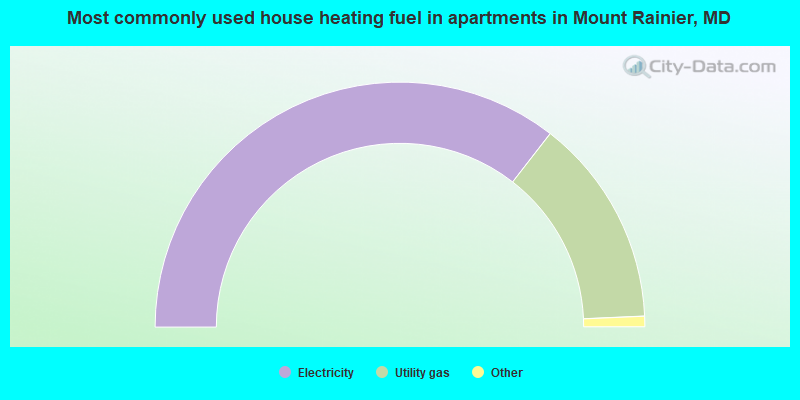
- 71.1%Electricity
- 27.6%Utility gas
- 0.9%Bottled, tank, or LP gas
- 0.4%No fuel used
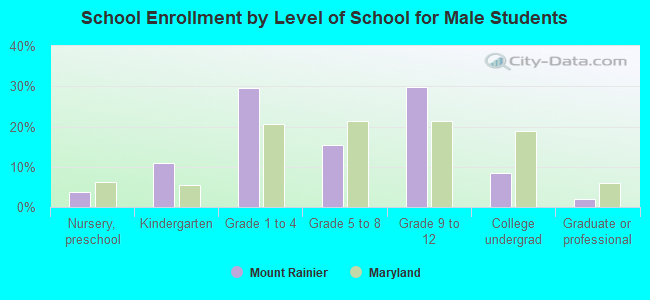
Private vs. public school enrollment:
| Here: | 7.0% |
| Maryland: | 15.2% |
| Here: | 23.7% |
| Maryland: | 14.4% |
| Here: | 36.6% |
| Maryland: | 20.2% |