Mount Washington, KY (Kentucky) Houses and Residents
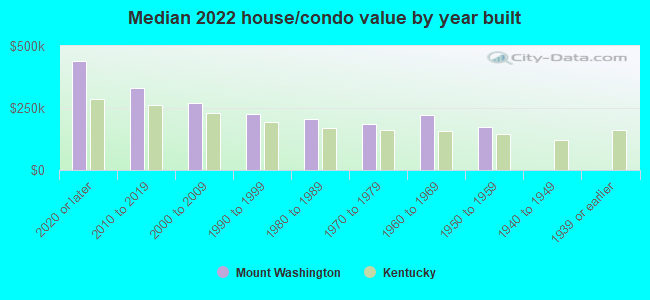
| Mount Washington: | $260,262 |
| Kentucky: | $196,300 |
Mean price in 2022:
Detached houses: $275,874
Here: $275,874 State: $256,452 Townhouses or other attached units: $199,455
Here: $199,455 State: $264,090 In 3-to-4-unit structures: $182,717
Here: $182,717 State: $169,074 In 5-or-more-unit structures: $495,820
Here: $495,820 State: $245,174 Mobile homes: $12,668
Here: $12,668 State: $84,635
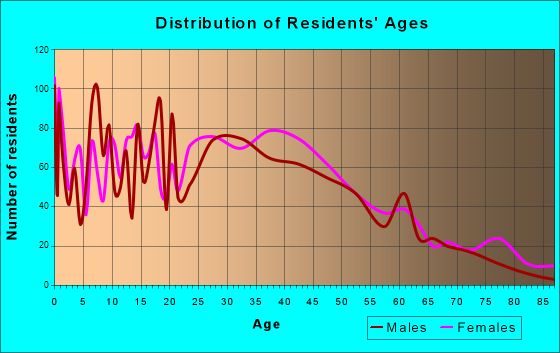
Total population: 12,246 (Urban population: 8,355, Rural population: 133 (all nonfarm))
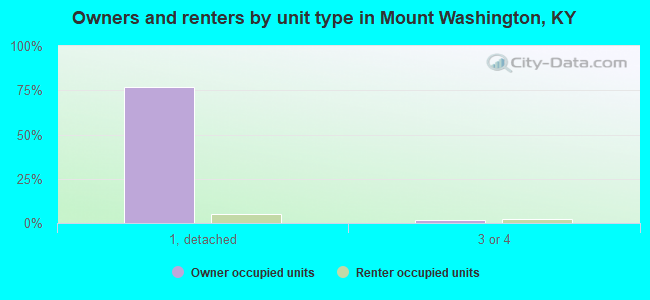
Houses: 7,188 (6,849 occupied: 5,991 owner occupied, 956 renter occupied)
| % of renters here: | 14% |
| State: | 31% |
Housing density: 1,346 houses/condos per square mile
Median price asked for vacant for-sale houses and condos in 2022: $271,358.
Median contract rent in 2022: $707 (lower quartile is $581, upper quartile is $868)
Median rent asked for vacant for-rent units in 2022: $1,387
Median gross rent in Mount Washington, KY in 2022: $827
Housing units in Mount Washington with a mortgage: 4,570 (514 second mortgage, 30 home equity loan, 357 both second mortgage and home equity loan)
Houses without a mortgage: 57
Median household income for houses/condos with a mortgage: $105,980
Median household income for apartments without a mortgage: $59,861
Median monthly housing costs: $1,244
Compare current foreclosures in Mount Washington, KY:
| Photo | Address | Area | Beds / Baths | Price | Details |
|---|---|---|---|---|---|

|
#1
E Woodlake Cir
Mount Washington, KY 40047
|
1,728 sq. feet
|
2 baths 3 beds |
show details | |

|
#2
Fairway Dr
Mount Washington, KY 40047
|
1,630 sq. feet
|
2 baths 3 beds |
show details | |

|
#3
Scenic View Dr
Mount Washington, KY 40047
|
2,044 sq. feet
|
2 baths 4 beds |
show details | |

|
#4
Fisher Ln
Mount Washington, KY 40047
|
1,290 sq. feet
|
1 baths 3 beds |
show details | |

|
#5
Forest Ridge Dr
Mount Washington, KY 40047
|
1,262 sq. feet
|
2 baths 3 beds |
show details | |

|
#6
Forest Ridge Dr
Mount Washington, KY 40047
|
1,230 sq. feet
|
2 baths 3 beds |
show details | |

|
#7
Boaz Ln
Mount Washington, KY 40047
|
2,002 sq. feet
|
2 baths 3 beds |
show details | |

|
#8
Central Blvd Apt 36
Mount Washington, KY 40047
|
1,070 sq. feet
|
2 baths 2 beds |
show details | |

|
#9
Flatlick Rd
Mount Washington, KY 40047
|
1,100 sq. feet
|
1 baths 3 beds |
show details | |

|
#10
Forest Ridge Dr
Mount Washington, KY 40047
|
1,169 sq. feet
|
2 baths 3 beds |
show details |
| Photo | Address | Area | Beds / Baths | Price | Details |
|---|---|---|---|---|---|

|
#11
Lentz Ln
Mount Washington, KY 40047
|
1,032 sq. feet
|
2 baths 3 beds |
show details | |

|
#12
Mark Ave
Mount Washington, KY 40047
|
1,053 sq. feet
|
1 baths 3 beds |
show details | |

|
#13
Probus Dr
Mount Washington, KY 40047
|
1,050 sq. feet
|
1 baths 3 beds |
show details | |

|
#14
Fairway Dr
Mount Washington, KY 40047
|
1,638 sq. feet
|
2 baths 3 beds |
show details | |

|
#15
Stone Creek Ct
Mount Washington, KY 40047
|
1,262 sq. feet
|
2 baths 3 beds |
show details | |

|
#16
Cherry Hill Pkwy
Mount Washington, KY 40047
|
2,796 sq. feet
|
3 baths 4 beds |
show details | |

|
#17
Louise Way # 16
Mount Washington, KY 40047
|
1,497 sq. feet
|
2 baths 3 beds |
show details | |

|
#18
Central Blvd Apt 30
Mount Washington, KY 40047
|
925 sq. feet
|
2 baths 2 beds |
show details | |

|
#19
Flatlick Rd
Mount Washington, KY 40047
|
1,000 sq. feet
|
1 baths 3 beds |
show details | |

|
#20
Helmwood Cir
Mount Washington, KY 40047
|
2,588 sq. feet
|
2 baths 4 beds |
show details |
| Photo | Address | Area | Beds / Baths | Price | Details |
|---|---|---|---|---|---|

|
#21
Berger Farm Dr
Mount Washington, KY 40047
|
- sq. feet
|
- baths - beds |
show details | |

|
#22
Blue Ridge Cir
Mount Washington, KY 40047
|
- sq. feet
|
- baths - beds |
show details | |

|
#23
Newman Way
Mount Washington, KY 40047
|
1,856 sq. feet
|
- baths - beds |
show details | |

|
#24
Waterford Rd
Mount Washington, KY 40047
|
- sq. feet
|
- baths - beds |
show details | |

|
#25
Coldstream Ct
Mount Washington, KY 40047
|
- sq. feet
|
- baths - beds |
show details | |

|
#26
Greenbriar Rd
Mount Washington, KY 40047
|
1,050 sq. feet
|
- baths - beds |
show details | |

|
#27
Meadow Park Ct
Mount Washington, KY 40047
|
- sq. feet
|
- baths - beds |
show details | |

|
#28
Berger Farm Dr
Mount Washington, KY 40047
|
- sq. feet
|
- baths - beds |
show details | |

|
#29
Pond Creek Ct
Mount Washington, KY 40047
|
- sq. feet
|
- baths - beds |
show details | |

|
#30
Elliot Avenue, Apartment 5
Mount Washington, KY 40047
|
- sq. feet
|
- baths - beds |
show details |
| Photo | Address | Area | Beds / Baths | Price | Details |
|---|---|---|---|---|---|

|
#31
Aulbern Dr W
Mount Washington, KY 40047
|
- sq. feet
|
- baths - beds |
show details | |

|
#32
Harding Dr
Mount Washington, KY 40047
|
1,377 sq. feet
|
- baths - beds |
show details | |

|
#33
Ruby Farm Dr
Mount Washington, KY 40047
|
- sq. feet
|
- baths - beds |
show details | |

|
#34
N Canterbury Dr
Mount Washington, KY 40047
|
- sq. feet
|
- baths - beds |
show details | |

|
#35
Landis Ln Lot No146
Mount Washington, KY 40047
|
- sq. feet
|
- baths - beds |
show details | |

|
#36
Farmview Dr
Mount Washington, KY 40047
|
1,392 sq. feet
|
- baths - beds |
show details | |

|
#37
Copper Creek Dr
Mount Washington, KY 40047
|
- sq. feet
|
- baths - beds |
show details | |

|
#38
Treva Ct # 4
Mount Washington, KY 40047
|
- sq. feet
|
- baths - beds |
show details | |

|
#39
Oak Creek Dr
Mount Washington, KY 40047
|
- sq. feet
|
- baths - beds |
show details | |

|
#40
Landis Ln Apt 74
Mount Washington, KY 40047
|
- sq. feet
|
- baths - beds |
show details |
| Photo | Address | Area | Beds / Baths | Price | Details |
|---|---|---|---|---|---|

|
#41
Park Hill Ln Apt 203
Mount Washington, KY 40047
|
- sq. feet
|
- baths - beds |
show details | |

|
#42
Fallen Branch Ct
Mount Washington, KY 40047
|
- sq. feet
|
- baths - beds |
show details | |

|
#43
Hubbards Landing Blvd
Mount Washington, KY 40047
|
- sq. feet
|
- baths - beds |
show details | |

|
#44
Sunday Silence Dr
Mount Washington, KY 40047
|
1,592 sq. feet
|
- baths - beds |
show details | |

|
#45
Simmons Ln
Mount Washington, KY 40047
|
1,028 sq. feet
|
- baths - beds |
show details | |

|
#46
Harding Dr
Mount Washington, KY 40047
|
1,286 sq. feet
|
- baths - beds |
show details | |

|
#47
Biliken Ct
Mount Washington, KY 40047
|
- sq. feet
|
- baths - beds |
show details | |

|
#48
Landis Ln Lot 120
Mount Washington, KY 40047
|
- sq. feet
|
- baths - beds |
show details | |

|
#49
Elder Glen Ct
Mount Washington, KY 40047
|
- sq. feet
|
- baths - beds |
show details | |

|
Check over 1 million property listings on Foreclosure.com!
|
browse all offers | |||


 | Harvard Body parts scandal comes to Louisville (3 replies) |
| Louisville Exceeded My Expectations!! Thinking of moving.. (21 replies) |
| Pretty neighborhoods in greater Louisville area (13 replies) |
| Thinking of moving to the Louisville area - tell me why not (14 replies) |
| New Albany versus Mount Washington (27 replies) |
| Visiting in July! (27 replies) |
Median year apartment built: 1997
Household type by relationship:
Households: 18,282- Male householders: 3,336 (635 living alone), Female householders: 3,454 (1,039 living alone)
3,686 spouses (3,682 opposite-sex spouses), 394 unmarried partners, (394 opposite-sex unmarried partners), 5,925 children (5,395 natural, 140 adopted, 390 stepchildren), 205 grandchildren, 250 brothers or sisters, 351 parents, 0 foster children, 331 other relatives, 232 non-relatives
- In group quarters: 112
Size of family households: 1,796 2-persons, 1,244 3-persons, 1,151 4-persons, 834 5-persons, 164 6-persons, 91 7-or-more-persons.
Size of nonfamily households: 1,613 1-person, 181 2-persons, 3 4-persons.
3,068 married couples with children.
882 single-parent households (183 men, 699 women).
96.4% of residents of Mount Washington speak English at home.
2.3% of residents speak Spanish at home (29% speak English very well, 50% speak English well, 21% speak English not well).
0.1% of residents speak other Indo-European language at home (62% speak English very well, 38% speak English well).
0.4% of residents speak Asian or Pacific Island language at home (62% speak English very well, 38% speak English well).
0.4% of residents speak other language at home (25% speak English very well, 22% speak English well, 27% speak English not well, 25% don't speak English at all).
Foreign born population: 555 (3.0%)
(57.8% of them are naturalized citizens)
| Here: | 6.4 |
| State: | 6.4 |
| Here: | 4.5 |
| State: | 4.4 |
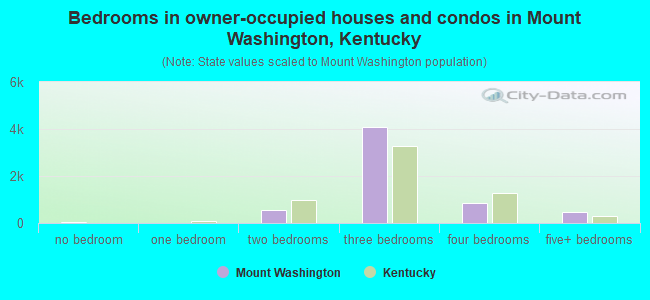
- Bedrooms in owner-occupied houses and condos in Mount Washington, Kentucky
- 38no bedroom
- 101 bedroom
- 5462 bedrooms
- 4,0813 bedrooms
- 8594 bedrooms
- 4585+ bedrooms
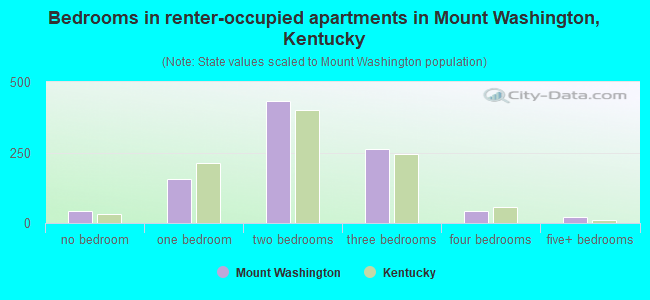
- Bedrooms in renter-occupied apartments in Mount Washington, Kentucky
- 43no bedroom
- 1551 bedroom
- 4322 bedrooms
- 2613 bedrooms
- 444 bedrooms
- 235+ bedrooms
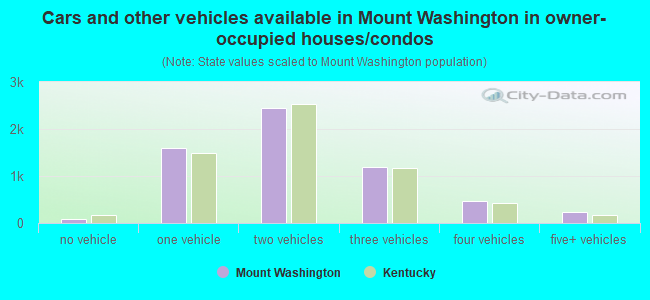
- Cars and other vehicles available in Mount Washington in owner-occupied houses/condos
- 76no vehicle
- 1,5941 vehicle
- 2,4512 vehicles
- 1,1843 vehicles
- 4584 vehicles
- 2295+ vehicles
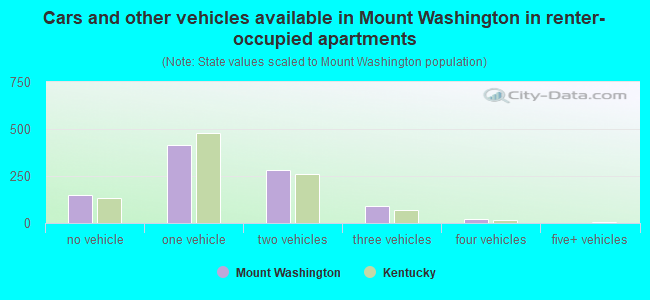
- Cars and other vehicles available in Mount Washington in renter-occupied apartments
- 149no vehicle
- 4171 vehicle
- 2802 vehicles
- 883 vehicles
- 234 vehicles
- 05+ vehicles
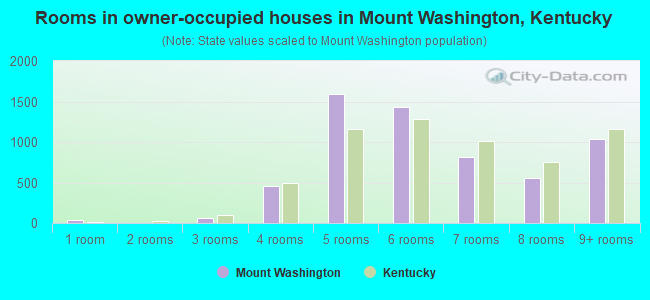
- Rooms in owner-occupied houses in Mount Washington, Kentucky
- 381 room
- 02 rooms
- 633 rooms
- 4594 rooms
- 1,5965 rooms
- 1,4386 rooms
- 8107 rooms
- 5528 rooms
- 1,0359+ rooms
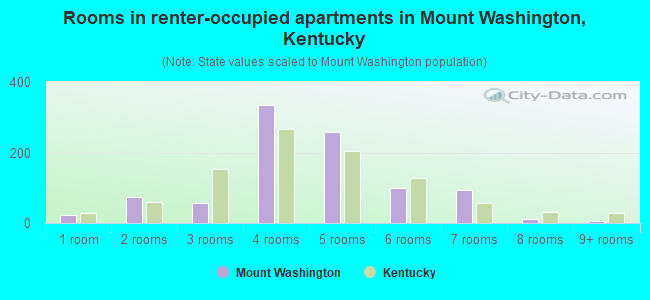
- Rooms in renter-occupied apartments in Mount Washington, Kentucky
- 231 room
- 752 rooms
- 563 rooms
- 3344 rooms
- 2585 rooms
- 996 rooms
- 957 rooms
- 108 rooms
- 79+ rooms
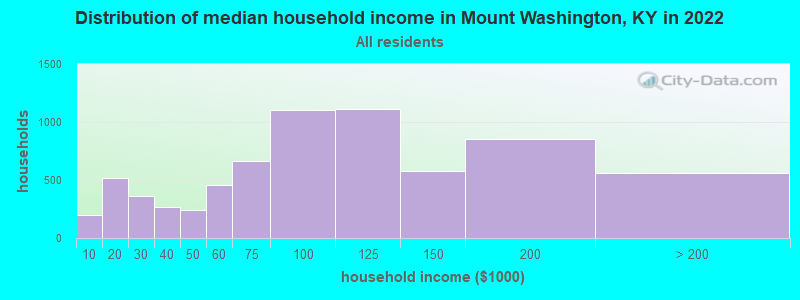
Mount Washington, KY household income distribution

- 202Less than $10,000
- 521$10,000 to $19,999
- 360$20,000 to $29,999
- 270$30,000 to $39,999
- 245$40,000 to $49,999
- 458$50,000 to $59,999
- 662$60,000 to $74,999
- 1,105$75,000 to $99,999
- 1,114$100,000 to $124,999
- 577$125,000 to $149,999
- 855$150,000 to $199,999
- 564$200,000 or more
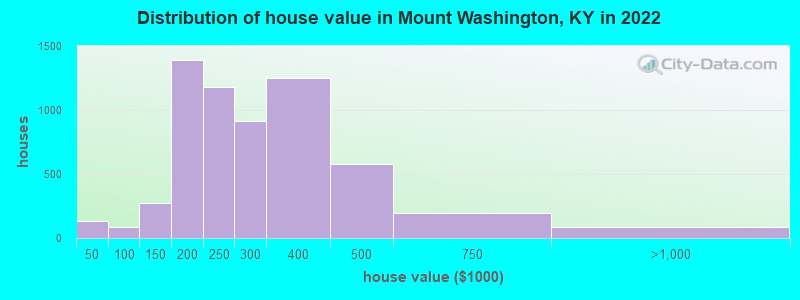
Home value of owner - occupied houses in 2022 in Mount Washington, KY
-
- 4Less than $10,000
- 33$10,000 to $14,999
- 34$15,000 to $19,999
- 26$20,000 to $24,999
- 8$25,000 to $29,999
- 18$30,000 to $34,999
- 7$40,000 to $49,999
- 48$70,000 to $79,999
- 16$80,000 to $89,999
- 14$90,000 to $99,999
- 90$100,000 to $124,999
- 182$125,000 to $149,999
- 653$150,000 to $174,999
- 739$175,000 to $199,999
- 1,182$200,000 to $249,999
- 913$250,000 to $299,999
- 1,249$300,000 to $399,999
- 578$400,000 to $499,999
- 192$500,000 to $749,999
- 88$750,000 to $999,999
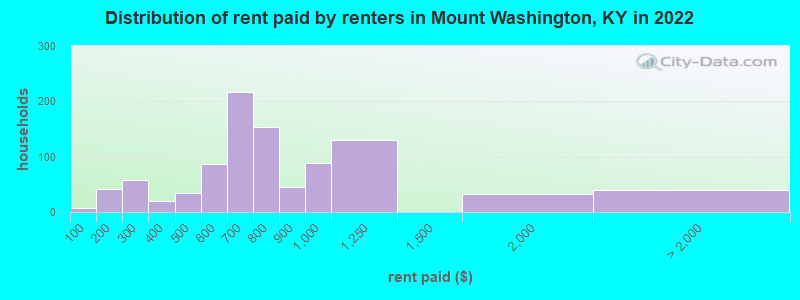
Rent paid by renters in 2022 in Mount Washington, KY
-
- 7Less than $100
- 17$100 to $149
- 24$150 to $199
- 45$200 to $249
- 11$250 to $299
- 9$300 to $349
- 9$350 to $399
- 34$400 to $449
- 50$500 to $549
- 35$550 to $599
- 134$600 to $649
- 81$650 to $699
- 69$700 to $749
- 83$750 to $799
- 44$800 to $899
- 87$900 to $999
- 131$1,000 to $1,249
- 32$1,500 to $1,999
- 8$3,500 or more
- 32No cash rent
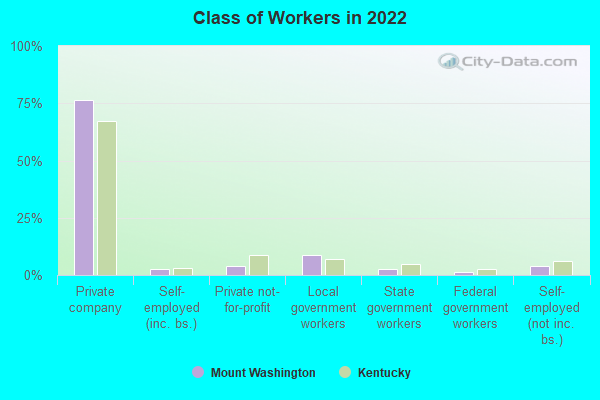
Percentage of workers working in this county: 35.6%
Number of people working at home: 1,020 (11.2% of all workers)
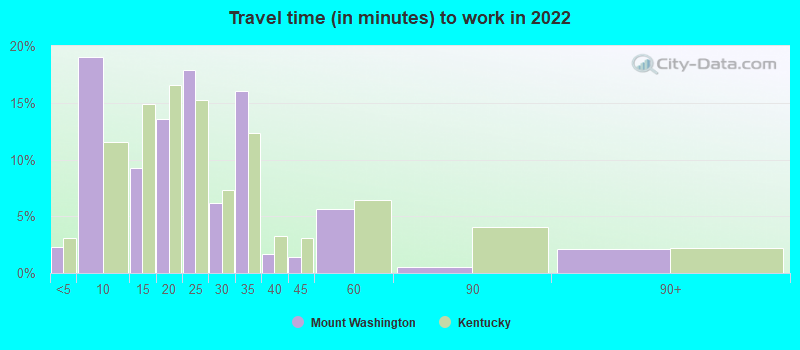
Travel time to work (commute)
- Less than 5 minutes: 45
- 5 to 9 minutes: 821
- 10 to 14 minutes: 351
- 15 to 19 minutes: 528
- 20 to 24 minutes: 813
- 25 to 29 minutes: 658
- 30 to 34 minutes: 2,016
- 35 to 39 minutes: 758
- 40 to 44 minutes: 335
- 45 to 59 minutes: 833
- 60 to 89 minutes: 332
- 90 or more minutes: 219
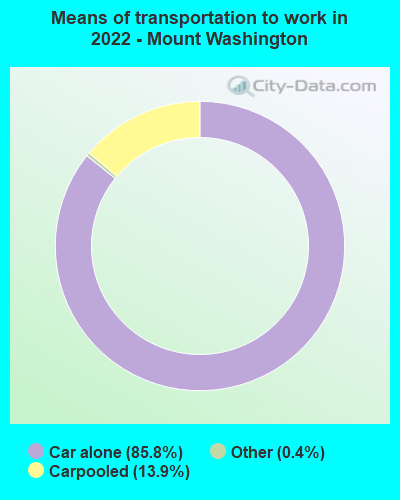
Means of transportation to work:
- Drove a car alone: 2,605 (66.4%)
- Carpooled: 463 (11.8%)
- Taxi: 14 (0.4%)
- Worked at home: 1,020 (26.0%)
- Unemployment by race in 2022
- Unemployment rate for White non-Hispanic residents
- 4.3%Males
- 3.4%Females
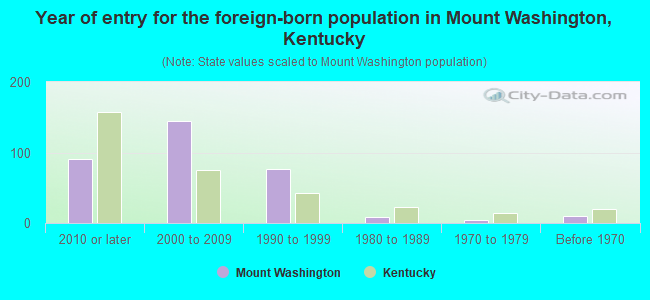
- Year of entry for the foreign-born population in Mount Washington, Kentucky
- 912010 or later
- 1442000 to 2009
- 761990 to 1999
- 81980 to 1989
- 41970 to 1979
- 10Before 1970
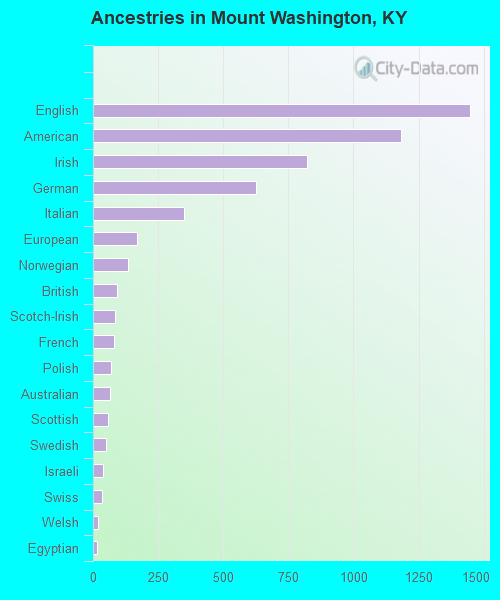
First ancestries reported:
- English: 1,448 (22.8%)
- American: 1,181 (18.6%)
- Irish: 821 (12.9%)
- German: 627 (9.9%)
- Italian: 349 (5.5%)
- European: 169 (2.7%)
- Norwegian: 134 (2.1%)
- British: 94 (1.5%)
- Scotch-Irish: 86 (1.4%)
- French: 81 (1.3%)
- Polish: 71 (1.1%)
- Australian: 65 (1.0%)
- Scottish: 58 (0.9%)
- Swedish: 50 (0.8%)
- Israeli: 40 (0.6%)
- Swiss: 34 (0.5%)
- Welsh: 18 (0.3%)
- Egyptian: 17 (0.3%)
- Eastern European: 12 (0.2%)
- Dutch: 11 (0.2%)
- Northern European: 11 (0.2%)
- Pennsylvania German: 11 (0.2%)
- Albanian: 9 (0.1%)
- French Canadian: 9 (0.1%)
Most common places of birth for foreign-born residents (%):
| Mount Washington: | 27.9% (131) |
| Kentucky: | 8.0% (14,652) |
| Mount Washington: | 18.6% (87) |
| Kentucky: | 15.8% (29,070) |
| Mount Washington: | 10.0% (47) |
| Kentucky: | 0.9% (1,743) |
| Mount Washington: | 9.4% (44) |
| Kentucky: | 3.7% (6,894) |
| Mount Washington: | 7.5% (35) |
| Kentucky: | 7.3% (13,454) |
| Mount Washington: | 5.1% (24) |
| Kentucky: | 0.1% (227) |
| Mount Washington: | 5.1% (24) |
| Kentucky: | 0.0% (86) |
| Mount Washington: | 2.8% (13) |
| Kentucky: | 1.9% (3,585) |
| Mount Washington: | 2.3% (11) |
| Kentucky: | 2.5% (4,639) |
| Mount Washington: | 2.1% (10) |
| Kentucky: | 0.3% (607) |
| Mount Washington: | 1.7% (8) |
| Kentucky: | 1.5% (2,689) |
| Mount Washington: | 1.7% (8) |
| Kentucky: | 0.3% (488) |
Place of birth for U.S.-born residents:
- This state: 14,732
- Other state: 2,852
- Northeast: 213
- Midwest: 1,445
- South: 1,010
- West: 209
90.4% of Mount Washington residents lived in the same house 1 years ago.
Out of people who lived in different houses, 33.4% lived in this county.
Out of people who lived in different counties, 52.2% lived in Kentucky.
| Mount Washington: | 90.4% |
| State average: | 87.2% |
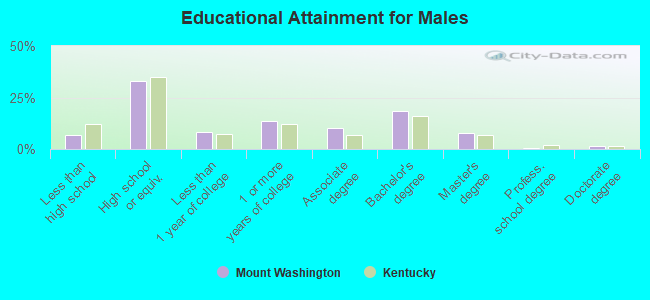
Education attainment for males 25 years and older:
- No schooling: 0
- Nursery to 4th grade: 0
- 5th and 6th grade: 62
- 7th and 8th grade: 45
- 9th grade: 52
- 10th grade: 74
- 11th grade: 41
- 12th grade, no diploma: 111
- High school graduate (or equivalency): 1,850
- Less than 1 year of college: 452
- Some college more than 1 year, no degree: 774
- Associate degree: 559
- Bachelor's degree: 1,035
- Master's degree: 430
- Professional school degree: 26
- Doctorate degree: 94
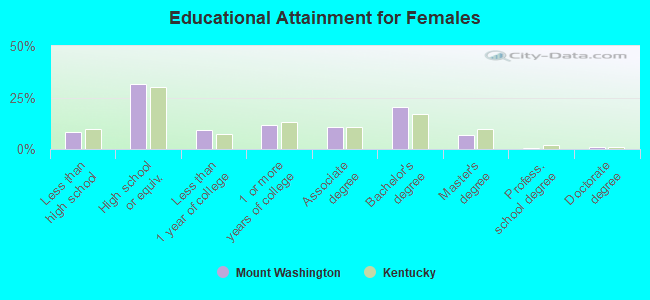
Education attainment for females 25 years and older:
- No schooling: 61
- Nursery to 4th grade: 1
- 5th and 6th grade: 0
- 7th and 8th grade: 45
- 9th grade: 80
- 10th grade: 118
- 11th grade: 149
- 12th grade, no diploma: 49
- High school graduate (or equivalency): 1,997
- Less than 1 year of college: 568
- Some college more than 1 year, no degree: 732
- Associate degree: 685
- Bachelor's degree: 1,293
- Master's degree: 412
- Professional school degree: 31
- Doctorate degree: 61
Housing units in structures:
- One, detached: 5,782
- One, attached: 361
- Two: 129
- 3 or 4: 278
- 5 to 9: 347
- 10 to 19: 59
- 20 to 49: 52
- 50 or more: 49
- Mobile homes: 128
Median worth of mobile homes: $32,131
Housing units lacking complete kitchen facilities in 2022: 2.3%
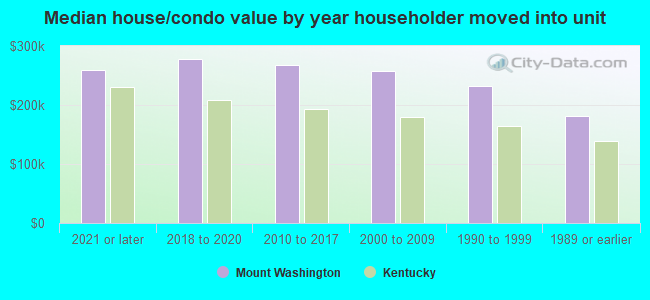
House/condo owner moved in on average 7 years ago
Renter moved in on average 1 years ago
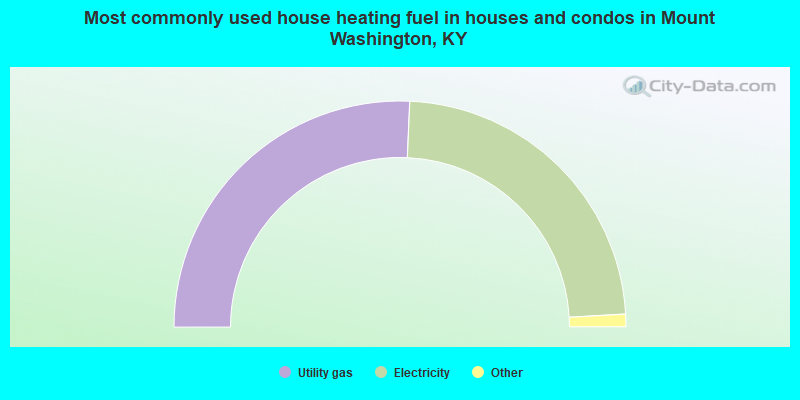
- 51.4%Utility gas
- 46.8%Electricity
- 1.2%Bottled, tank, or LP gas
- 0.3%No fuel used
- 0.1%Fuel oil, kerosene, etc.
- 0.1%Wood
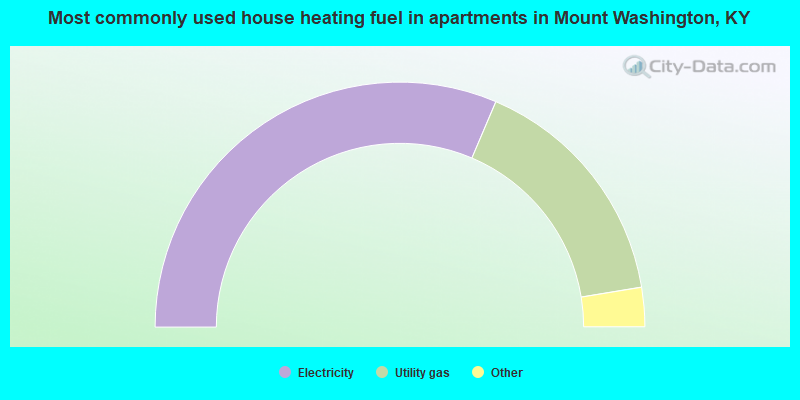
- 62.9%Electricity
- 32.0%Utility gas
- 3.5%Bottled, tank, or LP gas
- 1.6%No fuel used
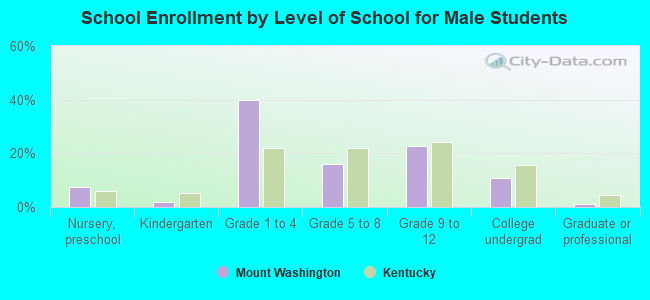
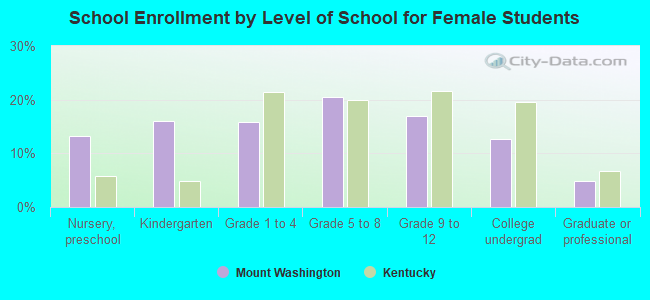
Private vs. public school enrollment:
| Here: | 8.2% |
| Kentucky: | 17.2% |
| Here: | 18.5% |
| Kentucky: | 15.2% |
| Here: | 29.0% |
| Kentucky: | 19.6% |