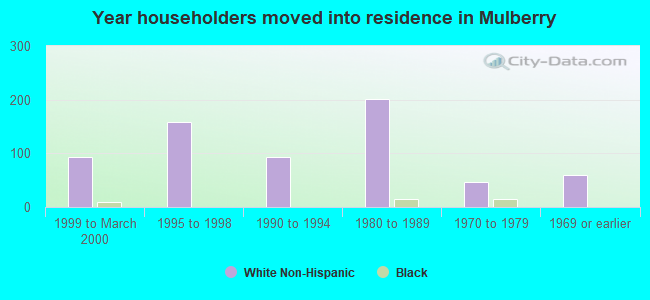
Mulberry, TN (Tennessee) Houses and Residents
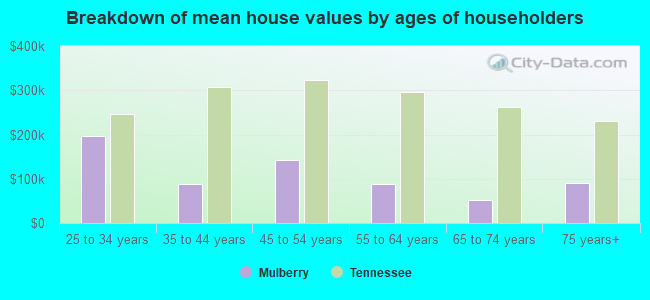
| Mulberry: | $278,136 |
| Tennessee: | $284,800 |
Total population: 1,913 (Urban population: 7 (all inside urban clusters), Rural population: 1,798 (258 farm, 1,540 nonfarm))
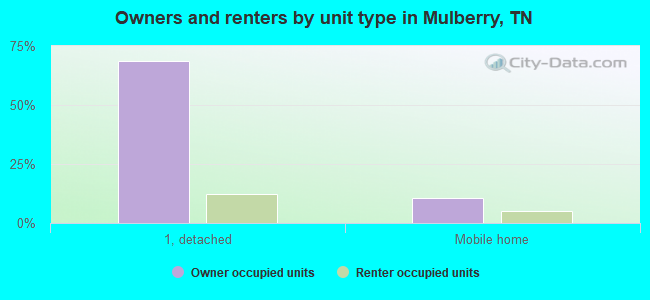
Houses: 834 (692 occupied: 561 owner occupied, 131 renter occupied)
| % of renters here: | 19% |
| State: | 33% |
Housing density: 9 houses/condos per square mile
Median price asked for vacant for-sale houses and condos in 2022 in this county: $413,308.
Median contract rent in 2022: $657 (lower quartile is $477, upper quartile is $689)
Median rent asked for vacant for-rent units in 2022: $527
Median gross rent in Mulberry, TN in 2022: $916
Housing units in Mulberry with a mortgage: 131 (0 second mortgage, 42 home equity loan, 0 both second mortgage and home equity loan)
Houses without a mortgage: 87


Household type by relationship:
Households: 33,078- In family households: 28,525 (6,942 male householders, 2,507 female householders)
7,233 spouses, 9,242 children (8,321 natural, 251 adopted, 670 stepchildren), 946 grandchildren, 242 brothers or sisters, 253 parents, foster children, 370 other relatives, 610 non-relatives
- In nonfamily households: 4,553 (1,714 male householders (1,432 living alone)), 2,219 female householders (2,002 living alone)), 620 nonrelatives
- In group quarters: 283 (272 institutionalized population)
5,225 married couples with children.
1,572 single-parent households (330 men, 1,242 women).
98.7% of residents of Mulberry speak English at home.
0.5% of residents speak Spanish at home (100% speak English very well).
0.8% of residents speak other Indo-European language at home (100% speak English very well).
Foreign born population: 10 (0.5%)
(0.0% of them are naturalized citizens)
| Here: | 7.5 |
| State: | 6.5 |
| Here: | 4.9 |
| State: | 4.4 |
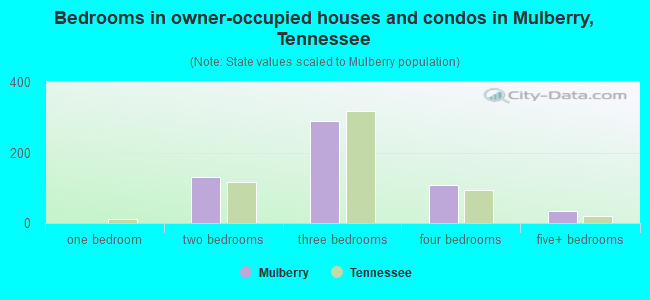
- Bedrooms in owner-occupied houses and condos in Mulberry, Tennessee
- 0no bedroom
- 01 bedroom
- 1302 bedrooms
- 2893 bedrooms
- 1094 bedrooms
- 335+ bedrooms
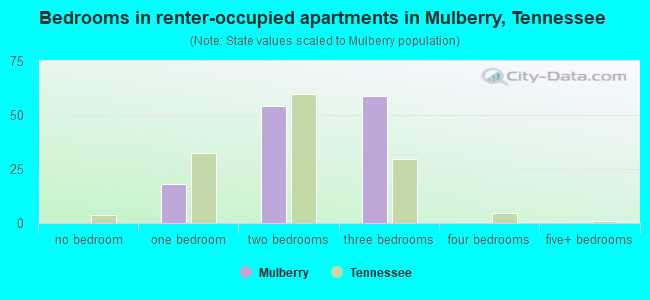
- Bedrooms in renter-occupied apartments in Mulberry, Tennessee
- 0no bedroom
- 181 bedroom
- 542 bedrooms
- 593 bedrooms
- 04 bedrooms
- 05+ bedrooms
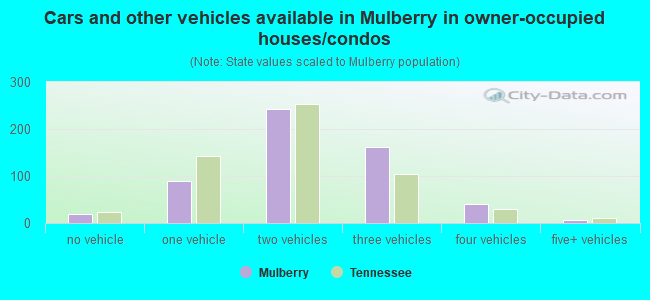
- Cars and other vehicles available in Mulberry in owner-occupied houses/condos
- 20no vehicle
- 891 vehicle
- 2432 vehicles
- 1623 vehicles
- 404 vehicles
- 75+ vehicles
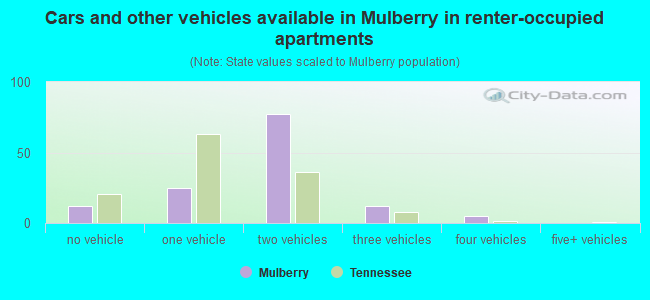
- Cars and other vehicles available in Mulberry in renter-occupied apartments
- 12no vehicle
- 251 vehicle
- 772 vehicles
- 123 vehicles
- 54 vehicles
- 05+ vehicles
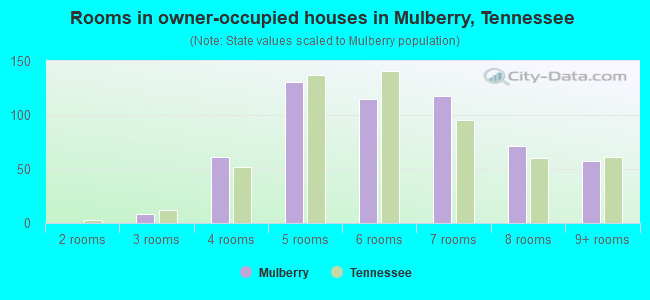
- Rooms in owner-occupied houses in Mulberry, Tennessee
- 01 room
- 02 rooms
- 83 rooms
- 614 rooms
- 1315 rooms
- 1156 rooms
- 1187 rooms
- 718 rooms
- 579+ rooms
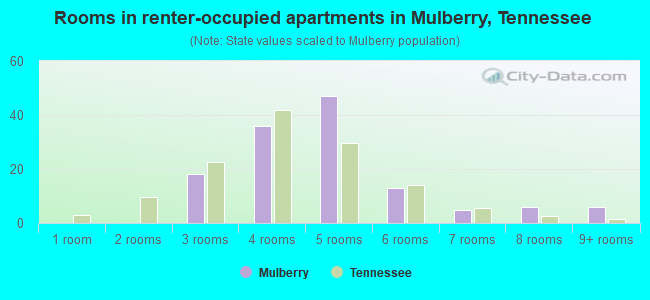
- Rooms in renter-occupied apartments in Mulberry, Tennessee
- 01 room
- 02 rooms
- 183 rooms
- 364 rooms
- 475 rooms
- 136 rooms
- 57 rooms
- 68 rooms
- 69+ rooms
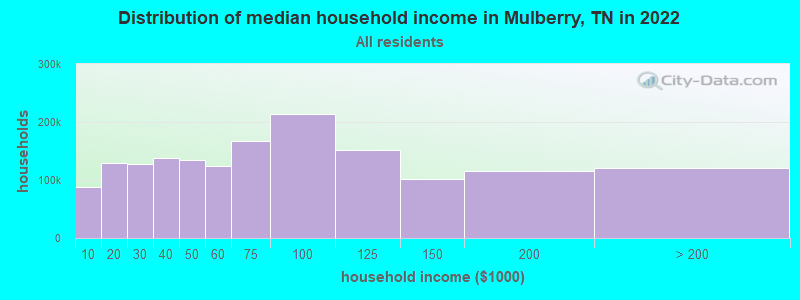
Mulberry, TN household income distribution

- 58,652Less than $10,000
- 97,967$10,000 to $19,999
- 93,015$20,000 to $29,999
- 95,294$30,000 to $39,999
- 92,173$40,000 to $49,999
- 85,277$50,000 to $59,999
- 116,219$60,000 to $74,999
- 148,166$75,000 to $99,999
- 110,639$100,000 to $124,999
- 66,139$125,000 to $149,999
- 72,704$150,000 to $199,999
- 62,004$200,000 or more
Percentage of workers working in this county: 56.4%
Number of people working at home: 100 (9.9% of all workers)
Travel time to work (commute)
- Less than 5 minutes: 18
- 5 to 9 minutes: 53
- 10 to 14 minutes: 154
- 15 to 19 minutes: 130
- 20 to 24 minutes: 138
- 25 to 29 minutes: 36
- 30 to 34 minutes: 46
- 35 to 39 minutes: 46
- 40 to 44 minutes: 14
- 45 to 59 minutes: 140
- 60 to 89 minutes: 79
- 90 or more minutes: 25
Means of transportation to work:
- Drove a car alone: 697 (77.1%)
- Carpooled: 156 (17.3%)
- Walked: 22 (2.4%)
- Other means: 4 (0.4%)
- Worked at home: 25 (2.8%)
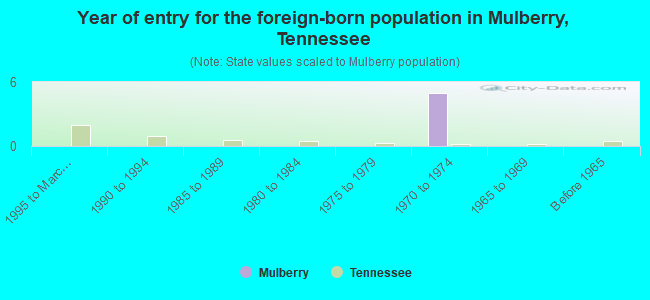
- Year of entry for the foreign-born population in Mulberry, Tennessee
- 01995 to March 2000
- 01990 to 1994
- 01985 to 1989
- 01980 to 1984
- 01975 to 1979
- 51970 to 1974
- 01965 to 1969
- 0Before 1965
Most common places of birth for foreign-born residents (%):
| Mulberry: | 100.0% (5) |
| Tennessee: | 4.4% (6,981) |
Place of birth for U.S.-born residents:
- This state: 1,167
- Other state: 633
- Northeast: 25
- Midwest: 220
- South: 374
- West: 14
60% of Mulberry residents lived in the same house 5 years ago.
Out of people who lived in different houses, 49% lived in this county.
Out of people who lived in different counties, 61% lived in Tennessee.
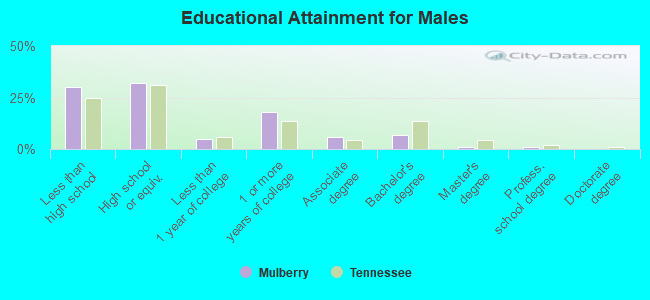
Education attainment for males 25 years and older:
- No schooling: 4
- Nursery to 4th grade: 9
- 5th and 6th grade: 18
- 7th and 8th grade: 71
- 9th grade: 20
- 10th grade: 38
- 11th grade: 20
- 12th grade, no diploma: 7
- High school graduate (or equivalency): 199
- Less than 1 year of college: 31
- Some college more than 1 year, no degree: 112
- Associate degree: 35
- Bachelor's degree: 43
- Master's degree: 6
- Professional school degree: 5
- Doctorate degree: 0
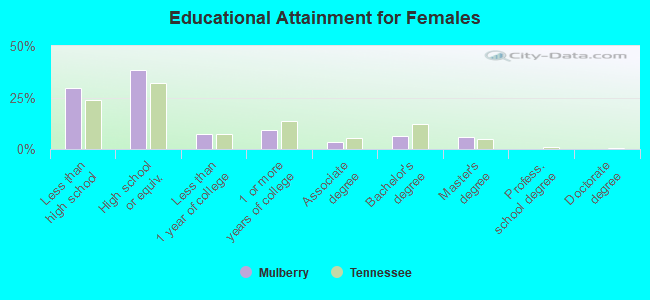
Education attainment for females 25 years and older:
- No schooling: 0
- Nursery to 4th grade: 0
- 5th and 6th grade: 12
- 7th and 8th grade: 57
- 9th grade: 15
- 10th grade: 37
- 11th grade: 28
- 12th grade, no diploma: 46
- High school graduate (or equivalency): 255
- Less than 1 year of college: 49
- Some college more than 1 year, no degree: 61
- Associate degree: 22
- Bachelor's degree: 43
- Master's degree: 37
- Professional school degree: 0
- Doctorate degree: 0
Housing units in structures:
- One, detached: 674
- One, attached: 6
- Two: 8
- 3 or 4: 5
- 50 or more: 6
- Mobile homes: 135
Median worth of mobile homes: $111,519
Housing units lacking complete kitchen facilities: 3.0%
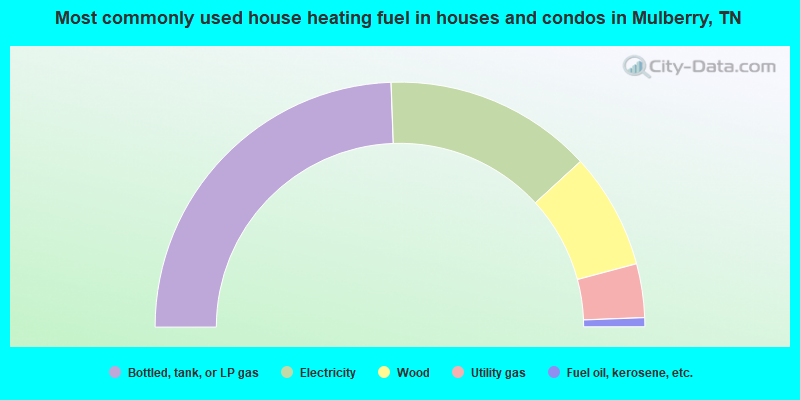
- 48.8%Bottled, tank, or LP gas
- 27.5%Electricity
- 15.3%Wood
- 7.1%Utility gas
- 1.2%Fuel oil, kerosene, etc.
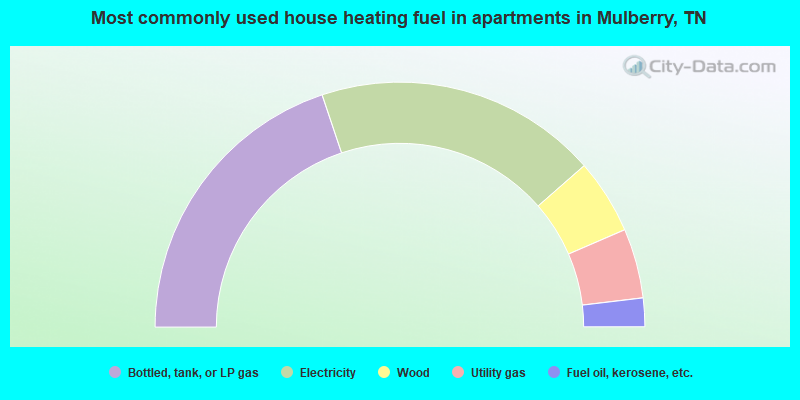
- 39.7%Bottled, tank, or LP gas
- 37.4%Electricity
- 9.9%Wood
- 9.2%Utility gas
- 3.8%Fuel oil, kerosene, etc.
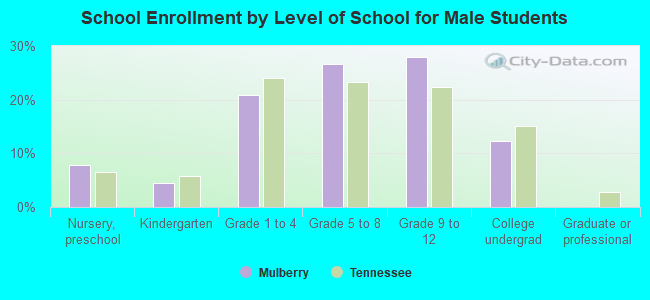
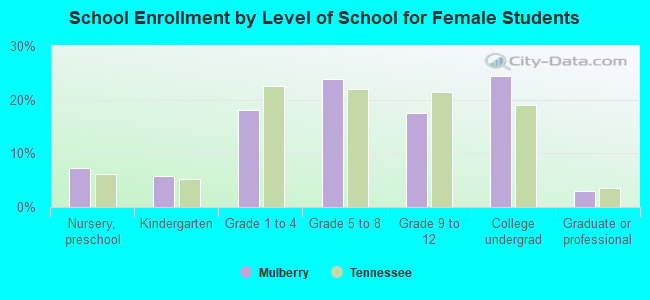
Private vs. public school enrollment:
| Here: | 8.2% |
| Tennessee: | 9.5% |
| Here: | 6.3% |
| Tennessee: | 10.4% |
| Here: | 8.7% |
| Tennessee: | 22.8% |