Nashville, NC (North Carolina) Houses and Residents
| Nashville: | $206,851 |
| North Carolina: | $280,600 |
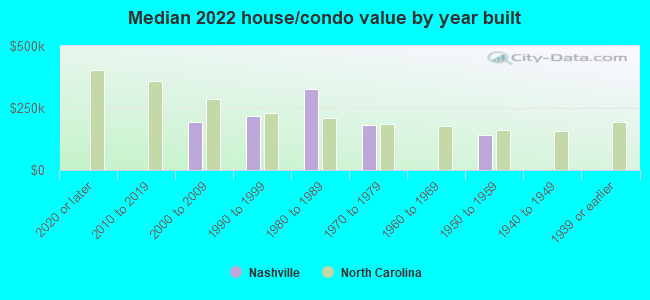
Mean price in 2022:
Detached houses: $203,490
Here: $203,490 State: $375,326 Mobile homes: $123,939
Here: $123,939 State: $124,933
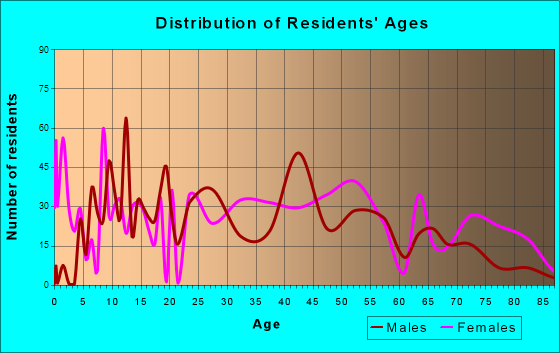
Total population: 5,464 (Urban population: 4,248, Rural population: 35 (all nonfarm))
Houses: 2,617 (2,326 occupied: 1,320 owner occupied, 1,002 renter occupied)
| % of renters here: | 43% |
| State: | 33% |
Housing density: 866 houses/condos per square mile
Median price asked for vacant for-sale houses and condos in 2022 in this county: $119,117.
Median contract rent in 2022: $745 (lower quartile is $312, upper quartile is $895)
Median rent asked for vacant for-rent units in 2022: $773
Median gross rent in Nashville, NC in 2022: $920
Housing units in Nashville with a mortgage: 784 (5 second mortgage, 0 home equity loan, 5 both second mortgage and home equity loan)
Houses without a mortgage: 18
Median household income for houses/condos with a mortgage: $73,933
Median household income for apartments without a mortgage: $57,505
Median monthly housing costs: $940
Compare current foreclosures in Nashville, NC:
| Photo | Address | Area | Beds / Baths | Price | Details |
|---|---|---|---|---|---|

|
#1
Crooked Creek Ln
Nashville, NC 27856
|
1,650 sq. feet
|
2 baths 2 beds |
$410,000
|
show details |

|
#2
Reges Store Rd
Nashville, NC 27856
|
1,468 sq. feet
|
2 baths 3 beds |
show details | |

|
#3
E Washington St
Nashville, NC 27856
|
2,083 sq. feet
|
2 baths 3 beds |
show details | |

|
#4
Trinity Dr
Nashville, NC 27856
|
1,914 sq. feet
|
2 baths 3 beds |
show details | |

|
#5
Sandy Cross Rd
Nashville, NC 27856
|
1,200 sq. feet
|
2 baths 3 beds |
show details | |

|
#6
Barnes Ct
Nashville, NC 27856
|
1,344 sq. feet
|
2 baths 3 beds |
show details | |

|
#7
S Bass Dr
Nashville, NC 27856
|
1,056 sq. feet
|
2 baths 2 beds |
show details | |

|
#8
Indian Trl
Nashville, NC 27856
|
1,100 sq. feet
|
1 baths 3 beds |
show details | |

|
#9
Birchwood Village Ct
Nashville, NC 27856
|
1,544 sq. feet
|
2 baths 3 beds |
show details | |

|
#10
Barnes Ct
Nashville, NC 27856
|
1,344 sq. feet
|
2 baths 3 beds |
show details |
| Photo | Address | Area | Beds / Baths | Price | Details |
|---|---|---|---|---|---|

|
#11
James Bunn Rd
Nashville, NC 27856
|
1,098 sq. feet
|
1 baths 3 beds |
show details | |

|
#12
Wheeles Cabin Rd
Nashville, NC 27856
|
920 sq. feet
|
2 baths 3 beds |
show details | |

|
#13
Kelly Dr
Nashville, NC 27856
|
3,999 sq. feet
|
4 baths 4 beds |
show details | |

|
#14
Taylors Store Rd
Nashville, NC 27856
|
1,976 sq. feet
|
2 baths 3 beds |
show details | |

|
#15
Taylors Store Rd
Nashville, NC 27856
|
1,440 sq. feet
|
2 baths 3 beds |
show details | |

|
#16
Ward St
Nashville, NC 27856
|
1,105 sq. feet
|
1 baths 3 beds |
show details | |

|
#17
Remus Rd
Nashville, NC 27856
|
- sq. feet
|
- baths - beds |
show details | |

|
#18
Mcgregor Rd
Nashville, NC 27856
|
- sq. feet
|
- baths - beds |
show details | |

|
#19
Long Branch Dr
Nashville, NC 27856
|
- sq. feet
|
- baths - beds |
show details | |

|
#20
Scott Ct
Nashville, NC 27856
|
- sq. feet
|
- baths - beds |
show details |
| Photo | Address | Area | Beds / Baths | Price | Details |
|---|---|---|---|---|---|

|
#21
Cuddington Ln
Nashville, NC 27856
|
- sq. feet
|
- baths - beds |
show details | |

|
#22
Western Ave Apt B2
Nashville, NC 27856
|
- sq. feet
|
- baths - beds |
show details | |

|
#23
S Bass Dr # A
Nashville, NC 27856
|
- sq. feet
|
- baths - beds |
show details | |

|
#24
Live Oak Ln
Nashville, NC 27856
|
- sq. feet
|
- baths - beds |
show details | |

|
#25
Western Ave Apt C1
Nashville, NC 27856
|
- sq. feet
|
- baths - beds |
show details | |

|
#26
Garner Ct
Nashville, NC 27856
|
- sq. feet
|
- baths - beds |
show details | |

|
#27
Evans Rd
Nashville, NC 27856
|
- sq. feet
|
- baths - beds |
show details | |

|
#28
Evans Rd
Nashville, NC 27856
|
- sq. feet
|
- baths - beds |
show details | |

|
#29
N Clarendon Dr
Nashville, NC 27856
|
- sq. feet
|
- baths - beds |
show details | |

|
#30
S 1st St Apt 44
Nashville, NC 27856
|
- sq. feet
|
- baths - beds |
show details |
| Photo | Address | Area | Beds / Baths | Price | Details |
|---|---|---|---|---|---|

|
#31
Tom George Rd
Nashville, NC 27856
|
- sq. feet
|
- baths - beds |
show details | |

|
Check over 1 million property listings on Foreclosure.com!
|
browse all offers | |||

Latest news about housing in Nashville, NC collected exclusively by city-data.com from local newspapers, TV, and radio stations

 | Unique house rentals (9 replies) |
| Need Real Estate Agent Who Can Help With Charlotte Rental MLS (10 replies) |
| Development in NC (418 replies) |
| Nation’s top real estate markets for 2020: Raleigh-Durham # 2 (79 replies) |
| Considering moving from Nashville to Raleigh-Durham-thoughts? (17 replies) |
| Apartments in Nashville, NC (4 replies) |
Median year apartment built: 1996
Household type by relationship:
Households: 5,669- Male householders: 942 (215 living alone), Female householders: 1,373 (404 living alone)
861 spouses (861 opposite-sex spouses), 265 unmarried partners, (265 opposite-sex unmarried partners), 1,678 children (1,639 natural, 0 adopted, 39 stepchildren), 206 grandchildren, 24 brothers or sisters, 27 parents, 0 foster children, 18 other relatives, 163 non-relatives
- In group quarters: 108
Size of family households: 791 2-persons, 498 3-persons, 273 4-persons.
Size of nonfamily households: 700 1-person, 50 2-persons, 20 4-persons, 15 5-persons.
195 married couples with children.
1,072 single-parent households (106 men, 966 women).
98.8% of residents of Nashville speak English at home.
0.1% of residents speak Spanish at home (100% speak English very well).
0.8% of residents speak Asian or Pacific Island language at home (100% speak English very well).
Foreign born population: 75 (1.3%)
(150.7% of them are naturalized citizens)
| Here: | 5.7 |
| State: | 6.4 |
| Here: | 4.4 |
| State: | 4.4 |
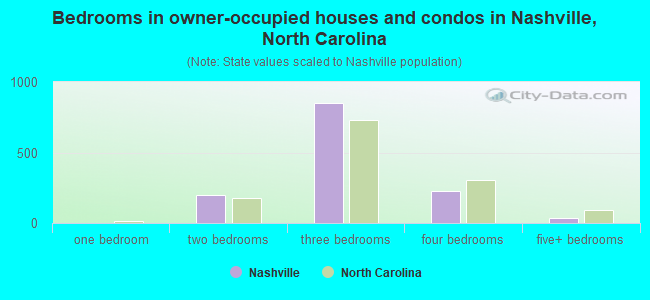
- Bedrooms in owner-occupied houses and condos in Nashville, North Carolina
- 0no bedroom
- 01 bedroom
- 2022 bedrooms
- 8523 bedrooms
- 2284 bedrooms
- 385+ bedrooms
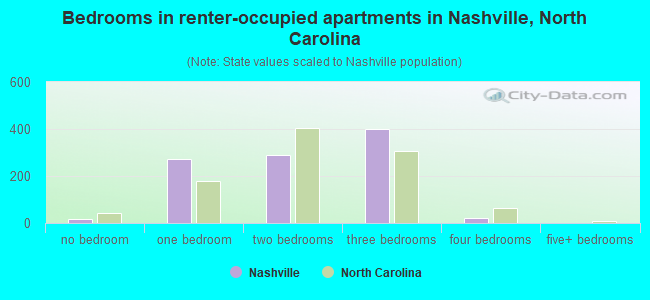
- Bedrooms in renter-occupied apartments in Nashville, North Carolina
- 16no bedroom
- 2741 bedroom
- 2912 bedrooms
- 3983 bedrooms
- 224 bedrooms
- 05+ bedrooms
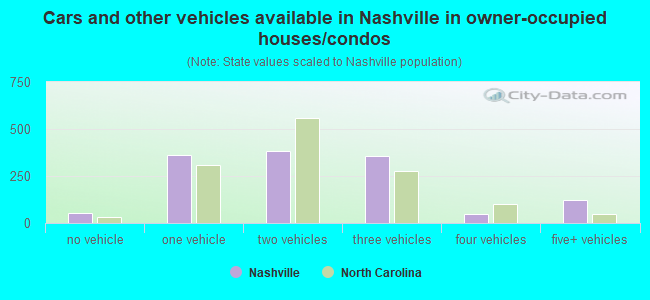
- Cars and other vehicles available in Nashville in owner-occupied houses/condos
- 52no vehicle
- 3641 vehicle
- 3812 vehicles
- 3553 vehicles
- 494 vehicles
- 1205+ vehicles
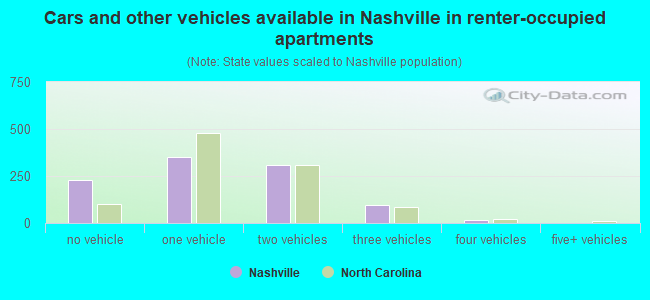
- Cars and other vehicles available in Nashville in renter-occupied apartments
- 230no vehicle
- 3501 vehicle
- 3112 vehicles
- 973 vehicles
- 144 vehicles
- 05+ vehicles
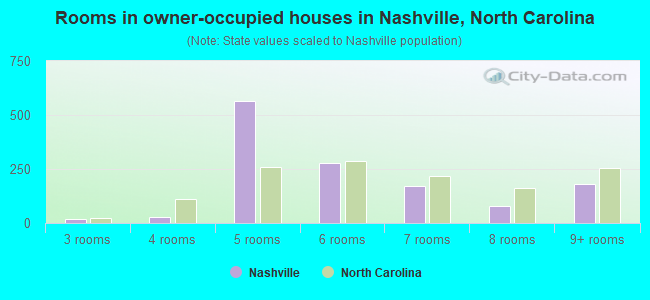
- Rooms in owner-occupied houses in Nashville, North Carolina
- 01 room
- 02 rooms
- 203 rooms
- 284 rooms
- 5635 rooms
- 2806 rooms
- 1707 rooms
- 788 rooms
- 1819+ rooms
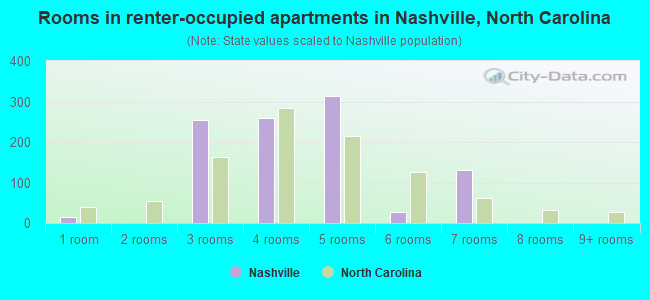
- Rooms in renter-occupied apartments in Nashville, North Carolina
- 161 room
- 02 rooms
- 2543 rooms
- 2604 rooms
- 3135 rooms
- 286 rooms
- 1307 rooms
- 08 rooms
- 09+ rooms
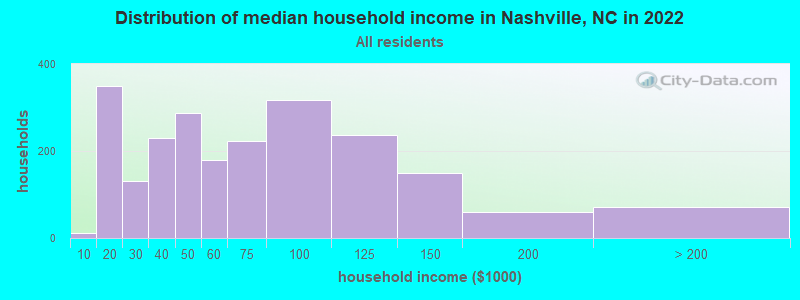
Nashville, NC household income distribution

- 12Less than $10,000
- 349$10,000 to $19,999
- 132$20,000 to $29,999
- 229$30,000 to $39,999
- 287$40,000 to $49,999
- 179$50,000 to $59,999
- 224$60,000 to $74,999
- 317$75,000 to $99,999
- 236$100,000 to $124,999
- 149$125,000 to $149,999
- 59$150,000 to $199,999
- 72$200,000 or more
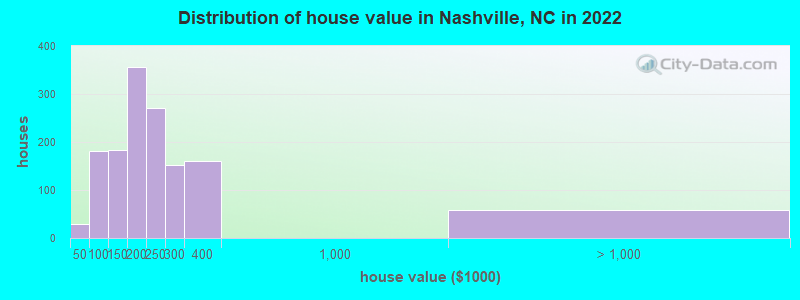
Home value of owner - occupied houses in 2022 in Nashville, NC
-
- 17$20,000 to $24,999
- 4$25,000 to $29,999
- 8$35,000 to $39,999
- 20$60,000 to $69,999
- 42$70,000 to $79,999
- 102$80,000 to $89,999
- 15$90,000 to $99,999
- 61$100,000 to $124,999
- 122$125,000 to $149,999
- 150$150,000 to $174,999
- 207$175,000 to $199,999
- 270$200,000 to $249,999
- 151$250,000 to $299,999
- 161$300,000 to $399,999
- 57$1,000,000 to $1,499,999
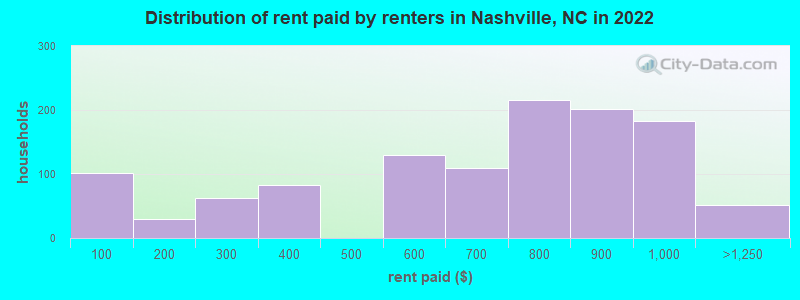
Rent paid by renters in 2022 in Nashville, NC
-
- 100Less than $100
- 30$150 to $199
- 61$250 to $299
- 82$300 to $349
- 117$500 to $549
- 11$550 to $599
- 9$600 to $649
- 99$650 to $699
- 89$700 to $749
- 126$750 to $799
- 201$800 to $899
- 182$900 to $999
- 52$1,000 to $1,249
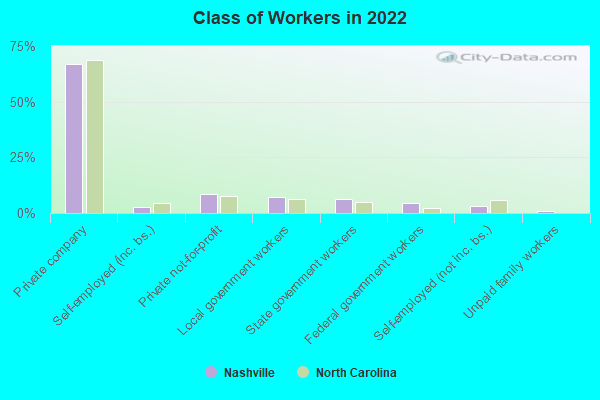
Percentage of workers working in this county: 75.6%
Number of people working at home: 717 (26.4% of all workers)
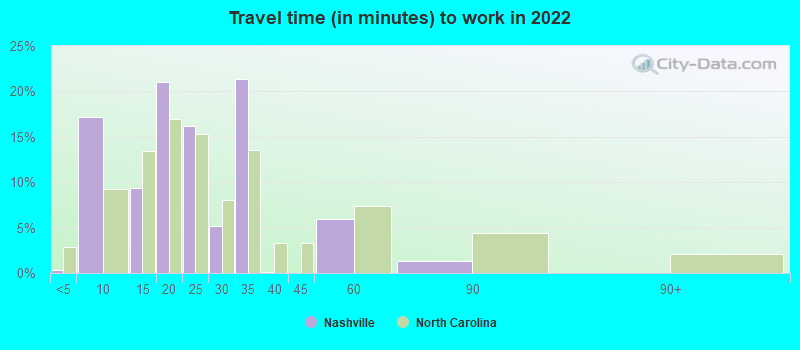
Travel time to work (commute)
- Less than 5 minutes: 0
- 5 to 9 minutes: 217
- 10 to 14 minutes: 241
- 15 to 19 minutes: 384
- 20 to 24 minutes: 327
- 25 to 29 minutes: 251
- 30 to 34 minutes: 187
- 35 to 39 minutes: 35
- 40 to 44 minutes: 0
- 45 to 59 minutes: 138
- 60 to 89 minutes: 44
- 90 or more minutes: 20
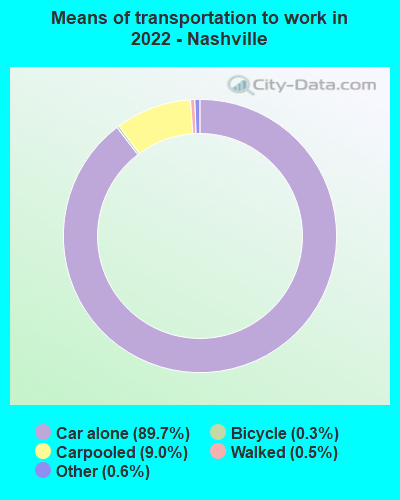
Means of transportation to work:
- Drove a car alone: 2,249 (70.7%)
- Carpooled: 234 (7.4%)
- Taxi: 14 (0.4%)
- Bicycle: 8 (0.3%)
- Walked: 13 (0.4%)
- Worked at home: 717 (22.5%)
- Unemployment by race in 2022
- Unemployment rate for White non-Hispanic residents
- 4.4%Males
- Unemployment rate for Black residents
- 16.5%Males
- 7.9%Females
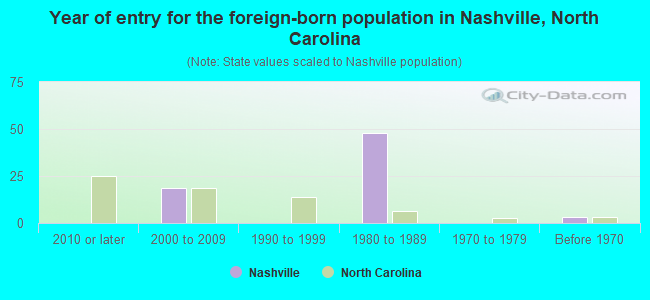
- Year of entry for the foreign-born population in Nashville, North Carolina
- 02010 or later
- 192000 to 2009
- 01990 to 1999
- 481980 to 1989
- 01970 to 1979
- 3Before 1970
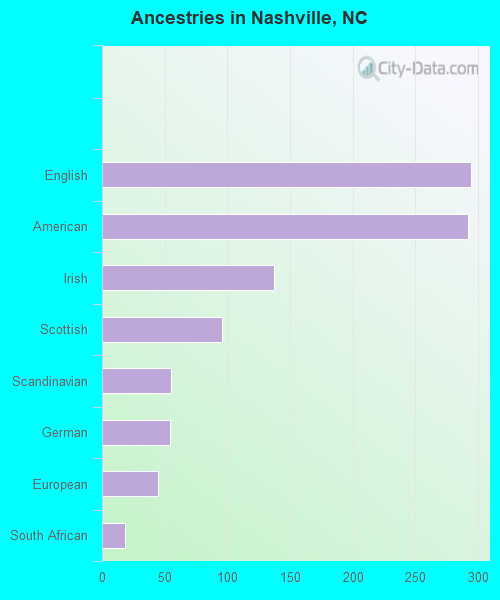
First ancestries reported:
- English: 294 (7.7%)
- American: 292 (7.7%)
- Irish: 137 (3.6%)
- Scottish: 96 (2.5%)
- Scandinavian: 55 (1.4%)
- German: 54 (1.4%)
- European: 45 (1.2%)
- South African: 18 (0.5%)
Most common places of birth for foreign-born residents (%):
| Nashville: | 82.9% (68) |
| North Carolina: | 1.2% (10,140) |
| Nashville: | 17.1% (14) |
| North Carolina: | 0.5% (4,673) |
Place of birth for U.S.-born residents:
- This state: 4,772
- Other state: 783
- Northeast: 222
- Midwest: 69
- South: 484
- West: 6
88.4% of Nashville residents lived in the same house 1 years ago.
Out of people who lived in different houses, 38.2% lived in this county.
Out of people who lived in different counties, 100.0% lived in North Carolina.
| Nashville: | 88.4% |
| State average: | 87.3% |
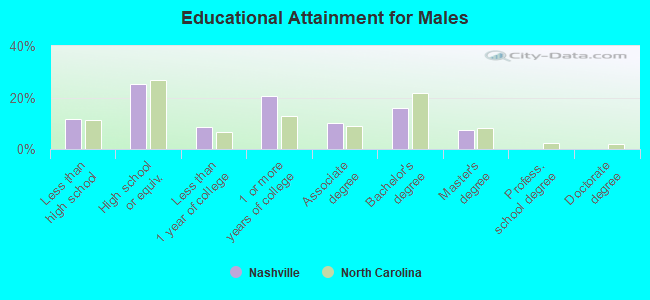
Education attainment for males 25 years and older:
- No schooling: 0
- Nursery to 4th grade: 8
- 5th and 6th grade: 0
- 7th and 8th grade: 18
- 9th grade: 23
- 10th grade: 131
- 11th grade: 0
- 12th grade, no diploma: 0
- High school graduate (or equivalency): 398
- Less than 1 year of college: 137
- Some college more than 1 year, no degree: 325
- Associate degree: 160
- Bachelor's degree: 251
- Master's degree: 118
- Professional school degree: 0
- Doctorate degree: 0
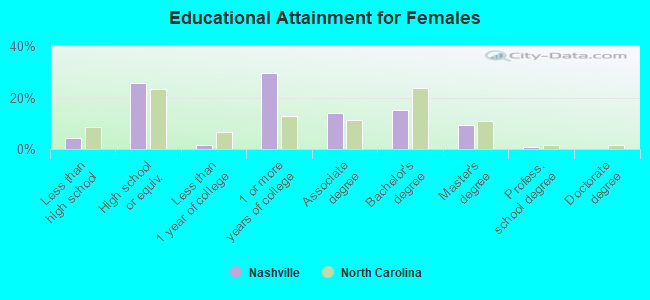
Education attainment for females 25 years and older:
- No schooling: 0
- Nursery to 4th grade: 7
- 5th and 6th grade: 1
- 7th and 8th grade: 0
- 9th grade: 27
- 10th grade: 52
- 11th grade: 0
- 12th grade, no diploma: 12
- High school graduate (or equivalency): 588
- Less than 1 year of college: 36
- Some college more than 1 year, no degree: 680
- Associate degree: 324
- Bachelor's degree: 348
- Master's degree: 212
- Professional school degree: 21
- Doctorate degree: 0
Housing units in structures:
- One, detached: 1,889
- One, attached: 19
- Two: 250
- 3 or 4: 146
- 5 to 9: 20
- 10 to 19: 196
- 20 to 49: 20
- 50 or more: 29
- Mobile homes: 45
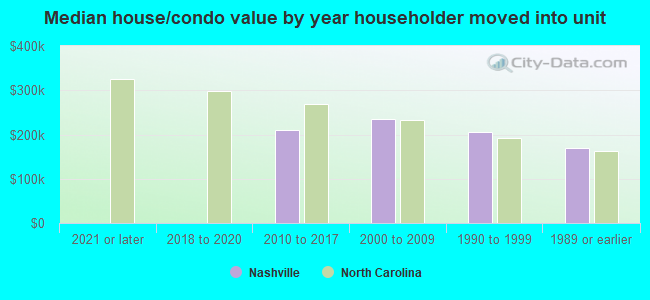
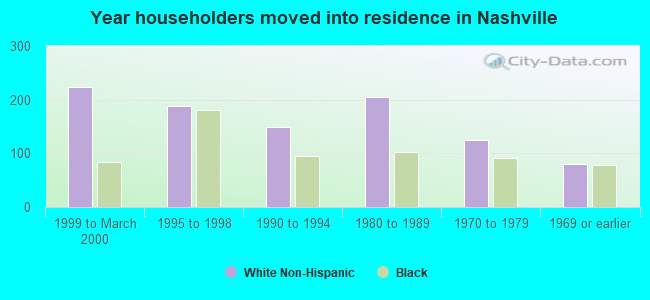
House/condo owner moved in on average 13 years ago
Renter moved in on average 5 years ago
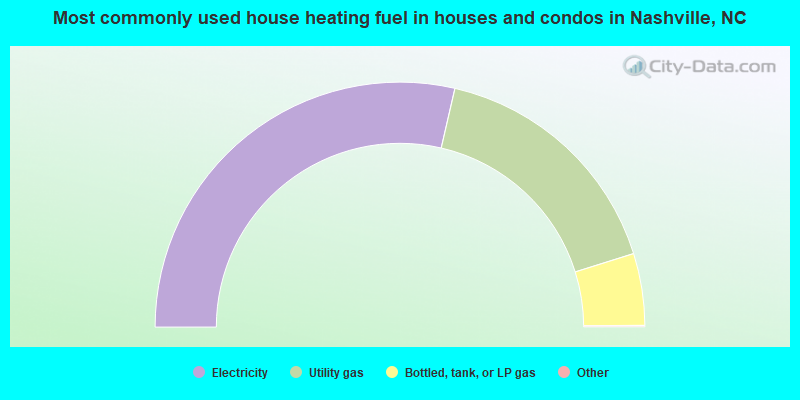
- 57.4%Electricity
- 33.2%Utility gas
- 9.5%Bottled, tank, or LP gas
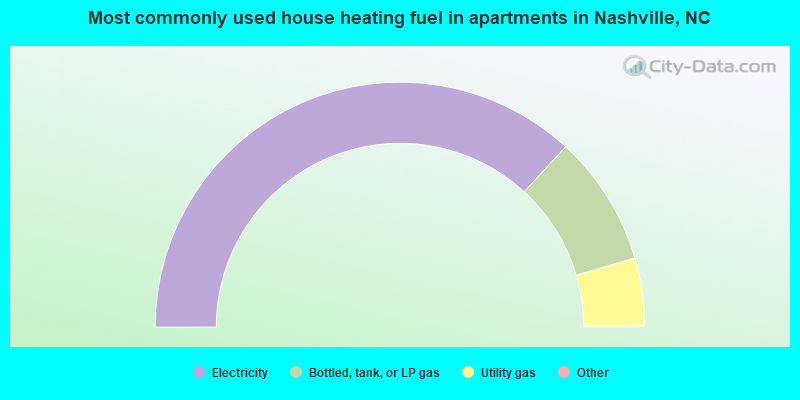
- 73.9%Electricity
- 17.3%Bottled, tank, or LP gas
- 8.9%Utility gas
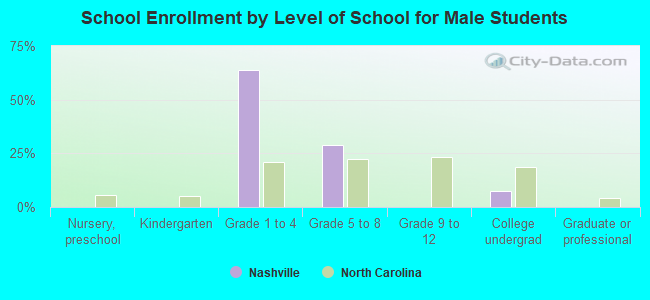
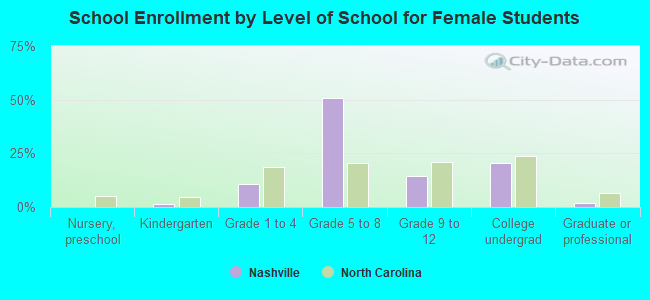
Private vs. public school enrollment:
| Here: | 0.0% |
| North Carolina: | 13.8% |
| Here: | 0.0% |
| North Carolina: | 11.9% |
| Here: | 13.1% |
| North Carolina: | 19.3% |