Needville, TX (Texas) Houses and Residents
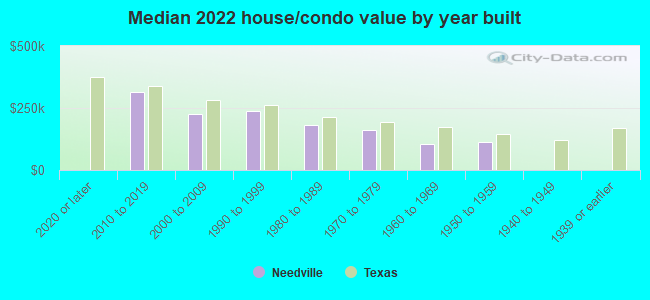
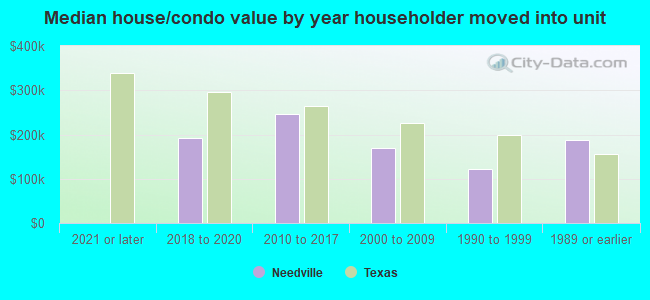
| Needville: | $216,550 |
| Texas: | $275,400 |
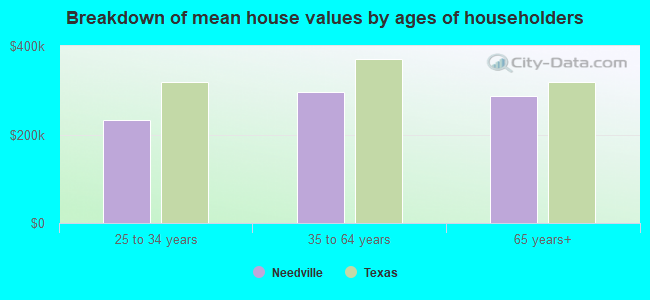
Mean price in 2022:
Detached houses: $238,664
Here: $238,664 State: $369,058 Mobile homes: $22,479
Here: $22,479 State: $124,413
Total population: 3,058 (Urban population: 2,437 (all inside urban clusters), Rural population: 43 (all nonfarm))
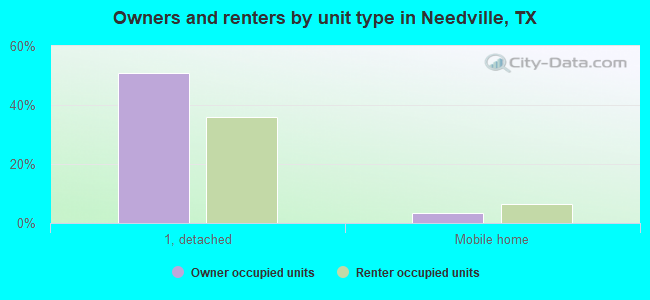
Houses: 1,413 (1,311 occupied: 722 owner occupied, 600 renter occupied)
| % of renters here: | 45% |
| State: | 38% |
Housing density: 830 houses/condos per square mile
Median price asked for vacant for-sale houses and condos in 2022 in this county: $301,799.
Median contract rent in 2022: $1,001 (lower quartile is $846, upper quartile is $1,344)
Median rent asked for vacant for-rent units in 2022: $1,152
Median gross rent in Needville, TX in 2022: $1,205
Housing units in Needville with a mortgage: 407 (45 second mortgage, 0 home equity loan, 29 both second mortgage and home equity loan)
Houses without a mortgage: 5
Median household income for houses/condos with a mortgage: $111,993
Median household income for apartments without a mortgage: $65,937
Median monthly housing costs: $1,065
Compare current foreclosures near Needville, TX:
| Photo | Address | Area | Beds / Baths | Price | Details |
|---|---|---|---|---|---|

|
#1
Fm 1236 Rd
Needville, TX 77461
|
1,796 sq. feet
|
2 baths 4 beds |
show details | |

|
#2
Beasley Ave
Needville, TX 77461
|
1,250 sq. feet
|
- baths 3 beds |
show details | |

|
#3
Colony Rd
Needville, TX 77461
|
2,608 sq. feet
|
- baths 4 beds |
show details | |

|
#4
Jeske Rd
Needville, TX 77461
|
1,344 sq. feet
|
- baths - beds |
show details | |

|
#5
Hill Side Ln
Needville, TX 77461
|
1,320 sq. feet
|
- baths - beds |
show details | |

|
#6
Fm 442 Rd
Boling, TX 77420
|
1,064 sq. feet
|
2 baths 3 beds |
$149,900
|
show details |

|
#7
Blue Ridge Dr
Richmond, TX 77469
|
1,452 sq. feet
|
2 baths 3 beds |
show details | |

|
#8
Summerdale Dr
Richmond, TX 77469
|
845 sq. feet
|
2 baths 4 beds |
show details | |

|
#9
Ridgeback Dr
Rosenberg, TX 77471
|
- sq. feet
|
2 baths 3 beds |
show details | |

|
#10
Maple Run Dr
Sugar Land, TX 77479
|
2,444 sq. feet
|
2 baths 4 beds |
show details |
| Photo | Address | Area | Beds / Baths | Price | Details |
|---|---|---|---|---|---|

|
#11
Kelving Way
Wharton, TX 77488
|
1,401 sq. feet
|
2 baths 3 beds |
show details | |

|
#12
Rustic Oak Ln
Richmond, TX 77469
|
4,465 sq. feet
|
3 baths 5 beds |
show details | |

|
#13
Bent Bridge Ln
Richmond, TX 77469
|
3,039 sq. feet
|
3 baths 4 beds |
show details | |

|
#14
Arbor Green Ln
Richmond, TX 77469
|
2,206 sq. feet
|
2 baths 4 beds |
show details | |

|
#15
Canyon Chase Dr
Richmond, TX 77469
|
3,385 sq. feet
|
3 baths 4 beds |
show details | |

|
#16
Silent Willow Ln
Sugar Land, TX 77479
|
2,304 sq. feet
|
2 baths 3 beds |
show details | |

|
#17
Aspenwood Dr
Richmond, TX 77406
|
3,818 sq. feet
|
3 baths 4 beds |
show details | |

|
#18
White Clover Dr
Richmond, TX 77469
|
2,573 sq. feet
|
3 baths 4 beds |
show details | |

|
#19
Riverhollow Ln
Sugar Land, TX 77479
|
2,349 sq. feet
|
2 baths 3 beds |
show details | |

|
#20
Shannondale Dr
Sugar Land, TX 77479
|
4,784 sq. feet
|
4 baths 5 beds |
show details |
| Photo | Address | Area | Beds / Baths | Price | Details |
|---|---|---|---|---|---|

|
#21
Travis St
Richmond, TX 77469
|
1,702 sq. feet
|
- baths 3 beds |
show details | |

|
#22
Buchanan Dr
Richmond, TX 77469
|
1,480 sq. feet
|
- baths 3 beds |
show details | |

|
#23
Rock Fence Dr
Richmond, TX 77406
|
2,448 sq. feet
|
- baths 4 beds |
show details | |

|
#24
Blue Ridge Dr
Richmond, TX 77469
|
1,517 sq. feet
|
- baths 3 beds |
show details | |

|
#25
Oxford Lake Dr
Rosenberg, TX 77471
|
2,636 sq. feet
|
- baths 4 beds |
show details | |

|
#26
Water Trace Ct
Richmond, TX 77469
|
2,715 sq. feet
|
- baths 4 beds |
show details | |

|
#27
Riverwood Dr
Richmond, TX 77469
|
930 sq. feet
|
- baths 2 beds |
show details | |

|
#28
Schubach Dr
Sugar Land, TX 77479
|
4,425 sq. feet
|
- baths 6 beds |
show details | |

|
#29
Silent Deep Dr
Richmond, TX 77469
|
1,625 sq. feet
|
- baths 3 beds |
show details | |

|
#30
Smokey Hill Ct
Richmond, TX 77469
|
1,521 sq. feet
|
- baths 3 beds |
show details |
| Photo | Address | Area | Beds / Baths | Price | Details |
|---|---|---|---|---|---|

|
#31
Emerald Glen Ct
Sugar Land, TX 77479
|
2,667 sq. feet
|
- baths 4 beds |
show details | |

|
#32
Savannah Moss Dr
Richmond, TX 77469
|
2,434 sq. feet
|
- baths 3 beds |
show details | |

|
#33
Surrey Ct
Richmond, TX 77406
|
2,960 sq. feet
|
- baths 4 beds |
show details | |

|
#34
Canyonwood Park Ln
Richmond, TX 77469
|
3,449 sq. feet
|
- baths 5 beds |
show details | |

|
#35
Briar Meadow Dr
Sugar Land, TX 77479
|
2,979 sq. feet
|
- baths 4 beds |
show details | |

|
#36
Avenue E
Rosenberg, TX 77471
|
1,468 sq. feet
|
- baths 3 beds |
show details | |

|
#37
Copper Stream Ln
Richmond, TX 77406
|
1,933 sq. feet
|
- baths 3 beds |
show details | |

|
#38
Water Bluff Ln
Richmond, TX 77406
|
5,552 sq. feet
|
- baths 5 beds |
show details | |

|
#39
Riverway Bluff Ln
Richmond, TX 77406
|
2,262 sq. feet
|
- baths 3 beds |
show details | |

|
#40
Little River Ct
Richmond, TX 77406
|
4,088 sq. feet
|
- baths 4 beds |
show details |
| Photo | Address | Area | Beds / Baths | Price | Details |
|---|---|---|---|---|---|

|
#41
Zachary Ln
Sugar Land, TX 77479
|
3,013 sq. feet
|
- baths 3 beds |
show details | |

|
#42
Schiller Park Ln
Sugar Land, TX 77479
|
2,236 sq. feet
|
- baths 3 beds |
show details | |

|
#43
Land Grant Dr
Richmond, TX 77406
|
2,076 sq. feet
|
- baths 4 beds |
show details | |

|
#44
Colony West Dr
Richmond, TX 77406
|
8,084 sq. feet
|
- baths 5 beds |
show details | |

|
#45
Mistycreek Dr
Richmond, TX 77406
|
1,972 sq. feet
|
- baths 3 beds |
show details | |

|
#46
Teal Brook Ln
Sugar Land, TX 77479
|
1,937 sq. feet
|
- baths 3 beds |
show details | |

|
#47
Crestwood Dr
Richmond, TX 77469
|
2,008 sq. feet
|
- baths 3 beds |
show details | |

|
#48
Desert Palms Ln
Rosenberg, TX 77471
|
2,910 sq. feet
|
- baths 4 beds |
show details | |

|
#49
Nautical Ln
Richmond, TX 77469
|
3,110 sq. feet
|
- baths 5 beds |
show details | |

|
Check over 1 million property listings on Foreclosure.com!
|
browse all offers | |||

Latest news about housing in Needville, TX collected exclusively by city-data.com from local newspapers, TV, and radio stations

 | Help choose my next home's location! (29 replies) |
| Rosenberg New construction Homes (6 replies) |
| Housing market in Katy (61 replies) |
| House budget on a 2k/month PITI? (11 replies) |
| Should I relocate to Houston??? (23 replies) |
| Better overall investment: Katy or Sugar Land (33 replies) |

Median year apartment built: 1954
Household type by relationship:
Households: 3,287- Male householders: 776 (174 living alone), Female householders: 516 (70 living alone)
577 spouses (577 opposite-sex spouses), 49 unmarried partners, (49 opposite-sex unmarried partners), 1,024 children (986 natural, 10 adopted, 26 stepchildren), 86 grandchildren, 35 brothers or sisters, 66 parents, 0 foster children, 22 other relatives, 54 non-relatives
- In group quarters: 77
Size of family households: 438 2-persons, 331 3-persons, 129 4-persons, 100 5-persons, 17 6-persons.
Size of nonfamily households: 265 1-person, 54 2-persons, 6 3-persons.
389 married couples with children.
198 single-parent households (29 men, 169 women).
71.6% of residents of Needville speak English at home.
28.9% of residents speak Spanish at home (84% speak English very well, 7% speak English well, 7% speak English not well, 2% don't speak English at all).
0.1% of residents speak other Indo-European language at home (100% speak English well).
Foreign born population: 130 (4.0%)
(22.3% of them are naturalized citizens)
| Here: | 5.6 |
| State: | 6.3 |
| Here: | 5.7 |
| State: | 4.0 |
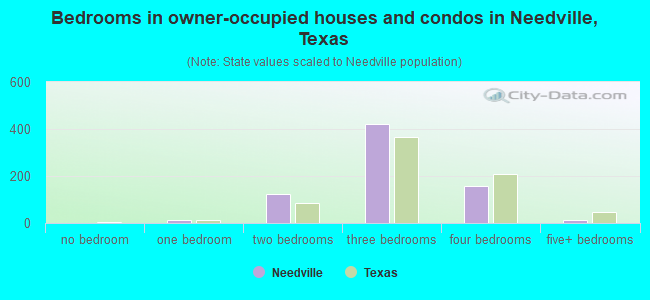
- Bedrooms in owner-occupied houses and condos in Needville, Texas
- 0no bedroom
- 121 bedroom
- 1222 bedrooms
- 4213 bedrooms
- 1564 bedrooms
- 115+ bedrooms
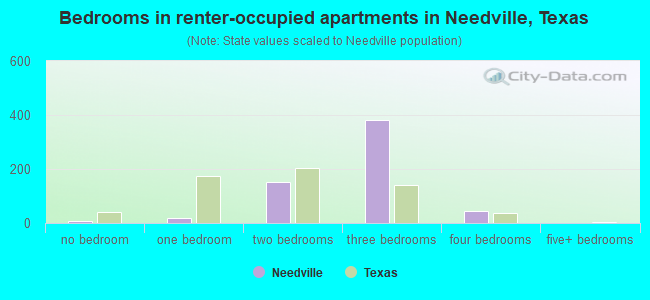
- Bedrooms in renter-occupied apartments in Needville, Texas
- 7no bedroom
- 171 bedroom
- 1522 bedrooms
- 3823 bedrooms
- 434 bedrooms
- 05+ bedrooms
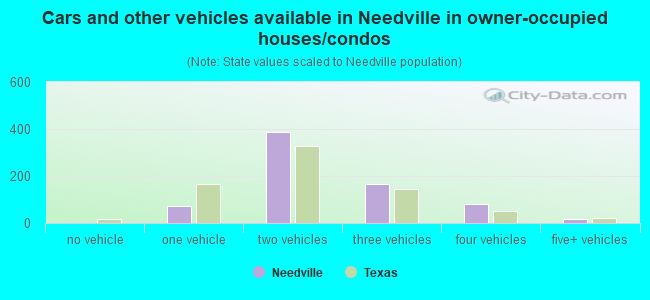
- Cars and other vehicles available in Needville in owner-occupied houses/condos
- 0no vehicle
- 741 vehicle
- 3862 vehicles
- 1643 vehicles
- 804 vehicles
- 195+ vehicles
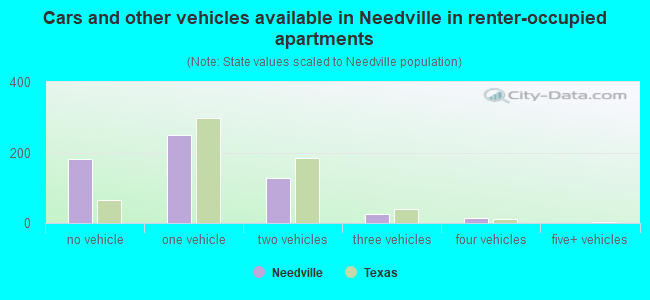
- Cars and other vehicles available in Needville in renter-occupied apartments
- 181no vehicle
- 2511 vehicle
- 1282 vehicles
- 263 vehicles
- 144 vehicles
- 05+ vehicles
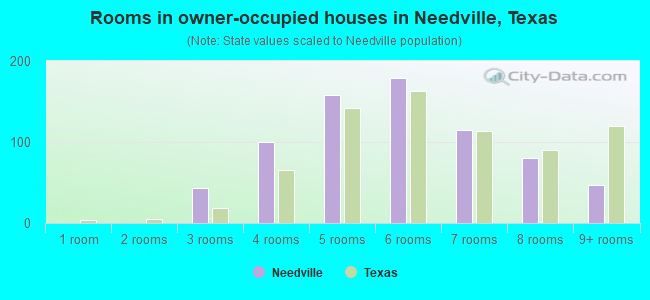
- Rooms in owner-occupied houses in Needville, Texas
- 01 room
- 02 rooms
- 433 rooms
- 1004 rooms
- 1585 rooms
- 1796 rooms
- 1157 rooms
- 808 rooms
- 479+ rooms
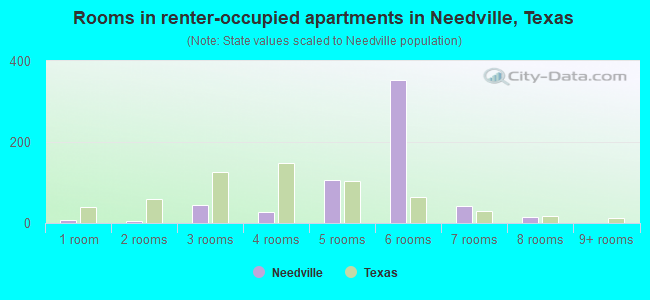
- Rooms in renter-occupied apartments in Needville, Texas
- 71 room
- 52 rooms
- 453 rooms
- 284 rooms
- 1055 rooms
- 3546 rooms
- 437 rooms
- 148 rooms
- 09+ rooms
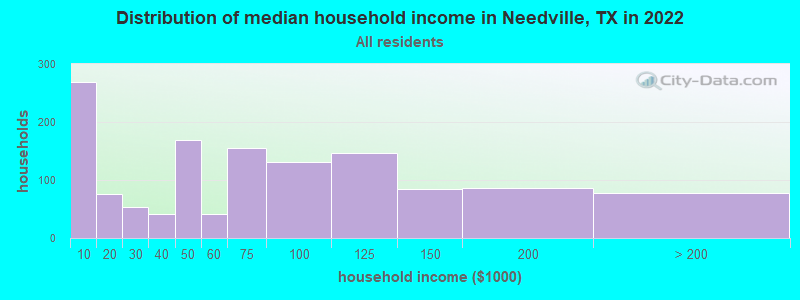
Needville, TX household income distribution

- 269Less than $10,000
- 76$10,000 to $19,999
- 53$20,000 to $29,999
- 41$30,000 to $39,999
- 169$40,000 to $49,999
- 41$50,000 to $59,999
- 155$60,000 to $74,999
- 131$75,000 to $99,999
- 147$100,000 to $124,999
- 85$125,000 to $149,999
- 86$150,000 to $199,999
- 78$200,000 or more
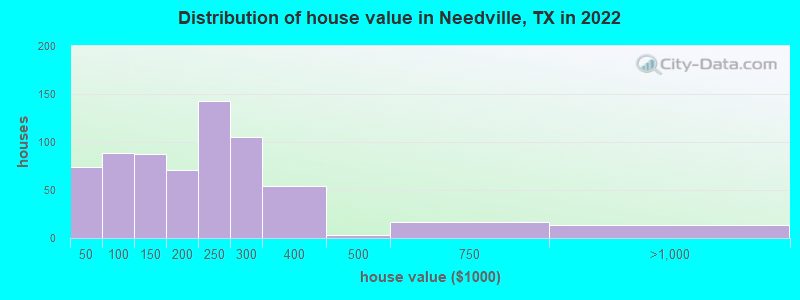
Home value of owner - occupied houses in 2022 in Needville, TX
-
- 23Less than $10,000
- 29$10,000 to $14,999
- 2$15,000 to $19,999
- 2$20,000 to $24,999
- 15$40,000 to $49,999
- 31$70,000 to $79,999
- 32$80,000 to $89,999
- 8$90,000 to $99,999
- 31$100,000 to $124,999
- 55$125,000 to $149,999
- 39$150,000 to $174,999
- 31$175,000 to $199,999
- 142$200,000 to $249,999
- 104$250,000 to $299,999
- 53$300,000 to $399,999
- 3$400,000 to $499,999
- 17$500,000 to $749,999
- 14$750,000 to $999,999
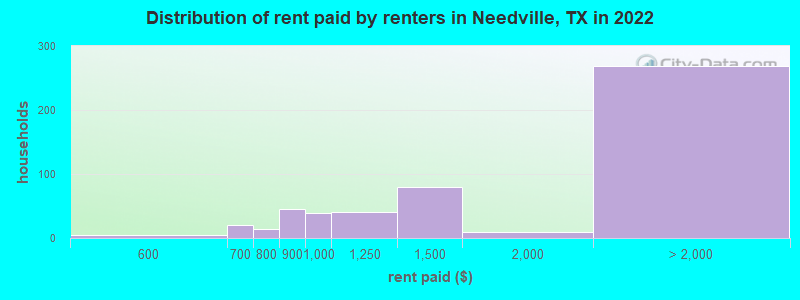
Rent paid by renters in 2022 in Needville, TX
-
- 3$550 to $599
- 20$650 to $699
- 14$750 to $799
- 46$800 to $899
- 39$900 to $999
- 40$1,000 to $1,249
- 80$1,250 to $1,499
- 8$1,500 to $1,999
- 268No cash rent
Percentage of workers working in this county: 73.5%
Number of people working at home: 140 (9.9% of all workers)
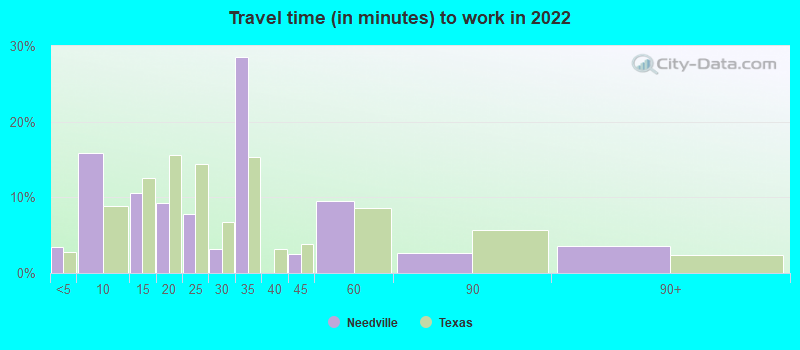
Travel time to work (commute)
- Less than 5 minutes: 20
- 5 to 9 minutes: 106
- 10 to 14 minutes: 69
- 15 to 19 minutes: 125
- 20 to 24 minutes: 143
- 25 to 29 minutes: 77
- 30 to 34 minutes: 170
- 35 to 39 minutes: 111
- 40 to 44 minutes: 103
- 45 to 59 minutes: 157
- 60 to 89 minutes: 167
- 90 or more minutes: 10
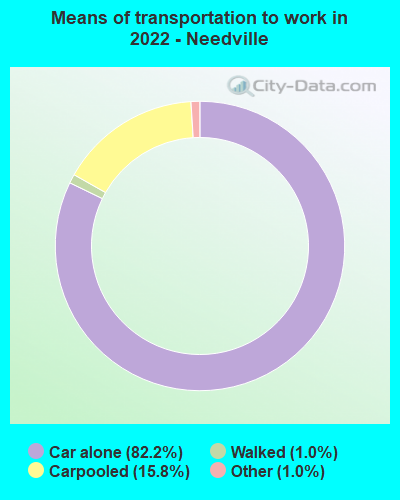
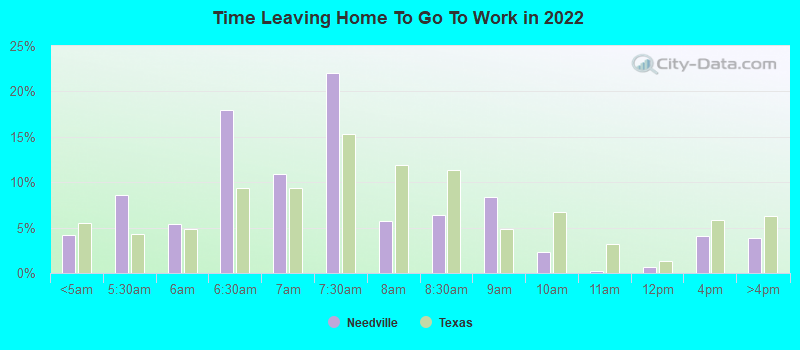
Means of transportation to work:
- Drove a car alone: 597 (66.6%)
- Carpooled: 135 (15.1%)
- Taxi: 9 (1.0%)
- Walked: 9 (1.0%)
- Worked at home: 140 (15.6%)
- Unemployment by race in 2022
- Unemployment rate for White non-Hispanic residents
- 1.3%Males
- 1.2%Females
- Unemployment rate for Hispanic or Latino residents
- 2.5%Females

- Year of entry for the foreign-born population in Needville, Texas
- 02010 or later
- 152000 to 2009
- 511990 to 1999
- 51980 to 1989
- 171970 to 1979
- 28Before 1970
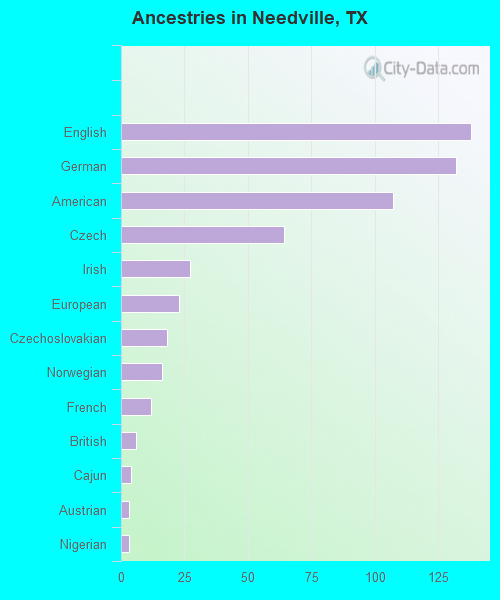
First ancestries reported:
- English: 138 (6.4%)
- German: 132 (6.2%)
- American: 107 (5.0%)
- Czech: 64 (3.0%)
- Irish: 27 (1.3%)
- European: 23 (1.1%)
- Czechoslovakian: 18 (0.8%)
- Norwegian: 16 (0.7%)
- French: 12 (0.6%)
- British: 6 (0.3%)
- Cajun: 4 (0.2%)
- Austrian: 3 (0.1%)
- Nigerian: 3 (0.1%)
Most common places of birth for foreign-born residents (%):
| Needville: | 95.2% (119) |
| Texas: | 48.4% (2,411,723) |
Place of birth for U.S.-born residents:
- This state: 2,735
- Other state: 376
- Northeast: 14
- Midwest: 63
- South: 176
- West: 127
95.8% of Needville residents lived in the same house 1 years ago.
Out of people who lived in different houses, 39.9% lived in this county.
Out of people who lived in different counties, 100.0% lived in Texas.
| Needville: | 95.8% |
| State average: | 85.7% |
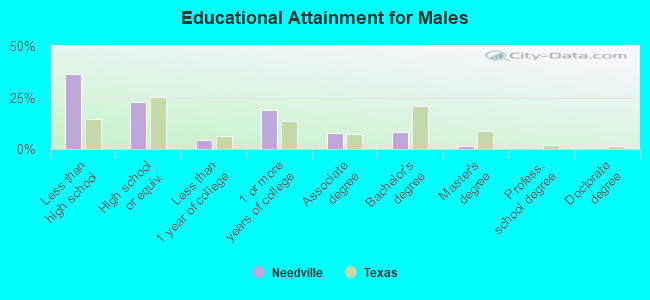
Education attainment for males 25 years and older:
- No schooling: 42
- Nursery to 4th grade: 10
- 5th and 6th grade: 0
- 7th and 8th grade: 34
- 9th grade: 202
- 10th grade: 160
- 11th grade: 4
- 12th grade, no diploma: 18
- High school graduate (or equivalency): 292
- Less than 1 year of college: 59
- Some college more than 1 year, no degree: 241
- Associate degree: 97
- Bachelor's degree: 108
- Master's degree: 19
- Professional school degree: 0
- Doctorate degree: 0
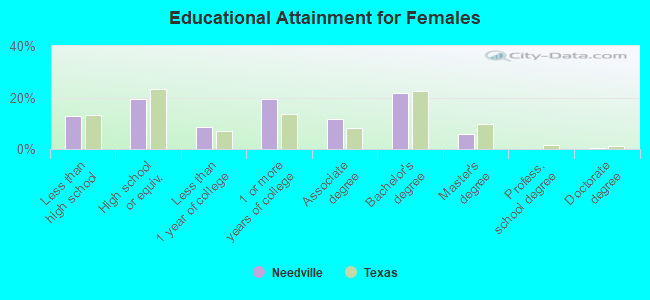
Education attainment for females 25 years and older:
- No schooling: 28
- Nursery to 4th grade: 0
- 5th and 6th grade: 20
- 7th and 8th grade: 13
- 9th grade: 19
- 10th grade: 14
- 11th grade: 0
- 12th grade, no diploma: 31
- High school graduate (or equivalency): 187
- Less than 1 year of college: 83
- Some college more than 1 year, no degree: 188
- Associate degree: 111
- Bachelor's degree: 211
- Master's degree: 57
- Professional school degree: 0
- Doctorate degree: 4


Housing units in structures:
- One, detached: 1,205
- 3 or 4: 10
- 5 to 9: 58
- 20 to 49: 9
- Mobile homes: 128
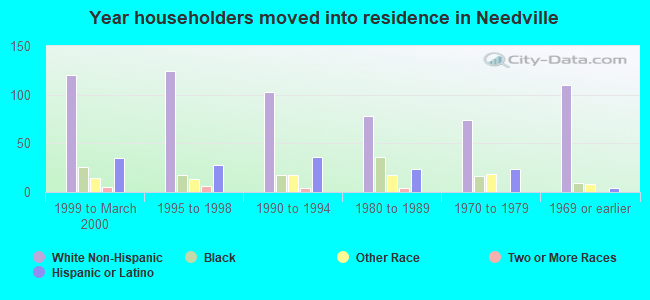
House/condo owner moved in on average 11 years ago
Renter moved in on average 32 years ago
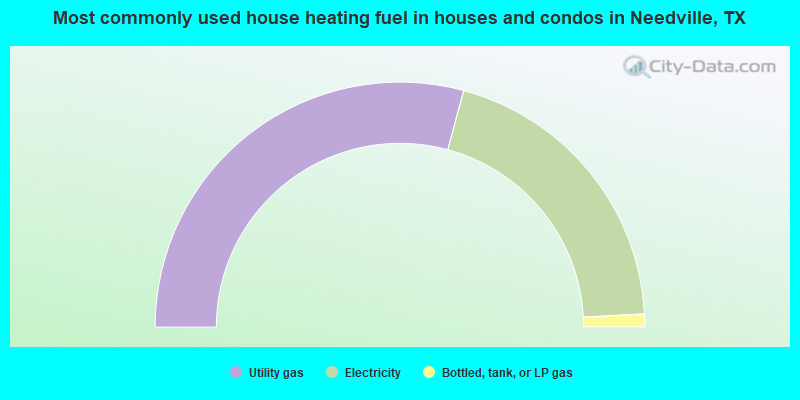
- 58.4%Utility gas
- 39.9%Electricity
- 1.7%Bottled, tank, or LP gas
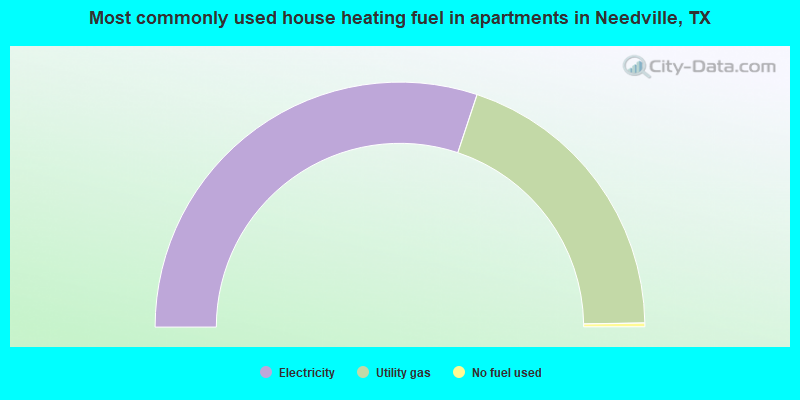
- 60.2%Electricity
- 39.3%Utility gas
- 0.5%No fuel used
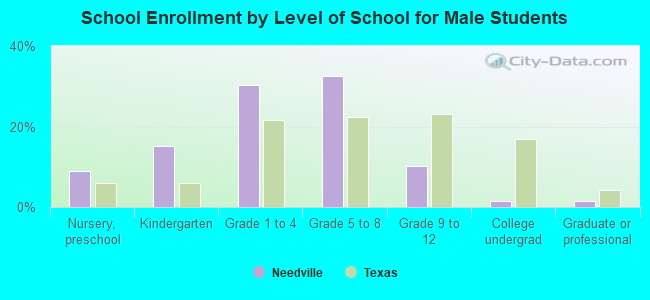
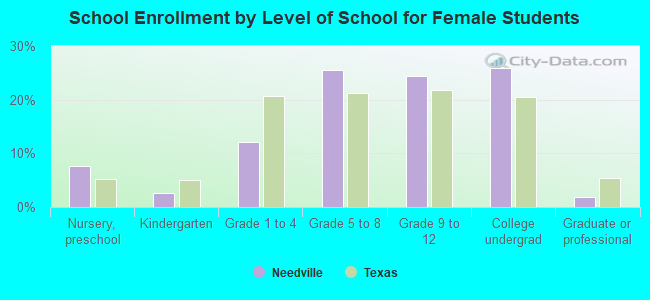
Private vs. public school enrollment:
| Here: | 22.2% |
| Texas: | 8.8% |
| Here: | 10.0% |
| Texas: | 8.0% |
| Here: | 0.0% |
| Texas: | 16.2% |