New Britain, CT (Connecticut) Houses and Residents
Estimated median house or condo value in 2022: $221,200 (it was $97,600 in 2000 )
New Britain:
$221,200Connecticut:
$347,200
Lower value quartile - upper value quartile: $164,500 - $287,600Mean price in 2022: Detached houses: $265,925 Here:
$265,925State:
$503,946
Townhouses or other attached units: $221,036 Here:
$221,036State:
$304,959
In 2-unit structures: $266,440 Here:
$266,440State:
$304,133
In 3-to-4-unit structures: $134,716 Here:
$134,716State:
$272,970
In 5-or-more-unit structures: $143,244 Here:
$143,244State:
$249,308
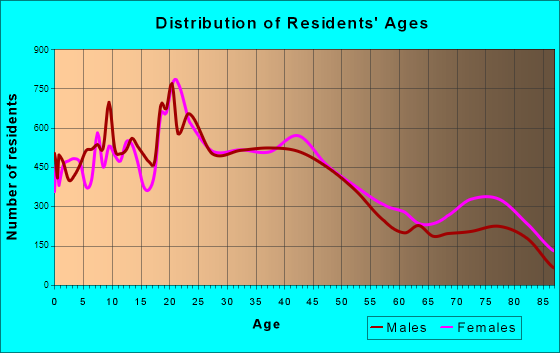
Total population: 72,878 (Urban population: 71,538, Rural population: 0)
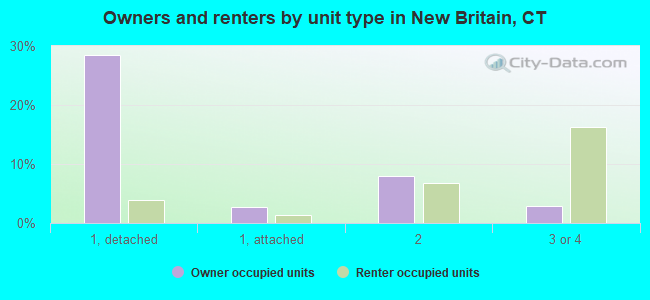
Houses: 32,915 (30,326 occupied: 12,965 owner occupied, 17,361 renter occupied )
% of renters here:
57%State:
34%
Housing density: 2,468 houses/condos per square mile
Median price asked for vacant for-sale houses and condos in 2022: $524,631.
Median contract rent in 2022: $907 (lower quartile is $716, upper quartile is $1,142)
Median rent asked for vacant for-rent units in 2022: $1,382
Median gross rent in New Britain, CT in 2022: $1,112
Housing units in New Britain with a mortgage: 8,312 (1,713 second mortgage, 0 home equity loan, 935 both second mortgage and home equity loan )Houses without a mortgage: 496
Median household income for houses/condos with a mortgage: $111,204
Median household income for apartments without a mortgage: $48,054
Median monthly housing costs: $1,190
Data:
Median house or condo value ($)
Median house or condo value ($ change since 2000)
Median house or condo value ($) - White
Median house or condo value ($) - Black or African American
Median house or condo value ($) - Asian
Median house or condo value ($) - Hispanic or Latino
Median house or condo value ($) - American Indian and Alaska Native
Median house or condo value ($) - Multirace
Median house or condo value ($) - Other Race
Median price asked for mobile homes ($)
Household density (households per square mile)
Mean house or condo value by units in structure - 1, detached ($)
Mean house or condo value by units in structure - 1, attached ($)
Mean house or condo value by units in structure - 2 ($)
Mean house or condo value by units in structure by units in structure - 3 or 4 ($)
Mean house or condo value by units in structure - 5 or more ($)
Mean house or condo value by units in structure - Boat, RV, van, etc. ($)
Mean house or condo value by units in structure - Mobile home ($)
Median contract rent ($)
Median contract rent - Lower quartile ($)
Median contract rent - Upper quartile ($)
Median gross rent ($)
Urban houses (%)
Rural houses (%)
Houses occupied (%)
Houses occupied (% change since 2000)
Houses owner occupied (%)
Houses owner occupied (% change since 2000)
Houses renter occupied (%)
Houses renter occupied (% change since 2000)
Vacant housing units - For rent (%)
Vacant housing units - For rent (% change since 2000)
Vacant housing units - For sale only (%)
Vacant housing units - For sale only (% change since 2000)
Vacant housing units - Rented or sold, not occupied (%)
Vacant housing units - Rented or sold, not occupied (% change since 2000)
Vacant housing units - For seasonal, recreational, or occasional use (%)
Vacant housing units - For seasonal, recreational, or occasional use (% change since 2000)
Vacant housing units - For migrant workers (%)
Vacant housing units - For migrant workers (% change since 2000)
Vacant housing units - Other vacant (%)
Vacant housing units - Other vacant (% change since 2000)
Median monthly housing costs ($)
Median household income for houses/condos with a mortgage ($)
Median household income for houses/condos without a mortgage ($)
Median household income ($)
Median household income ($) - White
Median household income ($) - Black or African American
Median household income ($) - Asian
Median household income ($) - Hispanic or Latino
Median household income ($) - American Indian and Alaska Native
Median household income ($) - Multirace
Median household income ($) - Other Race
Mortgage status - with mortgage (%)
Mortgage status - with second mortgage (%)
Mortgage status - with home equity loan (%)
Mortgage status - with both second mortgage and home equity loan (%)
Mortgage status - without a mortgage (%)
Median year house/condo built
Median year apartment built
Household type by relationship - Male householder living alone (%)
Household type by relationship - Male householder not living alone (%)
Household type by relationship - Female householder living alone (%)
Household type by relationship - Female householder not living alone (%)
Household type by relationship - Opposite-Sex spouse (%)
Household type by relationship - Same-Sex spouse (%)
Household type by relationship - Opposite-Sex unmarried partner (%)
Household type by relationship - Same-Sex unmarried partner (%)
Household type by relationship - In group quarters (%)
Size of family households - 2-person household (%)
Size of family households - 3-person household (%)
Size of family households - 4-person household (%)
Size of family households - 5-person household (%)
Size of family households - 6-person household (%)
Size of family households - 7-or-more-person household (%)
Size of nonfamily households - 1-person household (%)
Size of nonfamily households - 2-person household (%)
Size of nonfamily households - 3-person household (%)
Size of nonfamily households - 4-person household (%)
Size of nonfamily households - 5-person household (%)
Size of nonfamily households - 6-person household (%)
Size of nonfamily households - 7-or-moreperson household (%)
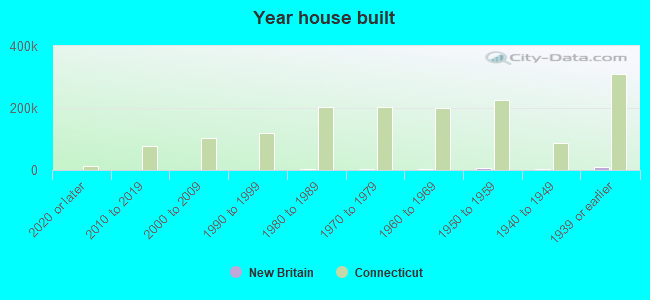
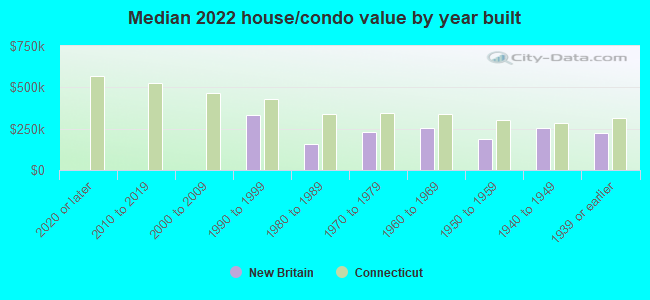
Year house built - Built 2010 or later (%)
Year house built - Built 2000 to 2009 (%)
Year house built - Built 1990 to 1999 (%)
Year house built - Built 1980 to 1989 (%)
Year house built - Built 1970 to 1979 (%)
Year house built - Built 1960 to 1969 (%)
Year house built - Built 1950 to 1959 (%)
Year house built - Built 1940 to 1949 (%)
Year house built - Built 1939 or earlier (%)
Median number of rooms in houses and condos
Median number of rooms in apartments
Median number of bedrooms in owner occupied houses
Mean number of bedrooms in owner occupied houses
Median number of bedrooms in renter occupied houses
Mean number of bedrooms in renter occupied houses
Median number of vehichles in owner occupied houses
Mean number of vehichles in owner occupied houses
Median number of vehichles in renter occupied houses
Mean number of vehichles in renter occupied houses
Rooms in owner-occupied houses - 1 room (%)
Rooms in owner-occupied houses - 2 rooms (%)
Rooms in owner-occupied houses - 3 rooms (%)
Rooms in owner-occupied houses - 4 rooms (%)
Rooms in owner-occupied houses - 5 rooms (%)
Rooms in owner-occupied houses - 6 rooms (%)
Rooms in owner-occupied houses - 7 rooms (%)
Rooms in owner-occupied houses - 8 rooms (%)
Rooms in owner-occupied houses - 9+ rooms (%)
Rooms in renter-occupied houses - 1 room (%)
Rooms in renter-occupied houses - 2 rooms (%)
Rooms in renter-occupied houses - 3 rooms (%)
Rooms in renter-occupied houses - 4 rooms (%)
Rooms in renter-occupied houses - 5 rooms (%)
Rooms in renter-occupied houses - 6 rooms (%)
Rooms in renter-occupied houses - 7 rooms (%)
Rooms in renter-occupied houses - 8 rooms (%)
Rooms in renter-occupied houses - 9+ rooms (%)
Bedrooms in owner-occupied houses - no bedrooms (%)
Bedrooms in owner-occupied houses - 1 bedroom (%)
Bedrooms in owner-occupied houses - 2 bedrooms (%)
Bedrooms in owner-occupied houses - 3 bedrooms (%)
Bedrooms in owner-occupied houses - 4 bedrooms (%)
Bedrooms in owner-occupied houses - 5+ bedrooms (%)
Bedrooms in renter-occupied houses - no bedrooms (%)
Bedrooms in renter-occupied houses - 1 bedroom (%)
Bedrooms in renter-occupied houses - 2 bedrooms (%)
Bedrooms in renter-occupied houses - 3 bedrooms (%)
Bedrooms in renter-occupied houses - 4 bedrooms (%)
Bedrooms in renter-occupied houses - 5+ bedrooms (%)
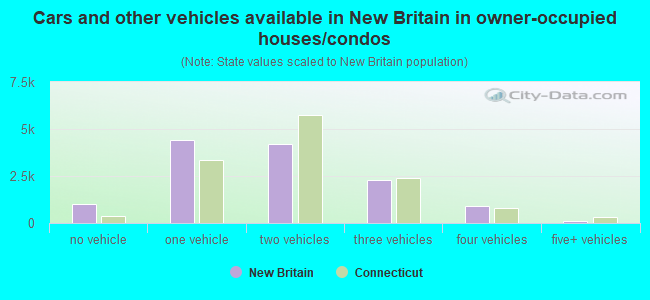
Vehicles available in owner-occupied houses - no vehicle available (%)
Vehicles available in owner-occupied houses - 1 vehicle available(%)
Vehicles available in owner-occupied houses - 2 Vehicles available (%)
Vehicles available in owner-occupied houses - 3 Vehicles available (%)
Vehicles available in owner-occupied houses - 4 Vehicles available (%)
Vehicles available in owner-occupied houses - 5+ Vehicles available (%)
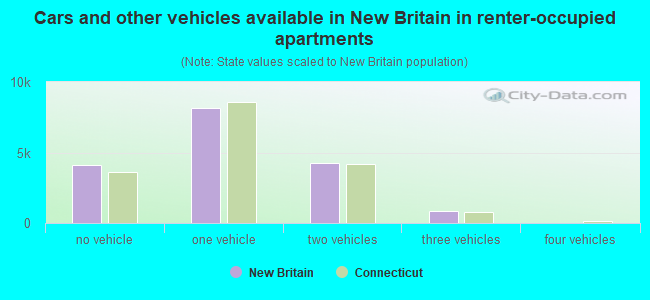
Vehicles available in renter-occupied houses - no vehicle available (%)
Vehicles available in renter-occupied houses - 1 vehicle available (%)
Vehicles available in renter-occupied houses - 2 Vehicles available (%)
Vehicles available in renter-occupied houses - 3 Vehicles available (%)
Vehicles available in renter-occupied houses - 4 Vehicles available (%)
Vehicles available in renter-occupied houses - 5+ Vehicles available (%)
Housing units in structures - 1, detached (%)
Housing units in structures - 1, attached (%)
Housing units in structures - 2 (%)
Housing units in structures - 3 or 4 (%)
Housing units in structures - 5 to 9 (%)
Housing units in structures - 10 to 19 (%)
Housing units in structures - 20 to 49 (%)
Housing units in structures - 50 or more (%)
Housing units in structures - Mobile home (%)
Housing units in structures - Boat, RV, van, etc. (%)
Housing units in structures - Owners - 1, detached (%)
Housing units in structures - Owners - 1, attached (%)
Housing units in structures - Owners - 2 (%)
Housing units in structures - Owners - 3 or 4 (%)
Housing units in structures - Owners - 5 to 9 (%)
Housing units in structures - Owners - 10 to 19 (%)
Housing units in structures - Owners - 20 to 49 (%)
Housing units in structures - Owners - 50 or more (%)
Housing units in structures - Owners - Mobile home (%)
Housing units in structures - Owners - Boat, RV, van, etc. (%)
Housing units in structures - Renters - 1, detached (%)
Housing units in structures - Renters - 1, attached (%)
Housing units in structures - Renters - 2 (%)
Housing units in structures - Renters - 3 or 4 (%)
Housing units in structures - Renters - 5 to 9 (%)
Housing units in structures - Renters - 10 to 19 (%)
Housing units in structures - Renters - 20 to 49 (%)
Housing units in structures - Renters - 50 or more (%)
Housing units in structures - Renters - Mobile home (%)
Housing units in structures - Renters - Boat, RV, van, etc. (%)
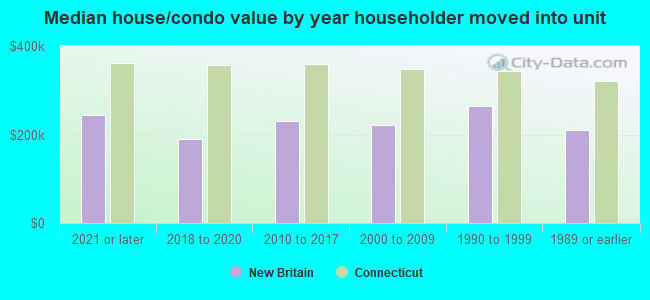
House/condo owner moved in on average (years ago)
Renter moved in on average (years ago)
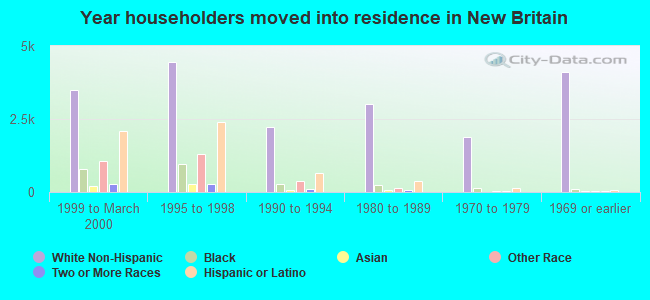
Year householder moved into unit - Moved in 1999 to March 2000 (%)
Year householder moved into unit - Moved in 1999 to March 2000 (%) - White
Year householder moved into unit - Moved in 1999 to March 2000 (%) - Black or African American
Year householder moved into unit - Moved in 1999 to March 2000 (%) - Asian
Year householder moved into unit - Moved in 1999 to March 2000 (%) - Hispanic or Latino
Year householder moved into unit - Moved in 1999 to March 2000 (%) - American Indian and Alaska Native
Year householder moved into unit - Moved in 1999 to March 2000 (%) - Multirace
Year householder moved into unit - Moved in 1999 to March 2000 (%) - Other Race
Year householder moved into unit - Moved in 1995 to 1998 (%)
Year householder moved into unit - Moved in 1995 to 1998 (%) - White
Year householder moved into unit - Moved in 1995 to 1998 (%) - Black or African American
Year householder moved into unit - Moved in 1995 to 1998 (%) - Asian
Year householder moved into unit - Moved in 1995 to 1998 (%) - Hispanic or Latino
Year householder moved into unit - Moved in 1995 to 1998 (%) - American Indian and Alaska Native
Year householder moved into unit - Moved in 1995 to 1998 (%) - Multirace
Year householder moved into unit - Moved in 1995 to 1998 (%) - Other Race
Year householder moved into unit - Moved in 1990 to 1994 (%)
Year householder moved into unit - Moved in 1990 to 1994 (%) - White
Year householder moved into unit - Moved in 1990 to 1994 (%) - Black or African American
Year householder moved into unit - Moved in 1990 to 1994 (%) - Asian
Year householder moved into unit - Moved in 1990 to 1994 (%) - Hispanic or Latino
Year householder moved into unit - Moved in 1990 to 1994 (%) - American Indian and Alaska Native
Year householder moved into unit - Moved in 1990 to 1994 (%) - Multirace
Year householder moved into unit - Moved in 1990 to 1994 (%) - Other Race
Year householder moved into unit - Moved in 1980 to 1989 (%)
Year householder moved into unit - Moved in 1980 to 1989 (%) - White
Year householder moved into unit - Moved in 1980 to 1989 (%) - Black or African American
Year householder moved into unit - Moved in 1980 to 1989 (%) - Asian
Year householder moved into unit - Moved in 1980 to 1989 (%) - Hispanic or Latino
Year householder moved into unit - Moved in 1980 to 1989 (%) - American Indian and Alaska Native
Year householder moved into unit - Moved in 1980 to 1989 (%) - Multirace
Year householder moved into unit - Moved in 1980 to 1989 (%) - Other Race
Year householder moved into unit - Moved in 1970 to 1979 (%)
Year householder moved into unit - Moved in 1970 to 1979 (%) - White
Year householder moved into unit - Moved in 1970 to 1979 (%) - Black or African American
Year householder moved into unit - Moved in 1970 to 1979 (%) - Asian
Year householder moved into unit - Moved in 1970 to 1979 (%) - Hispanic or Latino
Year householder moved into unit - Moved in 1970 to 1979 (%) - American Indian and Alaska Native
Year householder moved into unit - Moved in 1970 to 1979 (%) - Multirace
Year householder moved into unit - Moved in 1970 to 1979 (%) - Other Race
Year householder moved into unit - Moved in 1969 or earlier (%)
Year householder moved into unit - Moved in 1969 or earlier (%) - White
Year householder moved into unit - Moved in 1969 or earlier (%) - Black or African American
Year householder moved into unit - Moved in 1969 or earlier (%) - Asian
Year householder moved into unit - Moved in 1969 or earlier (%) - Hispanic or Latino
Year householder moved into unit - Moved in 1969 or earlier (%) - American Indian and Alaska Native
Year householder moved into unit - Moved in 1969 or earlier (%) - Multirace
Year householder moved into unit - Moved in 1969 or earlier (%) - Other Race
Housing units lacking complete plumbing facilities (%)
Housing units lacking complete kitchen facilities (%)
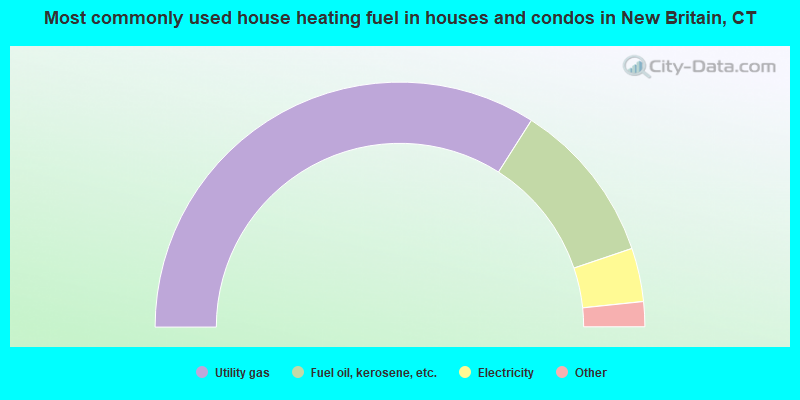
House heating fuel used in houses and condos - Utility gas (%)
House heating fuel used in houses and condos - Bottled, tank, or LP gas (%)
House heating fuel used in houses and condos - Electricity (%)
House heating fuel used in houses and condos - Fuel oil, kerosene, etc. (%)
House heating fuel used in houses and condos - Coal or coke (%)
House heating fuel used in houses and condos - Wood (%)
House heating fuel used in houses and condos - Solar energy (%)
House heating fuel used in houses and condos - Other fuel (%)
House heating fuel used in houses and condos - No fuel used (%)
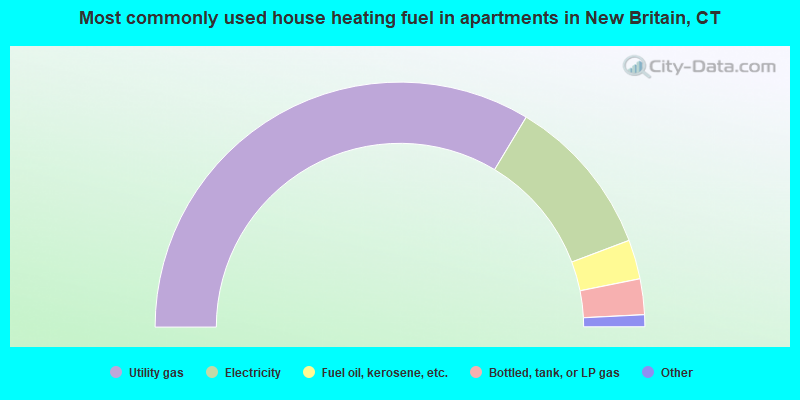
House heating fuel used in apartments - Utility gas (%)
House heating fuel used in apartments - Bottled, tank, or LP gas (%)
House heating fuel used in apartments - Electricity (%)
House heating fuel used in apartments - Fuel oil, kerosene, etc. (%)
House heating fuel used in apartments - Coal or coke (%)
House heating fuel used in apartments - Wood (%)
House heating fuel used in apartments - Solar energy (%)
House heating fuel used in apartments - Other fuel (%)
House heating fuel used in apartments - No fuel used (%)
Median year house/condo built: 1955Median year apartment built: 1956Household type by relationship:
Households: 74,408
Male householders: 13,884 (5,713 living alone ), Female householders: 16,442 (5,521 living alone )8,424 spouses (8,320 opposite-sex spouses ), 3,417 unmarried partners , (3,327 opposite-sex unmarried partners ), 19,633 children (18,017 natural , 171 adopted , 1,445 stepchildren ), 1,428 grandchildren , 1,668 brothers or sisters , 2,321 parents , 119 foster children , 2,182 other relatives , 1,267 non-relatives In group quarters: 3,623
Size of family households: 6,482 2-persons , 3,784 3-persons , 4,031 4-persons , 1,325 5-persons , 525 6-persons , 246 7-or-more-persons .
Size of nonfamily households: 11,234 1-person , 2,699 2-persons .
6,814 married couples with children. single-parent households (461 men , 5,776 women ).
50.6% of residents of New Britain speak English at home. of residents speak Spanish at home (60% speak English very well , 18% speak English well , 14% speak English not well , 8% don't speak English at all ).of residents speak other Indo-European language at home (58% speak English very well , 21% speak English well , 14% speak English not well , 8% don't speak English at all ).of residents speak Asian or Pacific Island language at home (33% speak English very well , 25% speak English well , 33% speak English not well , 9% don't speak English at all ).of residents speak other language at home (73% speak English very well , 9% speak English well , 18% speak English not well ).
Foreign born population: 15,156 (20.4%)of them are naturalized citizens )
Median number of rooms in houses and condos:
Median number of rooms in apartments
Owner-occupied Renter-occupied
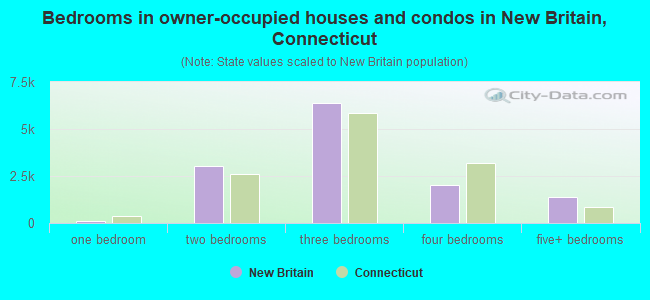
Bedrooms in owner-occupied houses and condos in New Britain, Connecticut
0 no bedroom 111 1 bedroom 3,046 2 bedrooms 6,380 3 bedrooms 2,025 4 bedrooms 1,403 5+ bedrooms
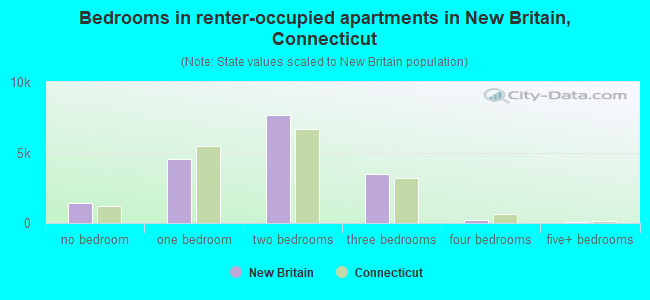
Bedrooms in renter-occupied apartments in New Britain, Connecticut
1,421 no bedroom 4,570 1 bedroom 7,653 2 bedrooms 3,458 3 bedrooms 197 4 bedrooms 62 5+ bedrooms
Owner-occupied Renter-occupied
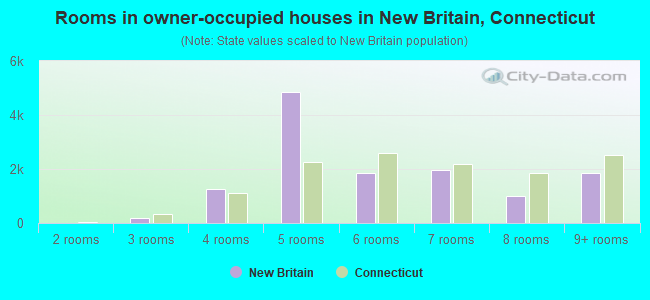
Rooms in owner-occupied houses in New Britain, Connecticut
0 1 room 0 2 rooms 189 3 rooms 1,263 4 rooms 4,848 5 rooms 1,847 6 rooms 1,956 7 rooms 1,014 8 rooms 1,848 9+ rooms
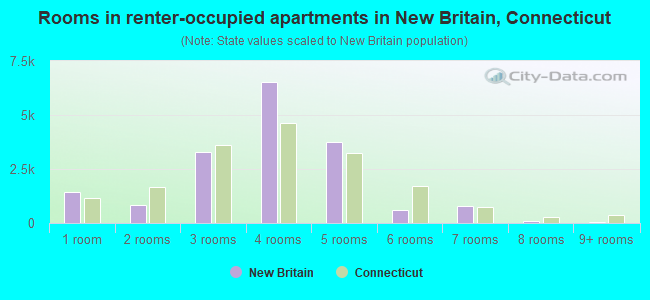
Rooms in renter-occupied apartments in New Britain, Connecticut
1,421 1 room 812 2 rooms 3,278 3 rooms 6,549 4 rooms 3,739 5 rooms 620 6 rooms 785 7 rooms 95 8 rooms 62 9+ rooms
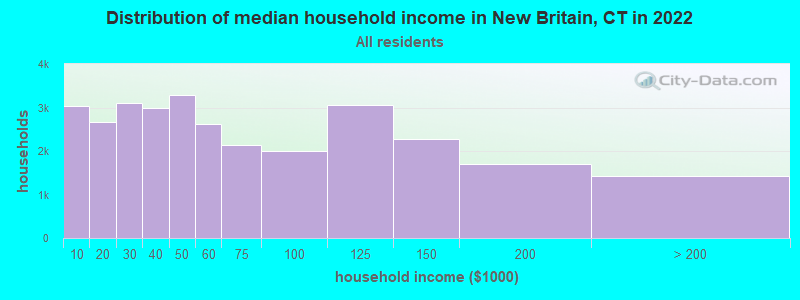
New Britain, CT household income distribution 3,032 Less than $10,0002,677 $10,000 to $19,9993,114 $20,000 to $29,9992,999 $30,000 to $39,9993,277 $40,000 to $49,9992,624 $50,000 to $59,9992,127 $60,000 to $74,9991,994 $75,000 to $99,9993,060 $100,000 to $124,9992,280 $125,000 to $149,9991,707 $150,000 to $199,9991,435 $200,000 or more
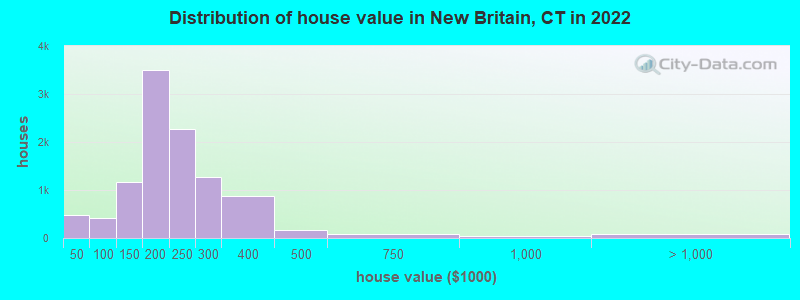
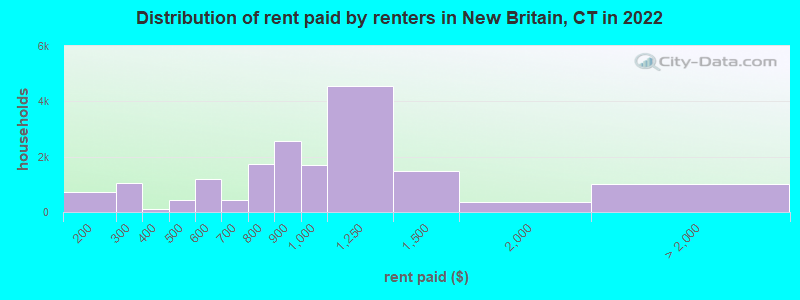
Home value of owner - occupied houses in 2022 in New Britain, CT 316 Less than $10,00064 $10,000 to $14,99948 $15,000 to $19,99932 $20,000 to $24,99921 $40,000 to $49,99924 $50,000 to $59,999105 $60,000 to $69,99922 $70,000 to $79,999142 $80,000 to $89,99997 $90,000 to $99,999576 $100,000 to $124,999592 $125,000 to $149,9991,989 $150,000 to $174,9991,507 $175,000 to $199,9992,271 $200,000 to $249,9991,275 $250,000 to $299,999873 $300,000 to $399,999163 $400,000 to $499,99992 $500,000 to $749,99951 $750,000 to $999,99922 $1,000,000 to $1,499,99911 $1,500,000 to $1,999,99947 $2,000,000 or moreRent paid by renters in 2022 in New Britain, CT 724 $150 to $199564 $200 to $249487 $250 to $299115 $300 to $349190 $400 to $449251 $450 to $499668 $500 to $549517 $550 to $59999 $600 to $649334 $650 to $699697 $700 to $7491,023 $750 to $7992,553 $800 to $8991,697 $900 to $9994,561 $1,000 to $1,2491,498 $1,250 to $1,499367 $1,500 to $1,999283 $2,500 to $2,99962 $3,000 to $3,499671 No cash rent
Percentage of workers working in this county: 78.2%Number of people working at home: 3,016 (8.6% of all workers )
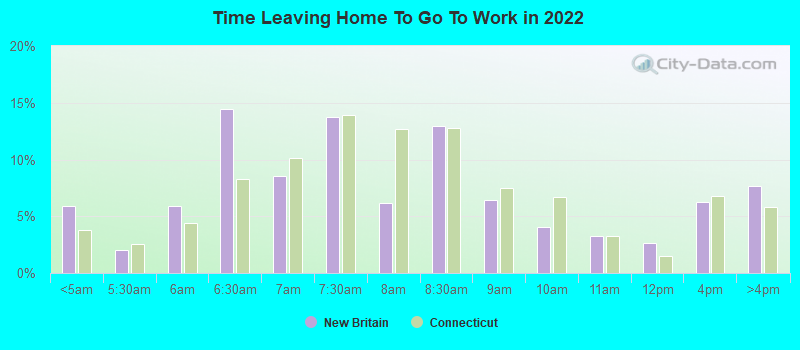
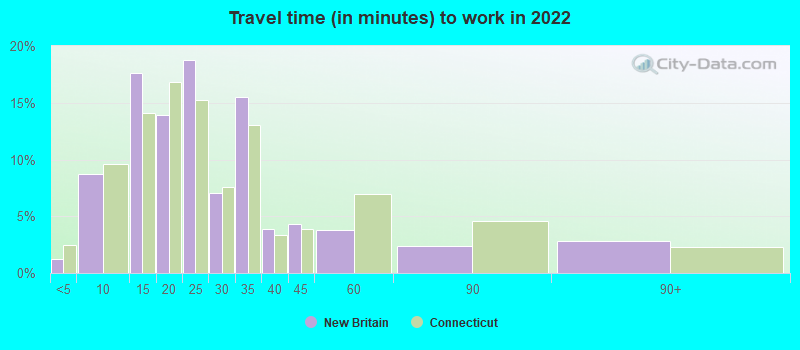
Travel time to work (commute)
Less than 5 minutes: 6625 to 9 minutes: 3,15510 to 14 minutes: 7,79915 to 19 minutes: 6,51820 to 24 minutes: 4,53725 to 29 minutes: 3,59230 to 34 minutes: 4,44435 to 39 minutes: 97240 to 44 minutes: 88845 to 59 minutes: 1,73060 to 89 minutes: 1,44190 or more minutes: 1,087
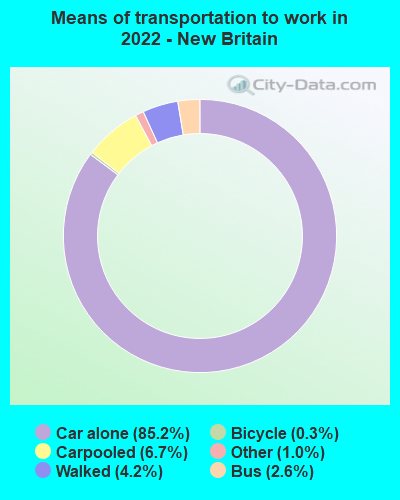
Means of transportation to work:
Drove a car alone: 18,886 (73.5%)Carpooled: 1,567 (6.1%)Bus : 570 (2.2%)Long-distance train or commuter rail : 4 (0.0%)Ferryboat: 6 (0.0%)Taxi: 278 (1.1%)Bicycle: 61 (0.2%)Walked: 988 (3.8%)Worked at home: 3,016 (11.7%)
Unemployment by race in 2022
Unemployment rate for White non-Hispanic residents 8.0% MalesUnemployment rate for Black residents 10.8% Males4.3% FemalesUnemployment rate for American Indian and Alaska Native residents 23.1% FemalesUnemployment rate for Asian residents 3.9% Males3.0% FemalesUnemployment rate for other race residents 4.1% Males6.9% FemalesUnemployment rate for two or more race residents 8.8% Males18.5% FemalesUnemployment rate for Hispanic or Latino residents 5.9% Males7.7% Females
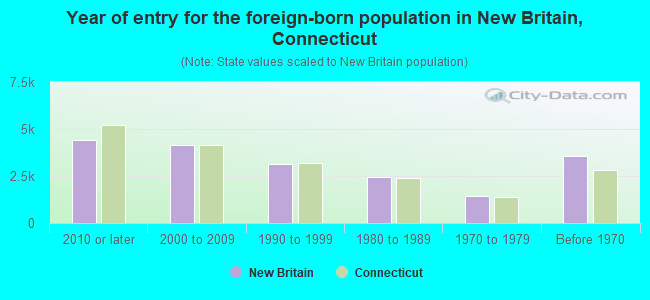
Year of entry for the foreign-born population in New Britain, Connecticut
4,399 2010 or later 4,173 2000 to 2009 3,125 1990 to 1999 2,458 1980 to 1989 1,431 1970 to 1979 3,590 Before 1970
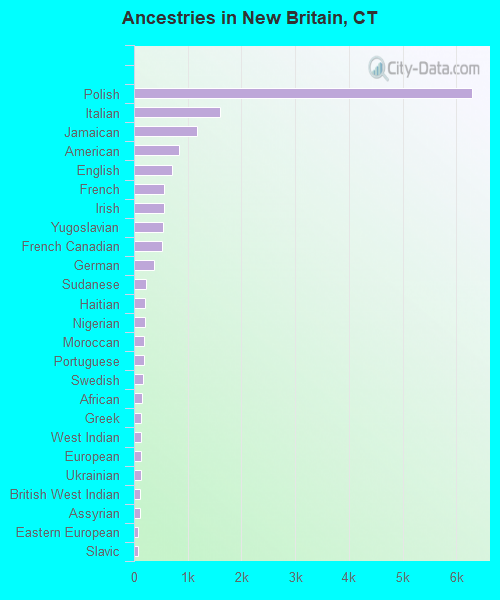
First ancestries reported:
Polish: 6,295 (13.9%)
Italian: 1,598 (3.5%)
Jamaican: 1,171 (2.6%)
American: 842 (1.9%)
English: 705 (1.6%)
French: 562 (1.2%)
Irish: 551 (1.2%)
Yugoslavian: 536 (1.2%)
French Canadian: 522 (1.2%)
German: 374 (0.8%)
Sudanese: 220 (0.5%)
Haitian: 204 (0.5%)
Nigerian: 200 (0.4%)
Moroccan: 186 (0.4%)
Portuguese: 184 (0.4%)
Swedish: 163 (0.4%)
African: 154 (0.3%)
Greek: 138 (0.3%)
West Indian: 138 (0.3%)
European: 137 (0.3%)
Ukrainian: 136 (0.3%)
British West Indian: 110 (0.2%)
Assyrian: 103 (0.2%)
Eastern European: 82 (0.2%)
Slavic: 78 (0.2%)
Lithuanian: 69 (0.2%)
Romanian: 64 (0.1%)
Canadian: 53 (0.1%)
Scottish: 51 (0.1%)
Scotch-Irish: 50 (0.1%)
Iranian: 46 (0.1%)
Hungarian: 43 (0.10%)
Ghanaian: 41 (0.09%)
Scandinavian: 35 (0.08%)
Egyptian: 33 (0.07%)
Cape Verdean: 33 (0.07%)
Cajun: 28 (0.06%)
Northern European: 24 (0.05%)
British: 22 (0.05%)
Russian: 21 (0.05%)
Brazilian: 21 (0.05%)
Austrian: 20 (0.04%)
Trinidadian and Tobagonian: 17 (0.04%)
Guyanese: 16 (0.04%)
Danish: 14 (0.03%)
Arab: 13 (0.03%)
Latvian: 12 (0.03%)
Dutch: 11 (0.02%)
Croatian: 11 (0.02%)
Kenyan: 8 (0.02%)
Slovak: 8 (0.02%)
Celtic: 5 (0.01%)
Lebanese: 5 (0.01%)
Barbadian: 5 (0.01%)
Most common places of birth for foreign-born residents (%): Poland New Britain:
27.2% (4,104)Connecticut:
4.0% (21,729)
Dominican Republic New Britain:
9.4% (1,415)Connecticut:
5.0% (27,361)
Jamaica New Britain:
5.7% (852)Connecticut:
7.5% (40,568)
Ecuador New Britain:
5.2% (778)Connecticut:
4.4% (24,026)
Mexico New Britain:
4.4% (663)Connecticut:
4.8% (25,802)
Peru New Britain:
4.3% (641)Connecticut:
2.5% (13,591)
Cameroon New Britain:
4.2% (633)Connecticut:
0.1% (797)
India New Britain:
2.8% (425)Connecticut:
7.3% (39,879)
Colombia New Britain:
2.7% (406)Connecticut:
3.3% (18,124)
Yemen New Britain:
2.4% (358)Connecticut:
0.1% (281)
Bosnia and Herzegovina New Britain:
2.1% (317)Connecticut:
0.5% (2,749)
Place of birth for U.S.-born residents:
This state: 35,218Other state: 12,283Northeast: 8,079Midwest: 1,014South: 2,311West: 879 88.3% of New Britain residents lived in the same house 1 years ago.
Out of people who lived in different houses, 36.6% lived in this county.
Out of people who lived in different counties, 46.2% lived in Connecticut.
New Britain:
88.3%State average:
88.4%
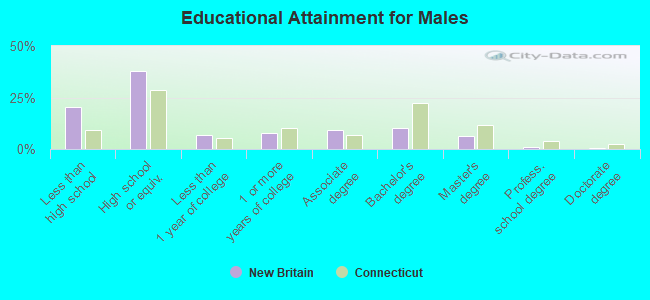
Education attainment for males 25 years and older:
No schooling: 1,208Nursery to 4th grade: 3695th and 6th grade: 5257th and 8th grade: 9859th grade: 61910th grade: 68411th grade: 43512th grade, no diploma: 273High school graduate (or equivalency): 9,316Less than 1 year of college: 1,722Some college more than 1 year, no degree: 1,889Associate degree: 2,285Bachelor's degree: 2,558Master's degree: 1,560Professional school degree: 229Doctorate degree: 81
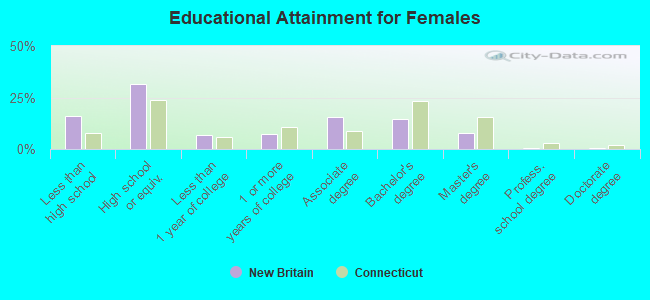
Education attainment for females 25 years and older:
No schooling: 308Nursery to 4th grade: 5325th and 6th grade: 657th and 8th grade: 1689th grade: 53210th grade: 77111th grade: 1,36812th grade, no diploma: 258High school graduate (or equivalency): 7,809Less than 1 year of college: 1,702Some college more than 1 year, no degree: 1,768Associate degree: 3,891Bachelor's degree: 3,607Master's degree: 1,895Professional school degree: 97Doctorate degree: 83
Housing units in structures:
One, detached: 10,600One, attached: 1,351Two: 4,7923 or 4: 6,4605 to 9: 3,61810 to 19: 1,62020 to 49: 1,07250 or more: 3,402Housing units lacking complete plumbing facilities in 2022: 1.0%Housing units lacking complete kitchen facilities in 2022: 2.4%House/condo owner moved in on average 12 years ago
Renter moved in on average 3 years ago
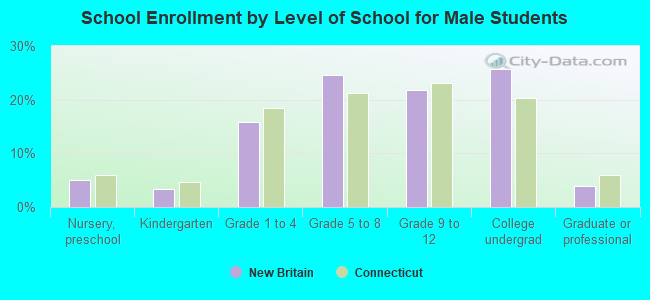
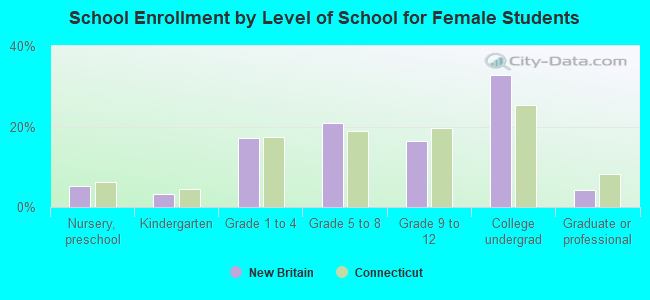
Private vs. public school enrollment:
Students in private schools in grades 1 to 8 (elementary and middle school): 482 Here:
6.1%Connecticut:
9.5%
Students in private schools in grades 9 to 12 (high school): 204 Here:
5.4%Connecticut:
12.9%
Students in private undergraduate colleges: 1,531 Here:
26.4%Connecticut:
35.5%