New Burnside, IL (Illinois) Houses and Residents
| New Burnside: | $77,869 |
| Illinois: | $251,600 |
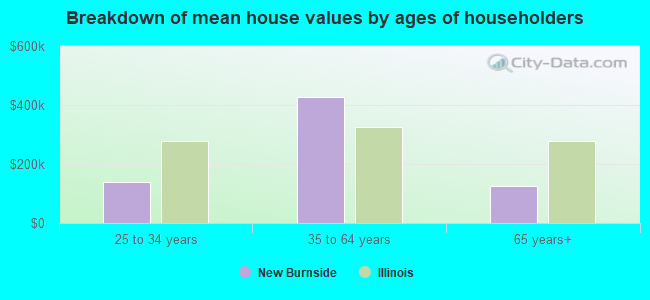
Mean price in 2022:
Detached houses: $120,062
Here: $120,062 State: $310,164 Mobile homes: $69,423
Here: $69,423 State: $78,855
Total population: 213 (Urban population: 0, Rural population: 262 (10 farm, 252 nonfarm))
Houses: 83 (55 occupied: 54 owner occupied, 1 renter occupied)
| % of renters here: | 2% |
| State: | 33% |
Housing density: 79 houses/condos per square mile
Median price asked for vacant for-sale houses and condos in 2022 in this county: $52,340.
Median gross rent in New Burnside, IL in 2022: $-661,577,607
Housing units in New Burnside with a mortgage: 15 (2 second mortgage, 0 home equity loan, 2 both second mortgage and home equity loan)
Houses without a mortgage: 0
Median household income for houses/condos with a mortgage: $65,271
Median household income for apartments without a mortgage: $34,690
Median monthly housing costs: $829
Compare current foreclosures near New Burnside, IL:
| Photo | Address | Area | Beds / Baths | Price | Details |
|---|---|---|---|---|---|

|
#1
Tuller Rd
Stonefort, IL 62987
|
- sq. feet
|
3 baths 7 beds |
$49,900
|
show details |

|
#2
W Ogara St
Harrisburg, IL 62946
|
1,152 sq. feet
|
1 baths 3 beds |
show details | |

|
#3
N State St
Marion, IL 62959
|
2,168 sq. feet
|
2 baths 4 beds |
show details | |

|
#4
E Gaskins St
Harrisburg, IL 62946
|
1,600 sq. feet
|
2 baths 3 beds |
show details | |

|
#5
E Gaskins St
Harrisburg, IL 62946
|
1,430 sq. feet
|
1 baths 3 beds |
show details | |

|
#6
Roberts Rd
Marion, IL 62959
|
- sq. feet
|
2 baths 3 beds |
show details | |

|
#7
Fawn Dr
Marion, IL 62959
|
1,671 sq. feet
|
- baths - beds |
show details | |

|
#8
N Market St # C
Marion, IL 62959
|
- sq. feet
|
- baths - beds |
show details | |

|
#9
N Van Buren St
Marion, IL 62959
|
- sq. feet
|
- baths - beds |
show details | |

|
#10
W Cherry St
Marion, IL 62959
|
- sq. feet
|
- baths - beds |
show details |
| Photo | Address | Area | Beds / Baths | Price | Details |
|---|---|---|---|---|---|

|
#11
Mitchellsville Rd
Carrier Mills, IL 62917
|
- sq. feet
|
- baths - beds |
show details | |

|
#12
Tyler Bridge Rd
Creal Springs, IL 62922
|
- sq. feet
|
- baths - beds |
show details | |

|
#13
Spring Garden Rd
Marion, IL 62959
|
- sq. feet
|
- baths - beds |
show details | |

|
#14
Paulton Rd
Pittsburg, IL 62974
|
- sq. feet
|
- baths - beds |
show details | |

|
#15
Palzo Rd
Creal Springs, IL 62922
|
- sq. feet
|
- baths - beds |
show details | |

|
#16
E Boulevard St
Marion, IL 62959
|
- sq. feet
|
- baths - beds |
show details | |

|
#17
E Parham St
Marion, IL 62959
|
- sq. feet
|
- baths - beds |
show details | |

|
#18
Sherman Dr
Marion, IL 62959
|
- sq. feet
|
- baths - beds |
show details | |

|
#19
Perry Rd
Pittsburg, IL 62974
|
- sq. feet
|
- baths - beds |
show details | |

|
#20
W Scranton Ave
Pittsburg, IL 62974
|
- sq. feet
|
- baths - beds |
show details |
| Photo | Address | Area | Beds / Baths | Price | Details |
|---|---|---|---|---|---|

|
#21
State Route 146 W
Vienna, IL 62995
|
- sq. feet
|
- baths - beds |
show details | |

|
#22
W Main St # 81
Marion, IL 62959
|
- sq. feet
|
- baths - beds |
show details | |

|
#23
Pope St
Marion, IL 62959
|
- sq. feet
|
- baths - beds |
show details | |

|
#24
Zachary Dr
Marion, IL 62959
|
- sq. feet
|
- baths - beds |
show details | |

|
#25
Melanie Ln Apt H
Marion, IL 62959
|
- sq. feet
|
- baths - beds |
show details | |

|
#26
Reevesville Rd
Grantsburg, IL 62943
|
- sq. feet
|
- baths - beds |
show details | |

|
#27
Red Row
Marion, IL 62959
|
- sq. feet
|
- baths - beds |
show details | |

|
#28
Darren Dr
Marion, IL 62959
|
- sq. feet
|
- baths - beds |
show details | |

|
#29
W Barnett St
Harrisburg, IL 62946
|
- sq. feet
|
- baths - beds |
show details | |

|
#30
Pittsburg Rd
Marion, IL 62959
|
- sq. feet
|
- baths - beds |
show details |
| Photo | Address | Area | Beds / Baths | Price | Details |
|---|---|---|---|---|---|

|
#31
Corinth Rd
Pittsburg, IL 62974
|
- sq. feet
|
- baths - beds |
show details | |

|
#32
Apache Dr
Marion, IL 62959
|
- sq. feet
|
- baths - beds |
show details | |

|
#33
Paulton Rd
Pittsburg, IL 62974
|
- sq. feet
|
- baths - beds |
show details | |

|
#34
Calico Rd
Marion, IL 62959
|
- sq. feet
|
- baths - beds |
show details | |

|
#35
Galatia Post Rd
Marion, IL 62959
|
- sq. feet
|
- baths - beds |
show details | |

|
#36
Lobo Ln
Marion, IL 62959
|
- sq. feet
|
- baths - beds |
show details | |

|
#37
Stilleys Mill Rd
Marion, IL 62959
|
- sq. feet
|
- baths - beds |
show details | |

|
#38
Teske Rd
Marion, IL 62959
|
- sq. feet
|
- baths - beds |
show details | |

|
#39
N Broadway
Goreville, IL 62939
|
- sq. feet
|
- baths - beds |
show details | |

|
#40
N Thompson St
Carrier Mills, IL 62917
|
- sq. feet
|
- baths - beds |
show details |
| Photo | Address | Area | Beds / Baths | Price | Details |
|---|---|---|---|---|---|

|
#41
Crab Orchard Rd
Marion, IL 62959
|
- sq. feet
|
- baths - beds |
show details | |

|
#42
Remington Rd
Marion, IL 62959
|
- sq. feet
|
- baths - beds |
show details | |

|
#43
Dutchman Lake Rd
Ozark, IL 62972
|
- sq. feet
|
- baths - beds |
show details | |

|
#44
Rock Creek Rd
Pittsburg, IL 62974
|
- sq. feet
|
- baths - beds |
show details | |

|
#45
Saraville Rd
Marion, IL 62959
|
- sq. feet
|
- baths - beds |
show details | |

|
#46
Mauseyville Rd
Creal Springs, IL 62922
|
- sq. feet
|
- baths - beds |
show details | |

|
#47
Junction Falls Rd
Creal Springs, IL 62922
|
- sq. feet
|
- baths - beds |
show details | |

|
#48
N Line St
Creal Springs, IL 62922
|
- sq. feet
|
- baths - beds |
show details | |

|
#49
N Line St
Creal Springs, IL 62922
|
- sq. feet
|
- baths - beds |
show details | |

|
Check over 1 million property listings on Foreclosure.com!
|
browse all offers | |||


Household type by relationship:
Households: 159- Male householders: 22 (6 living alone), Female householders: 31 (6 living alone)
32 spouses (32 opposite-sex spouses), 0 unmarried partners, (0 opposite-sex unmarried partners), 17 children (16 natural, 0 adopted, 0 stepchildren), 16 grandchildren, 8 brothers or sisters, 4 parents, 0 foster children, 23 other relatives, 0 non-relatives
Size of family households: 24 2-persons, 1 3-persons, 14 4-persons, 1 5-persons.
Size of nonfamily households: 14 1-person.
8 married couples with children.
0 single-parent households (0 men, 0 women).
101.9% of residents of New Burnside speak English at home.
| Here: | 5.5 |
| State: | 6.4 |
| Here: | -650793650.1 |
| State: | 4.1 |
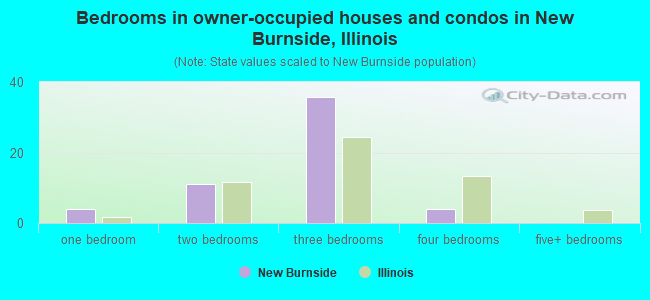
- Bedrooms in owner-occupied houses and condos in New Burnside, Illinois
- 0no bedroom
- 41 bedroom
- 112 bedrooms
- 363 bedrooms
- 44 bedrooms
- 05+ bedrooms

- Bedrooms in renter-occupied apartments in New Burnside, Illinois
- 0no bedroom
- 01 bedroom
- 02 bedrooms
- 13 bedrooms
- 04 bedrooms
- 05+ bedrooms
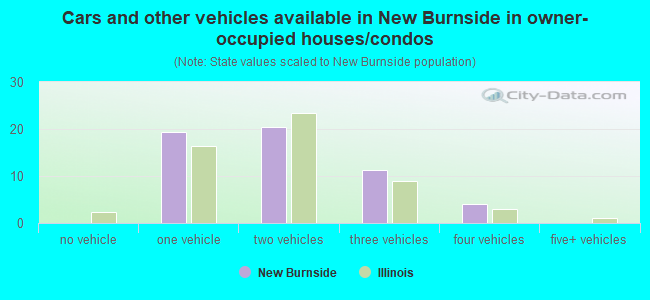
- Cars and other vehicles available in New Burnside in owner-occupied houses/condos
- 0no vehicle
- 191 vehicle
- 202 vehicles
- 113 vehicles
- 44 vehicles
- 05+ vehicles
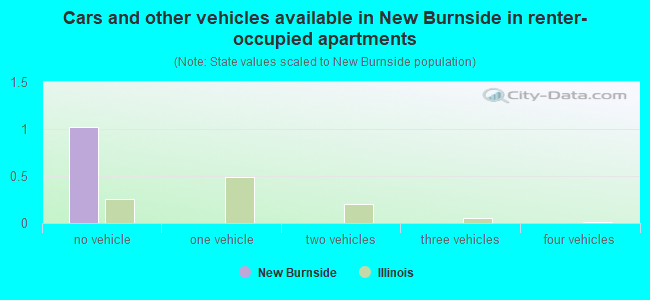
- Cars and other vehicles available in New Burnside in renter-occupied apartments
- 1no vehicle
- 01 vehicle
- 02 vehicles
- 03 vehicles
- 04 vehicles
- 05+ vehicles
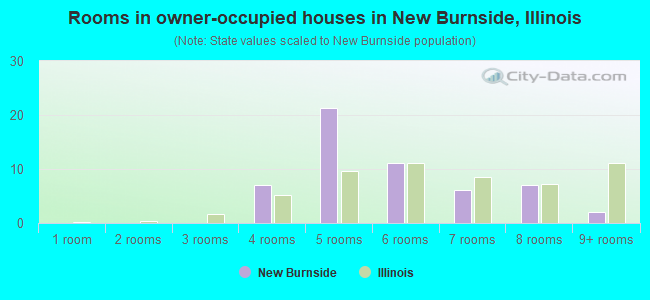
- Rooms in owner-occupied houses in New Burnside, Illinois
- 01 room
- 02 rooms
- 03 rooms
- 74 rooms
- 215 rooms
- 116 rooms
- 67 rooms
- 78 rooms
- 29+ rooms
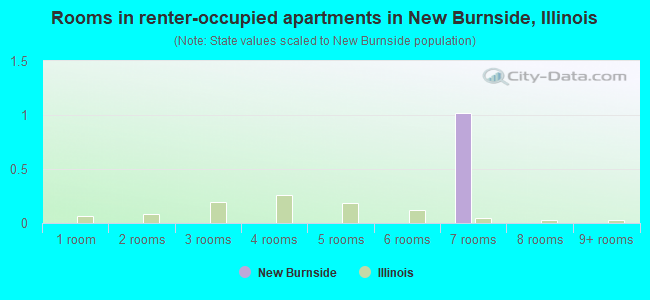
- Rooms in renter-occupied apartments in New Burnside, Illinois
- 01 room
- 02 rooms
- 03 rooms
- 04 rooms
- 05 rooms
- 06 rooms
- 17 rooms
- 08 rooms
- 09+ rooms
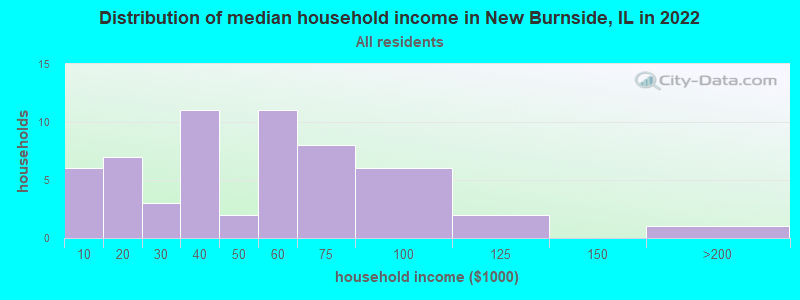
New Burnside, IL household income distribution

- 6Less than $10,000
- 7$10,000 to $19,999
- 3$20,000 to $29,999
- 11$30,000 to $39,999
- 2$40,000 to $49,999
- 11$50,000 to $59,999
- 8$60,000 to $74,999
- 6$75,000 to $99,999
- 2$100,000 to $124,999
- 1$150,000 to $199,999
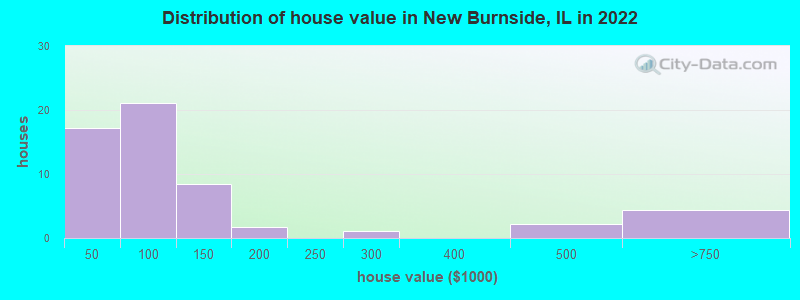
Home value of owner - occupied houses in 2022 in New Burnside, IL
-
- 1Less than $10,000
- 9$10,000 to $14,999
- 0$15,000 to $19,999
- 3$20,000 to $24,999
- 1$25,000 to $29,999
- 0$50,000 to $59,999
- 7$60,000 to $69,999
- 10$70,000 to $79,999
- 1$80,000 to $89,999
- 1$90,000 to $99,999
- 5$100,000 to $124,999
- 2$125,000 to $149,999
- 1$175,000 to $199,999
- 1$250,000 to $299,999
- 2$400,000 to $499,999
- 4$500,000 to $749,999
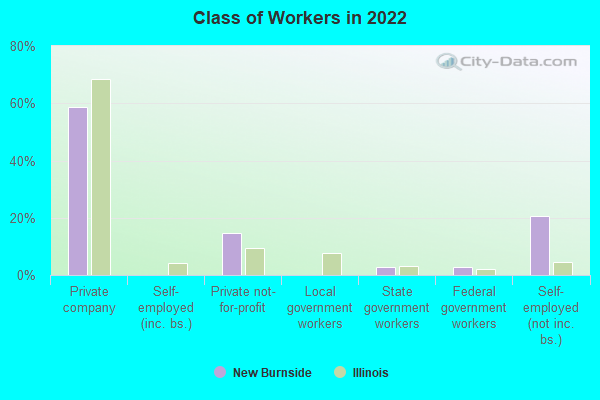
Percentage of workers working in this county: 41.2%
Number of people working at home: 5 (14.7% of all workers)
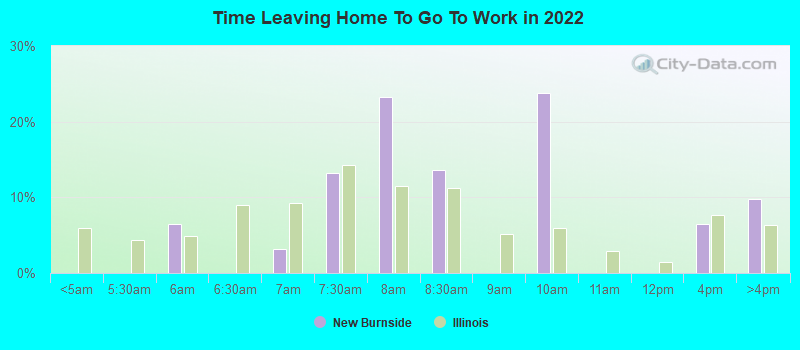
Travel time to work (commute)
- Less than 5 minutes: 0
- 5 to 9 minutes: 0
- 10 to 14 minutes: 1
- 15 to 19 minutes: 8
- 20 to 24 minutes: 1
- 25 to 29 minutes: 0
- 30 to 34 minutes: 2
- 35 to 39 minutes: 0
- 40 to 44 minutes: 0
- 45 to 59 minutes: 11
- 60 to 89 minutes: 0
- 90 or more minutes: 0
Means of transportation to work:
- Drove a car alone: 58 (74.4%)
- Carpooled: 14 (17.9%)
- Walked: 1 (1.3%)
- Worked at home: 5 (6.4%)
- Unemployment by race in 2022
- Unemployment rate for White non-Hispanic residents
- 4.7%Males
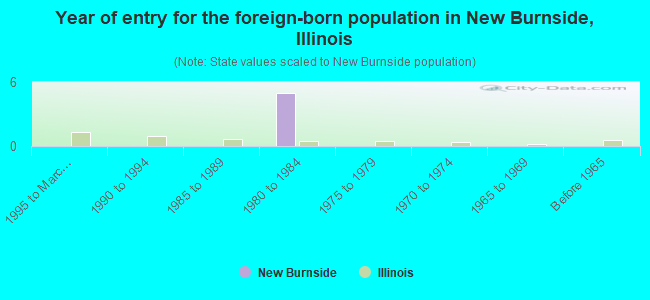
- Year of entry for the foreign-born population in New Burnside, Illinois
- 01995 to March 2000
- 01990 to 1994
- 01985 to 1989
- 51980 to 1984
- 01975 to 1979
- 01970 to 1974
- 01965 to 1969
- 0Before 1965
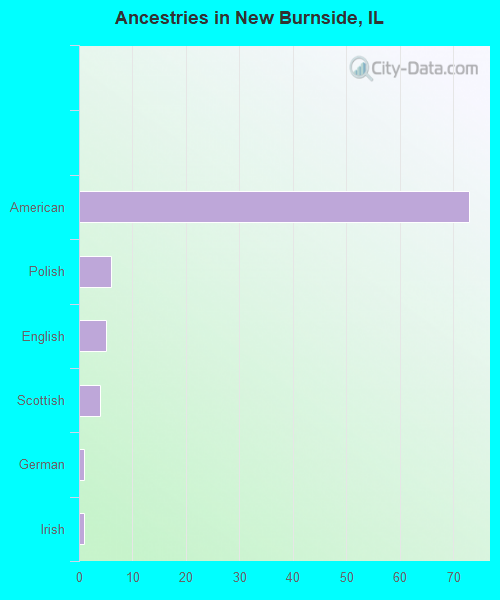
First ancestries reported:
- American: 73 (66.2%)
- Polish: 6 (5.4%)
- English: 5 (4.5%)
- Scottish: 4 (3.6%)
- German: 1 (0.9%)
- Irish: 1 (0.9%)
Most common places of birth for foreign-born residents (%):
| New Burnside: | 100.0% (5) |
| Illinois: | 0.2% (3,488) |
Place of birth for U.S.-born residents:
- This state: 113
- Other state: 45
- Northeast: 2
- Midwest: 31
- South: 12
- West: 0
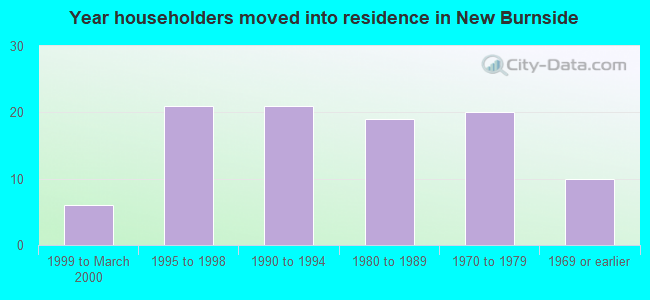
96.2% of New Burnside residents lived in the same house 1 years ago.
Out of people who lived in different houses, 14.3% lived in this county.
Out of people who lived in different counties, 100.0% lived in Illinois.
| New Burnside: | 96.2% |
| State average: | 88.3% |
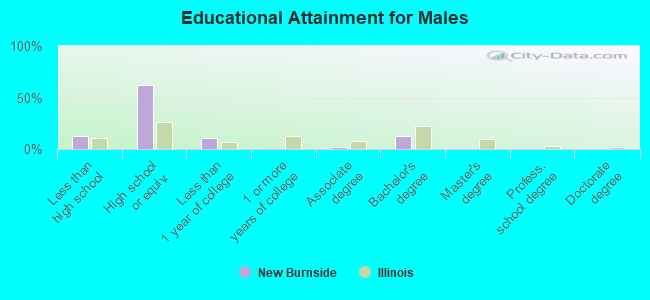
Education attainment for males 25 years and older:
- No schooling: 2
- Nursery to 4th grade: 0
- 5th and 6th grade: 0
- 7th and 8th grade: 0
- 9th grade: 0
- 10th grade: 0
- 11th grade: 0
- 12th grade, no diploma: 4
- High school graduate (or equivalency): 29
- Less than 1 year of college: 5
- Some college more than 1 year, no degree: 0
- Associate degree: 1
- Bachelor's degree: 6
- Master's degree: 0
- Professional school degree: 0
- Doctorate degree: 0
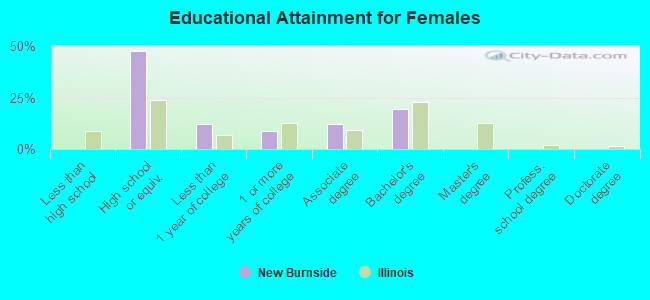
Education attainment for females 25 years and older:
- No schooling: 0
- Nursery to 4th grade: 0
- 5th and 6th grade: 0
- 7th and 8th grade: 0
- 9th grade: 0
- 10th grade: 0
- 11th grade: 0
- 12th grade, no diploma: 0
- High school graduate (or equivalency): 27
- Less than 1 year of college: 7
- Some college more than 1 year, no degree: 5
- Associate degree: 7
- Bachelor's degree: 11
- Master's degree: 0
- Professional school degree: 0
- Doctorate degree: 0


Housing units in structures:
- One, detached: 70
- Mobile homes: 13
Housing units lacking complete kitchen facilities in 2022: 8.4%
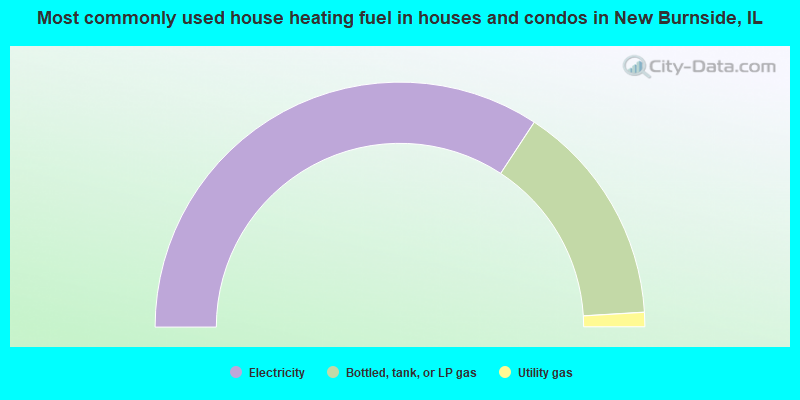
- 68.5%Electricity
- 29.6%Bottled, tank, or LP gas
- 1.9%Utility gas
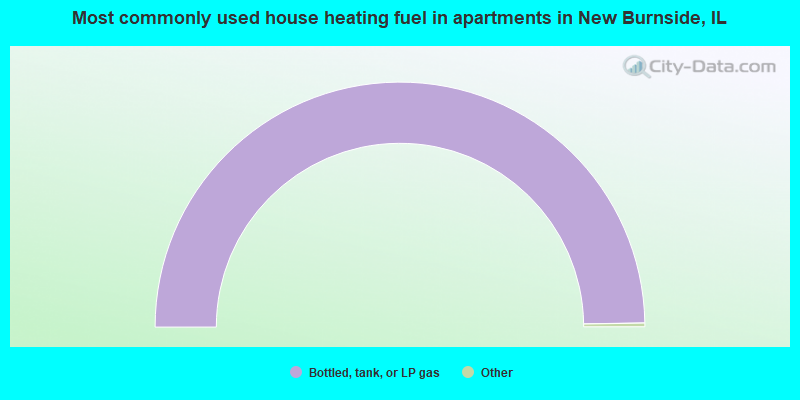
- 100.0%Bottled, tank, or LP gas
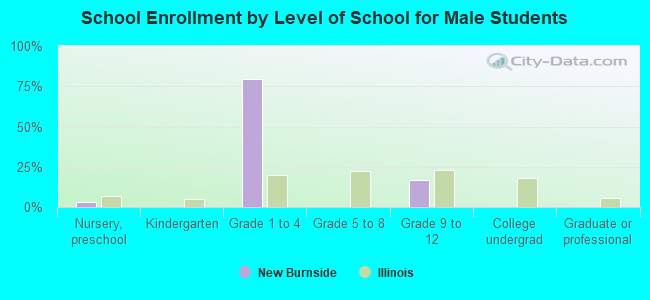
Private vs. public school enrollment:
| Here: | 20.7% |
| Illinois: | 13.3% |
| Here: | 0.0% |
| Illinois: | 9.9% |