New Hyde Park, NY (New York) Houses and Residents
| New Hyde Park: | $717,912 |
| New York: | $400,400 |
Mean price in 2022:
Detached houses: $766,976
Here: $766,976 State: $476,719 In 2-unit structures: $966,785
Here: $966,785 State: $713,077
Total population: 9,799 (Urban population: 9,522, Rural population: 0)
Houses: 3,390 (3,305 occupied: 2,743 owner occupied, 556 renter occupied)
| % of renters here: | 17% |
| State: | 46% |
Housing density: 4,016 houses/condos per square mile
Median price asked for vacant for-sale houses and condos in 2022 in this county: $728,543.
Median contract rent in 2022: $1,522 (lower quartile is $1,081, upper quartile is over $2,000)
Median rent asked for vacant for-rent units in 2022: $2,009
Median gross rent in New Hyde Park, NY in 2022: $1,563
Housing units in New Hyde Park with a mortgage: 1,872 (227 second mortgage, 0 home equity loan, 213 both second mortgage and home equity loan)
Houses without a mortgage: 112
Median household income for houses/condos with a mortgage: $171,215
Median household income for apartments without a mortgage: $117,899
Median monthly housing costs: $2,798
Compare current foreclosures in New Hyde Park, NY:
| Photo | Address | Area | Beds / Baths | Price | Details |
|---|---|---|---|---|---|

|
#1
Park Ave
New Hyde Park, NY 11040
|
2,096 sq. feet
|
3 baths 5 beds |
show details | |

|
#2
South Dr
New Hyde Park, NY 11040
|
2,300 sq. feet
|
2 baths - beds |
show details | |

|
#3
37 266th St
New Hyde Park, NY 11040
|
1,118 sq. feet
|
- baths - beds |
show details | |

|
#4
Birch Ln
New Hyde Park, NY 11040
|
1,456 sq. feet
|
1 baths - beds |
show details | |

|
#5
Queens Ln
New Hyde Park, NY 11040
|
2,055 sq. feet
|
2 baths - beds |
show details | |

|
#6
Park E
New Hyde Park, NY 11040
|
1,561 sq. feet
|
3 baths - beds |
show details | |

|
#7
Oxford St
New Hyde Park, NY 11040
|
1,358 sq. feet
|
1 baths - beds |
show details | |

|
#8
Atlantic Ave
New Hyde Park, NY 11040
|
1,638 sq. feet
|
2 baths - beds |
show details | |

|
#9
8th Ave
New Hyde Park, NY 11040
|
1,542 sq. feet
|
2 baths - beds |
show details | |

|
#10
S 13th St
New Hyde Park, NY 11040
|
1,262 sq. feet
|
1 baths - beds |
show details |
| Photo | Address | Area | Beds / Baths | Price | Details |
|---|---|---|---|---|---|

|
#11
Schumacher Dr
New Hyde Park, NY 11040
|
1,308 sq. feet
|
1 baths - beds |
show details | |

|
#12
Lincoln Ave
New Hyde Park, NY 11040
|
1,325 sq. feet
|
2 baths - beds |
show details | |

|
#13
N 5th St
New Hyde Park, NY 11040
|
1,473 sq. feet
|
1 baths - beds |
show details | |

|
#14
Robby Ln
New Hyde Park, NY 11040
|
2,099 sq. feet
|
2 baths - beds |
show details | |

|
#15
Surrey Ln
New Hyde Park, NY 11040
|
2,576 sq. feet
|
3 baths - beds |
show details | |

|
#16
Maple Dr
New Hyde Park, NY 11040
|
1,439 sq. feet
|
1 baths - beds |
show details | |

|
#17
Laurel Dr
New Hyde Park, NY 11040
|
1,566 sq. feet
|
1 baths - beds |
show details | |

|
#18
Park Ave
New Hyde Park, NY 11040
|
1,260 sq. feet
|
2 baths - beds |
show details | |

|
#19
Hillside Ave
New Hyde Park, NY 11040
|
722 sq. feet
|
1 baths - beds |
show details | |

|
#20
N 7th St
New Hyde Park, NY 11040
|
1,800 sq. feet
|
2 baths - beds |
show details |
| Photo | Address | Area | Beds / Baths | Price | Details |
|---|---|---|---|---|---|

|
#21
N 6th St
New Hyde Park, NY 11040
|
2,016 sq. feet
|
2 baths - beds |
show details | |

|
#22
Wilson Blvd
New Hyde Park, NY 11040
|
1,326 sq. feet
|
2 baths - beds |
show details | |

|
#23
East St
New Hyde Park, NY 11040
|
1,393 sq. feet
|
1 baths - beds |
show details | |

|
#24
Hillside Blvd
New Hyde Park, NY 11040
|
1,473 sq. feet
|
2 baths - beds |
show details | |

|
#25
N 11th St
New Hyde Park, NY 11040
|
1,932 sq. feet
|
2 baths - beds |
show details | |

|
#26
Wilben Ct
New Hyde Park, NY 11040
|
1,936 sq. feet
|
2 baths - beds |
show details | |

|
#27
Executive Dr
New Hyde Park, NY 11040
|
3,269 sq. feet
|
3 baths - beds |
show details | |

|
#28
4th St
New Hyde Park, NY 11040
|
2,029 sq. feet
|
2 baths - beds |
show details | |

|
#29
Lowell Ave
New Hyde Park, NY 11040
|
1,401 sq. feet
|
2 baths - beds |
show details | |

|
#30
Gerard Ave
New Hyde Park, NY 11040
|
1,761 sq. feet
|
1 baths - beds |
show details |
| Photo | Address | Area | Beds / Baths | Price | Details |
|---|---|---|---|---|---|

|
#31
N 5th St
New Hyde Park, NY 11040
|
1,768 sq. feet
|
1 baths - beds |
show details | |

|
#32
Marcus Ave Ste 207
New Hyde Park, NY 11042
|
- sq. feet
|
- baths - beds |
show details | |

|
#33
Jericho Tpke Apt 2
New Hyde Park, NY 11040
|
- sq. feet
|
- baths - beds |
show details | |

|
#34
Maple Ln
New Hyde Park, NY 11040
|
- sq. feet
|
- baths - beds |
show details | |

|
#35
Taipei Ct
New Hyde Park, NY 11040
|
- sq. feet
|
- baths - beds |
show details | |

|
#36
Marcus Ave Ste 207
New Hyde Park, NY 11042
|
- sq. feet
|
- baths - beds |
show details | |

|
#37
Lefferts Blvd
New Hyde Park, NY 11040
|
- sq. feet
|
- baths - beds |
show details | |

|
#38
Leavitt St
New Hyde Park, NY 11040
|
- sq. feet
|
- baths - beds |
show details | |

|
Check over 1 million property listings on Foreclosure.com!
|
browse all offers | |||


 | Houses in New Hyde Park (39 replies) |
| Furnished apartment to rent in Long Island , no kids (20 replies) |
| Buy or rent in Herricks school district. Or private school in NYC? (25 replies) |
| New Hyde Park House (7 replies) |
| Childhood friends home (1 reply) |
| Homes in Nassau (9 replies) |
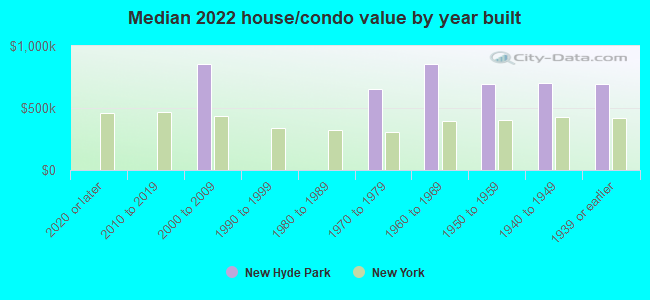
Median year apartment built: 1950
Household type by relationship:
Households: 10,194- Male householders: 1,849 (158 living alone), Female householders: 1,427 (358 living alone)
2,072 spouses (2,062 opposite-sex spouses), 145 unmarried partners, (134 opposite-sex unmarried partners), 3,342 children (3,271 natural, 23 adopted, 47 stepchildren), 246 grandchildren, 136 brothers or sisters, 529 parents, 0 foster children, 241 other relatives, 193 non-relatives
- In group quarters: 9
Size of family households: 769 2-persons, 433 3-persons, 918 4-persons, 354 5-persons, 63 6-persons, 89 7-or-more-persons.
Size of nonfamily households: 539 1-person, 139 2-persons.
1,543 married couples with children.
136 single-parent households (34 men, 102 women).
58.6% of residents of New Hyde Park speak English at home.
15.9% of residents speak Spanish at home (66% speak English very well, 11% speak English well, 23% speak English not well).
9.9% of residents speak other Indo-European language at home (71% speak English very well, 24% speak English well, 4% speak English not well, 1% don't speak English at all).
15.7% of residents speak Asian or Pacific Island language at home (64% speak English very well, 20% speak English well, 13% speak English not well, 3% don't speak English at all).
0.6% of residents speak other language at home (100% speak English very well).
Foreign born population: 3,227 (31.7%)
(70.6% of them are naturalized citizens)
| Here: | 6.8 |
| State: | 6.3 |
| Here: | 4.3 |
| State: | 3.8 |
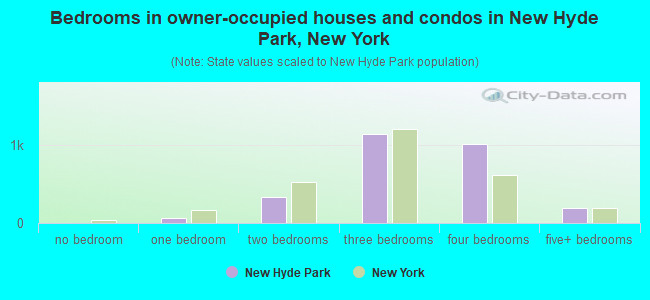
- Bedrooms in owner-occupied houses and condos in New Hyde Park, New York
- 0no bedroom
- 591 bedroom
- 3282 bedrooms
- 1,1423 bedrooms
- 1,0184 bedrooms
- 1965+ bedrooms
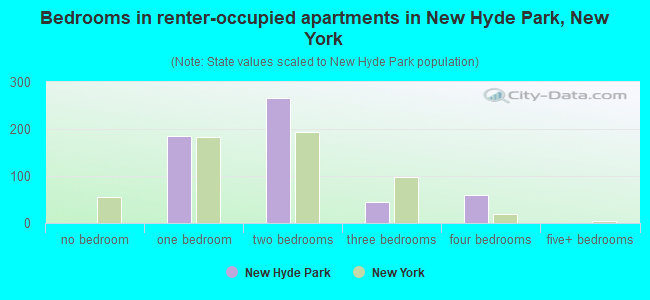
- Bedrooms in renter-occupied apartments in New Hyde Park, New York
- 0no bedroom
- 1861 bedroom
- 2662 bedrooms
- 453 bedrooms
- 604 bedrooms
- 05+ bedrooms
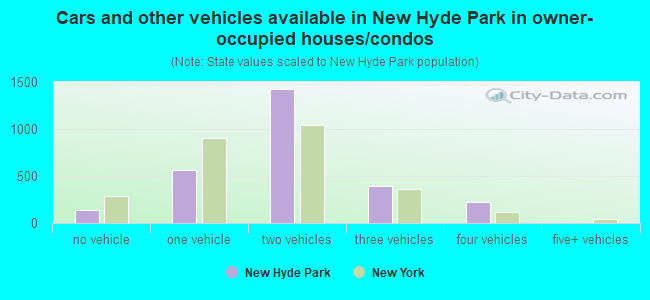
- Cars and other vehicles available in New Hyde Park in owner-occupied houses/condos
- 138no vehicle
- 5621 vehicle
- 1,4252 vehicles
- 3923 vehicles
- 2264 vehicles
- 05+ vehicles
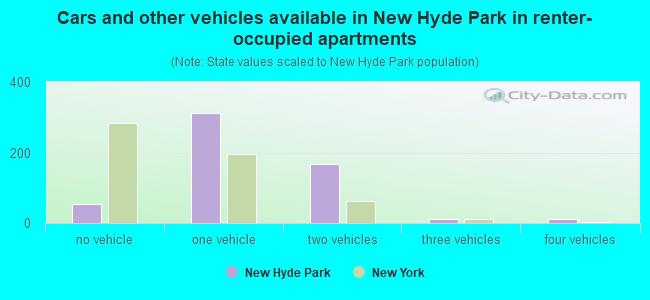
- Cars and other vehicles available in New Hyde Park in renter-occupied apartments
- 55no vehicle
- 3121 vehicle
- 1672 vehicles
- 113 vehicles
- 124 vehicles
- 05+ vehicles
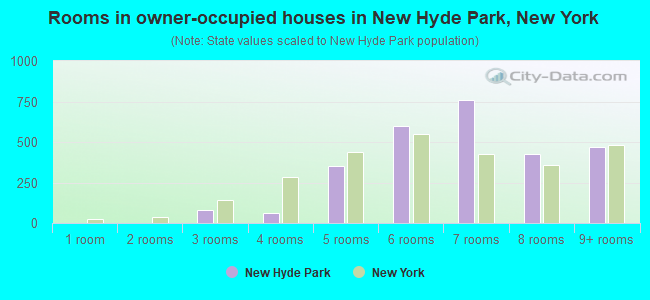
- Rooms in owner-occupied houses in New Hyde Park, New York
- 01 room
- 02 rooms
- 823 rooms
- 604 rooms
- 3495 rooms
- 5966 rooms
- 7617 rooms
- 4238 rooms
- 4719+ rooms
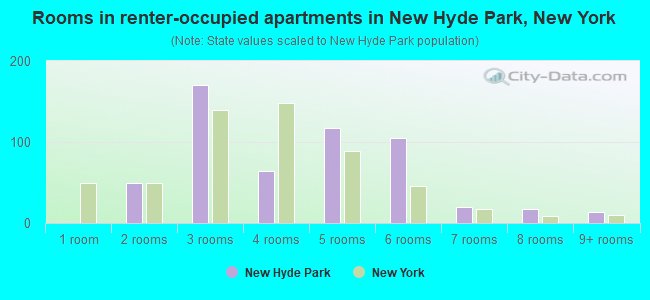
- Rooms in renter-occupied apartments in New Hyde Park, New York
- 01 room
- 502 rooms
- 1703 rooms
- 644 rooms
- 1175 rooms
- 1056 rooms
- 207 rooms
- 178 rooms
- 139+ rooms
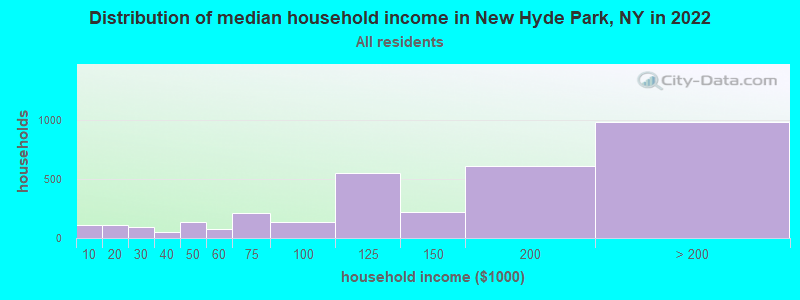
New Hyde Park, NY household income distribution

- 111Less than $10,000
- 107$10,000 to $19,999
- 91$20,000 to $29,999
- 50$30,000 to $39,999
- 138$40,000 to $49,999
- 80$50,000 to $59,999
- 210$60,000 to $74,999
- 137$75,000 to $99,999
- 555$100,000 to $124,999
- 218$125,000 to $149,999
- 613$150,000 to $199,999
- 985$200,000 or more
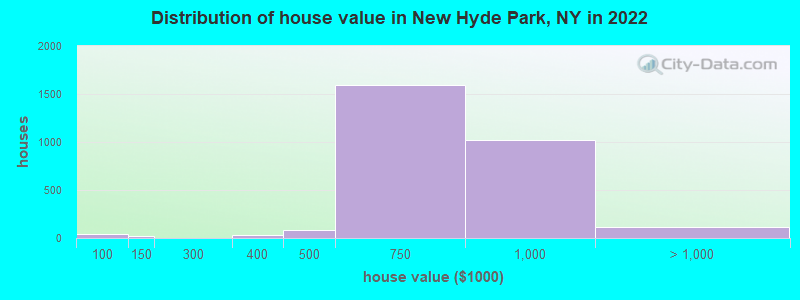
Home value of owner - occupied houses in 2022 in New Hyde Park, NY
-
- 11$50,000 to $59,999
- 27$60,000 to $69,999
- 15$100,000 to $124,999
- 33$300,000 to $399,999
- 79$400,000 to $499,999
- 1,592$500,000 to $749,999
- 1,018$750,000 to $999,999
- 97$1,000,000 to $1,499,999
- 15$2,000,000 or more
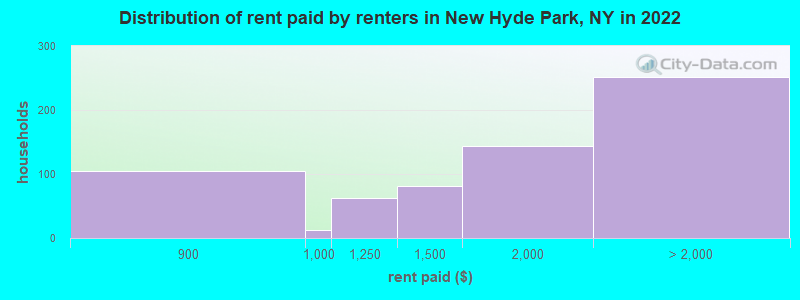
Rent paid by renters in 2022 in New Hyde Park, NY
-
- 104$800 to $899
- 12$900 to $999
- 62$1,000 to $1,249
- 80$1,250 to $1,499
- 143$1,500 to $1,999
- 12$2,000 to $2,499
- 128$2,500 to $2,999
- 11$3,000 to $3,499
- 98No cash rent
Percentage of workers working in this county: 51.1%
Number of people working at home: 882 (15.8% of all workers)
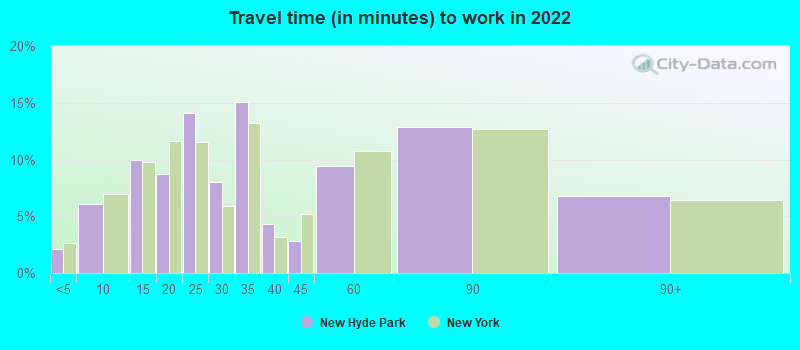
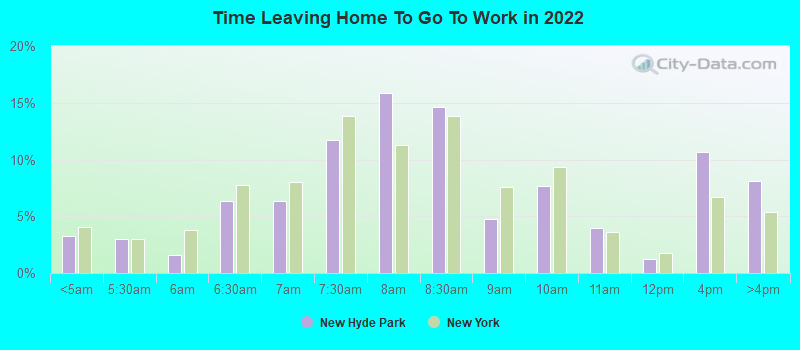
Travel time to work (commute)
- Less than 5 minutes: 71
- 5 to 9 minutes: 141
- 10 to 14 minutes: 487
- 15 to 19 minutes: 287
- 20 to 24 minutes: 622
- 25 to 29 minutes: 163
- 30 to 34 minutes: 674
- 35 to 39 minutes: 173
- 40 to 44 minutes: 238
- 45 to 59 minutes: 498
- 60 to 89 minutes: 1,069
- 90 or more minutes: 316
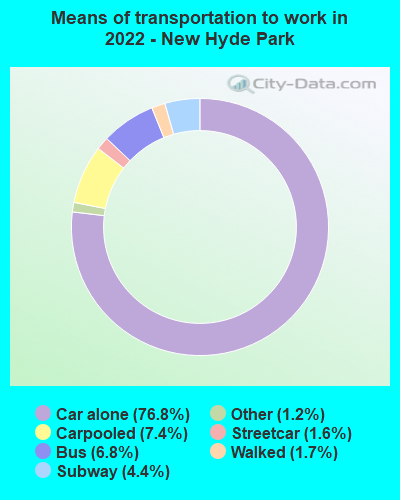
Means of transportation to work:
- Drove a car alone: 4,498 (66.0%)
- Carpooled: 423 (6.2%)
- Bus: 388 (5.7%)
- Subway or elevated rail: 84 (1.2%)
- Long-distance train or commuter rail: 226 (3.3%)
- Taxi: 100 (1.5%)
- Walked: 106 (1.6%)
- Worked at home: 882 (12.9%)
- Unemployment by race in 2022
- Unemployment rate for White non-Hispanic residents
- 1.8%Males
- 5.6%Females
- Unemployment rate for Asian residents
- 3.4%Males
- 2.9%Females
- Unemployment rate for other race residents
- 1.7%Males
- Unemployment rate for Hispanic or Latino residents
- 6.7%Males
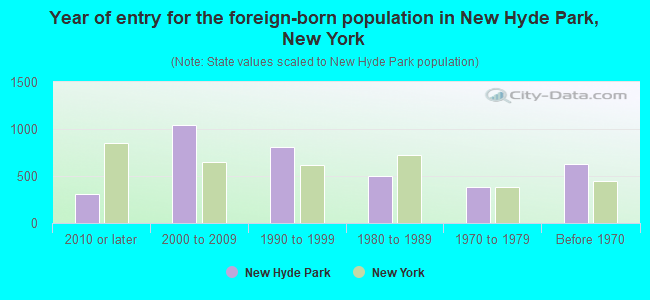
- Year of entry for the foreign-born population in New Hyde Park, New York
- 3112010 or later
- 1,0402000 to 2009
- 8071990 to 1999
- 4981980 to 1989
- 3881970 to 1979
- 631Before 1970
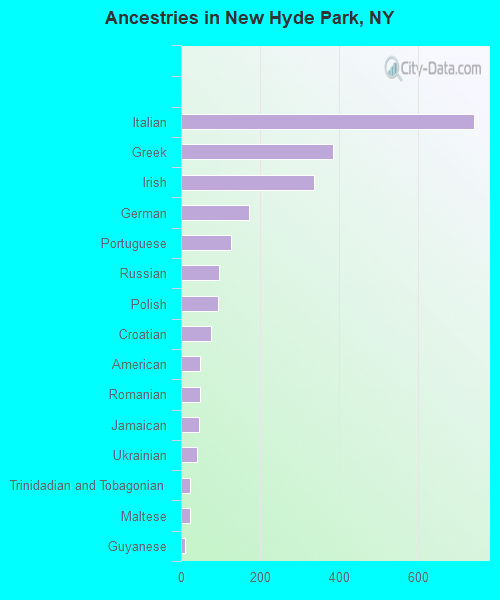
First ancestries reported:
- Italian: 743 (12.7%)
- Greek: 386 (6.6%)
- Irish: 336 (5.8%)
- German: 172 (3.0%)
- Portuguese: 127 (2.2%)
- Russian: 96 (1.6%)
- Polish: 94 (1.6%)
- Croatian: 77 (1.3%)
- American: 48 (0.8%)
- Romanian: 48 (0.8%)
- Jamaican: 45 (0.8%)
- Ukrainian: 41 (0.7%)
- Trinidadian and Tobagonian: 23 (0.4%)
- Maltese: 22 (0.4%)
- Guyanese: 9 (0.2%)
- Turkish: 6 (0.1%)
- English: 1 (0.02%)
- Kenyan: 1 (0.02%)
- Nigerian: 1 (0.02%)
Most common places of birth for foreign-born residents (%):
| New Hyde Park: | 21.8% (679) |
| New York: | 3.5% (158,432) |
| New Hyde Park: | 15.4% (482) |
| New York: | 1.2% (54,759) |
| New Hyde Park: | 10.4% (326) |
| New York: | 9.1% (410,910) |
| New Hyde Park: | 4.2% (132) |
| New York: | 1.2% (55,571) |
| New Hyde Park: | 3.8% (120) |
| New York: | 1.8% (82,786) |
| New Hyde Park: | 3.8% (118) |
| New York: | 0.7% (30,658) |
| New Hyde Park: | 3.6% (112) |
| New York: | 2.5% (111,920) |
| New Hyde Park: | 3.5% (110) |
| New York: | 2.6% (117,288) |
| New Hyde Park: | 2.6% (81) |
| New York: | 1.8% (81,374) |
| New Hyde Park: | 2.4% (76) |
| New York: | 11.1% (501,040) |
| New Hyde Park: | 2.4% (74) |
| New York: | 0.9% (42,220) |
| New Hyde Park: | 2.3% (72) |
| New York: | 0.6% (28,604) |
| New Hyde Park: | 2.3% (71) |
| New York: | 1.4% (62,442) |
| New Hyde Park: | 2.1% (66) |
| New York: | 5.0% (227,557) |
| New Hyde Park: | 1.9% (59) |
| New York: | 1.7% (75,802) |
| New Hyde Park: | 1.8% (56) |
| New York: | 2.0% (91,070) |
| New Hyde Park: | 1.8% (55) |
| New York: | 0.4% (16,179) |
| New Hyde Park: | 1.6% (51) |
| New York: | 1.7% (78,421) |
Place of birth for U.S.-born residents:
- This state: 6,525
- Other state: 287
- Northeast: 163
- Midwest: 24
- South: 14
- West: 83
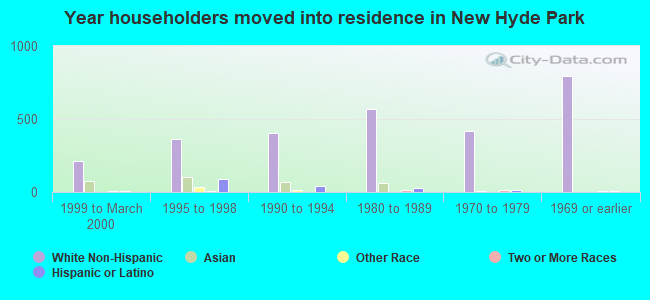
90.9% of New Hyde Park residents lived in the same house 1 years ago.
Out of people who lived in different houses, 36.6% lived in this county.
Out of people who lived in different counties, 97.2% lived in New York.
| New Hyde Park: | 90.9% |
| State average: | 89.6% |
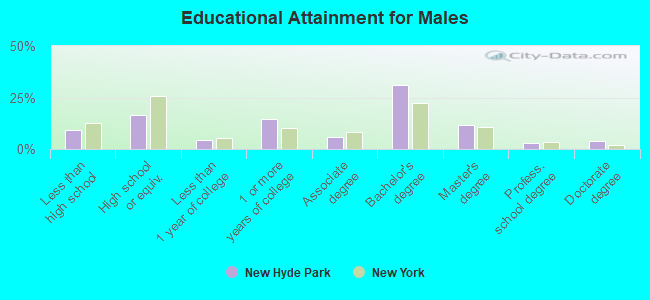
Education attainment for males 25 years and older:
- No schooling: 32
- Nursery to 4th grade: 22
- 5th and 6th grade: 81
- 7th and 8th grade: 7
- 9th grade: 0
- 10th grade: 30
- 11th grade: 26
- 12th grade, no diploma: 122
- High school graduate (or equivalency): 584
- Less than 1 year of college: 156
- Some college more than 1 year, no degree: 520
- Associate degree: 213
- Bachelor's degree: 1,097
- Master's degree: 408
- Professional school degree: 106
- Doctorate degree: 146
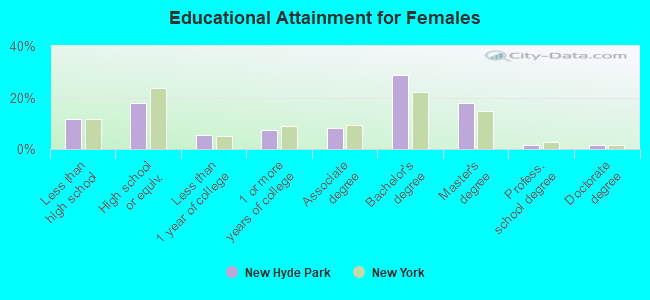
Education attainment for females 25 years and older:
- No schooling: 151
- Nursery to 4th grade: 0
- 5th and 6th grade: 32
- 7th and 8th grade: 13
- 9th grade: 39
- 10th grade: 22
- 11th grade: 24
- 12th grade, no diploma: 150
- High school graduate (or equivalency): 648
- Less than 1 year of college: 200
- Some college more than 1 year, no degree: 272
- Associate degree: 294
- Bachelor's degree: 1,041
- Master's degree: 649
- Professional school degree: 52
- Doctorate degree: 56
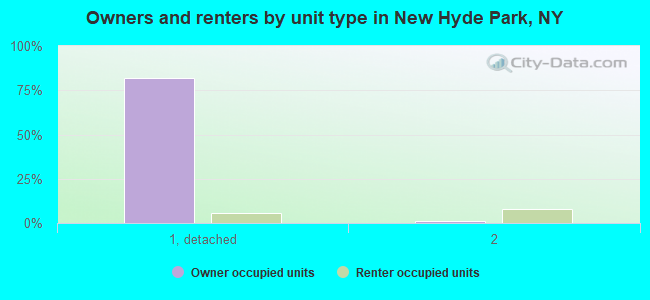
Housing units in structures:
- One, detached: 2,822
- One, attached: 70
- Two: 385
- 3 or 4: 15
- 5 to 9: 46
- 10 to 19: 51
House/condo owner moved in on average 15 years ago
Renter moved in on average 8 years ago
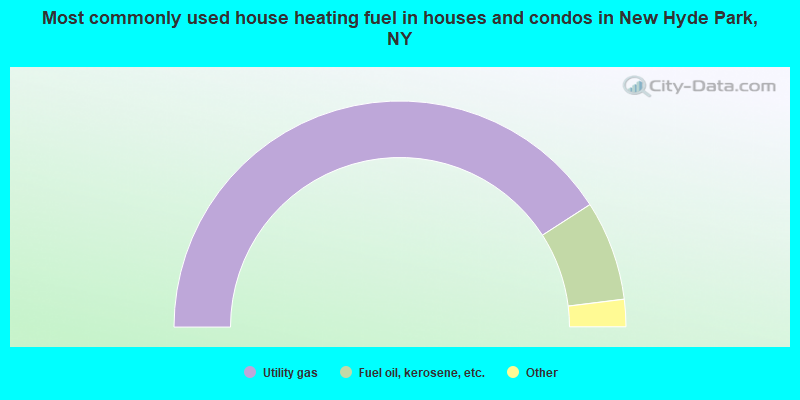
- 81.8%Utility gas
- 14.3%Fuel oil, kerosene, etc.
- 2.9%Electricity
- 0.8%Other fuel
- 0.2%Bottled, tank, or LP gas
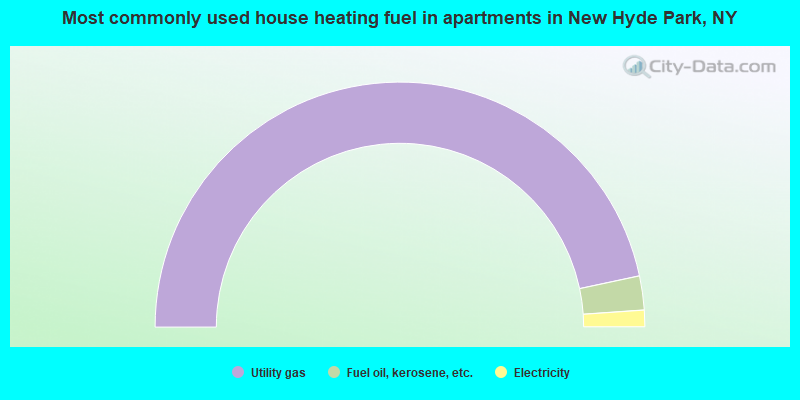
- 93.3%Utility gas
- 4.5%Fuel oil, kerosene, etc.
- 2.2%Electricity
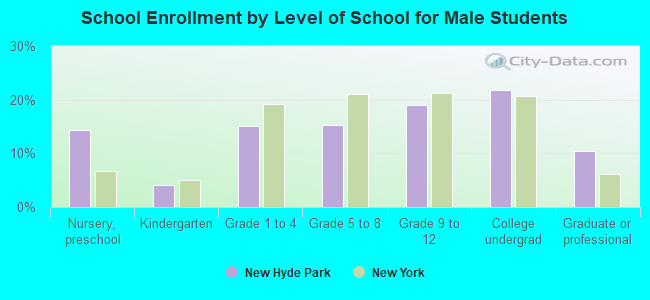
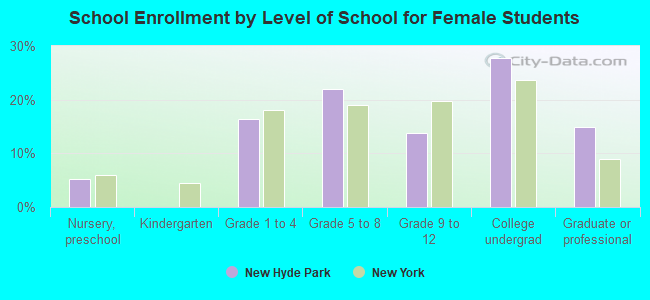
Private vs. public school enrollment:
| Here: | 26.7% |
| New York: | 15.6% |
| Here: | 19.7% |
| New York: | 15.0% |
| Here: | 53.8% |
| New York: | 39.2% |