New Territory, TX (Texas) Houses and Residents
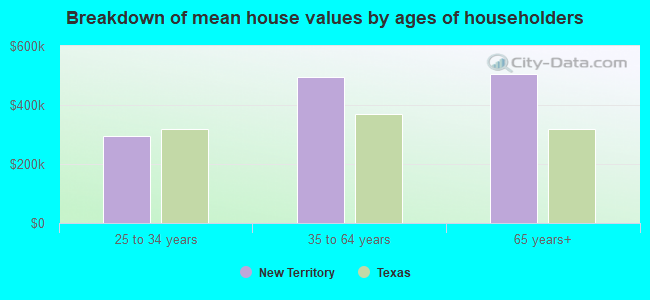
| New Territory: | $509,947 |
| Texas: | $275,400 |
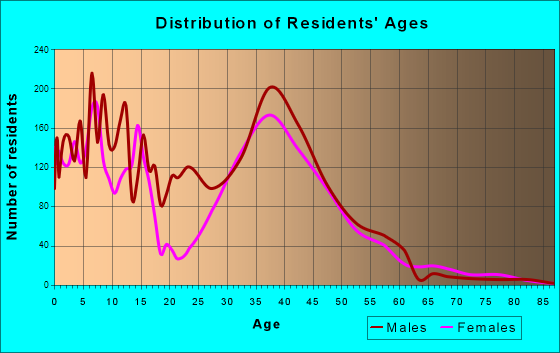
Total population: 15,186 (Urban population: 13,886, Rural population: 0)
Houses: 5,535 (5,320 occupied: 4,452 owner occupied, 918 renter occupied)
| % of renters here: | 17% |
| State: | 38% |
Housing density: 1,097 houses/condos per square mile
Median price asked for vacant for-sale houses and condos in 2022: $873,502.
Median contract rent in 2022: $1,710 (lower quartile is $1,605, upper quartile is over $2,000)
Median rent asked for vacant for-rent units in 2022: $2,723
Median gross rent in New Territory, TX in 2022: $1,896
Housing units in New Territory with a mortgage: 2,609 (24 second mortgage, 121 home equity loan, 6 both second mortgage and home equity loan)
Houses without a mortgage: 1,394
Median household income for houses/condos with a mortgage: $189,931
Median household income for apartments without a mortgage: $232,360
Median monthly housing costs: $2,221


 | Rental apartment in or near Richmond (6 replies) |
| [Real Estate] Need advice from experienced home buyers (21 replies) |
| What was Houston like back in 92ish-2000ish? (93 replies) |
| Moving to Houston: Woodlands vs Katy vs ?? (56 replies) |
| sell or rent my house in Sugar Land (10 replies) |
| Sugar Land Apartments (1 reply) |
Median year apartment built: 2001
Household type by relationship:
Households: 17,306- In family households: 16,904 (2,880 male householders, 1,661 female householders)
4,099 spouses, 6,791 children (6,595 natural, 195 adopted, 0 stepchildren), 197 grandchildren, 96 brothers or sisters, 775 parents, 0 foster children, 362 other relatives, 39 non-relatives
- In nonfamily households: 393 (188 male householders (188 living alone)), 156 female householders (110 living alone)), 48 nonrelatives
- In group quarters: 8
Size of family households: 1,189 2-persons, 1,139 3-persons, 1,367 4-persons, 509 5-persons, 280 6-persons, 66 7-or-more-persons.
Size of nonfamily households: 319 1-person, 54 2-persons.
4,214 married couples with children.
376 single-parent households (44 men, 332 women).
46.2% of residents of New Territory speak English at home.
5.8% of residents speak Spanish at home (82% speak English very well, 14% speak English well, 4% speak English not well).
28.5% of residents speak other Indo-European language at home (78% speak English very well, 9% speak English well, 7% speak English not well, 5% don't speak English at all).
20.3% of residents speak Asian or Pacific Island language at home (72% speak English very well, 22% speak English well, 6% speak English not well).
4.6% of residents speak other language at home (85% speak English very well, 3% speak English well, 9% speak English not well, 4% don't speak English at all).
Foreign born population: 8,522 (46.7%)
(65.9% of them are naturalized citizens)
| Here: | 8.3 |
| State: | 6.3 |
| Here: | 4.0 |
| State: | 4.0 |
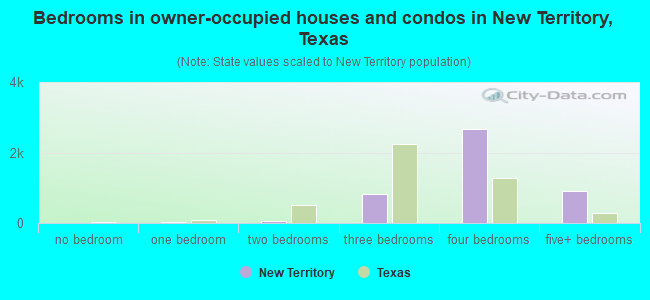
- Bedrooms in owner-occupied houses and condos in New Territory, Texas
- 0no bedroom
- 241 bedroom
- 482 bedrooms
- 8153 bedrooms
- 2,6674 bedrooms
- 8985+ bedrooms
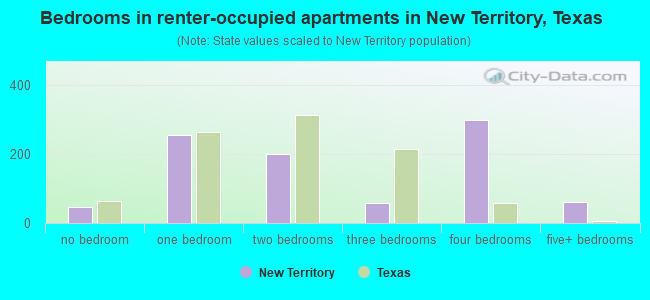
- Bedrooms in renter-occupied apartments in New Territory, Texas
- 47no bedroom
- 2531 bedroom
- 2002 bedrooms
- 583 bedrooms
- 2984 bedrooms
- 625+ bedrooms
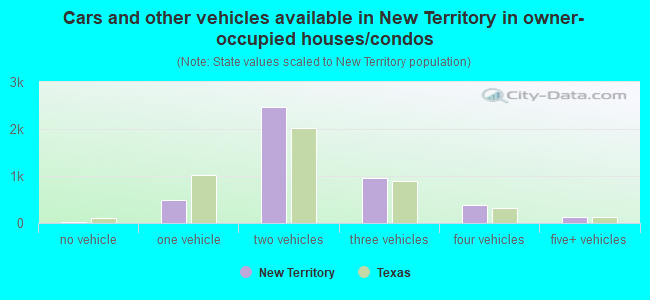
- Cars and other vehicles available in New Territory in owner-occupied houses/condos
- 23no vehicle
- 4831 vehicle
- 2,4672 vehicles
- 9603 vehicles
- 3894 vehicles
- 1315+ vehicles
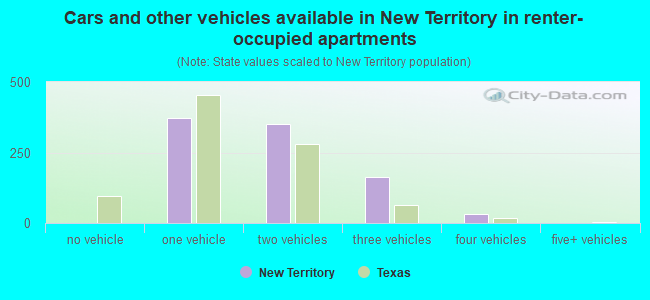
- Cars and other vehicles available in New Territory in renter-occupied apartments
- 0no vehicle
- 3731 vehicle
- 3522 vehicles
- 1623 vehicles
- 314 vehicles
- 05+ vehicles
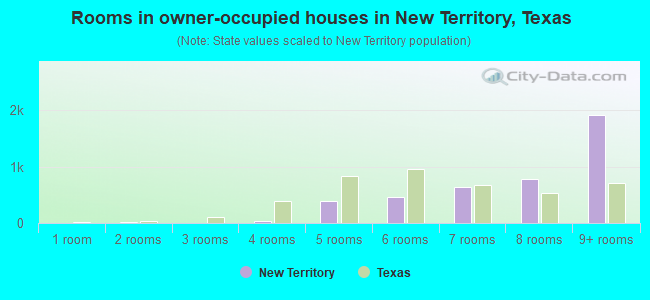
- Rooms in owner-occupied houses in New Territory, Texas
- 01 room
- 232 rooms
- 03 rooms
- 404 rooms
- 3935 rooms
- 4636 rooms
- 6437 rooms
- 7758 rooms
- 1,9159+ rooms
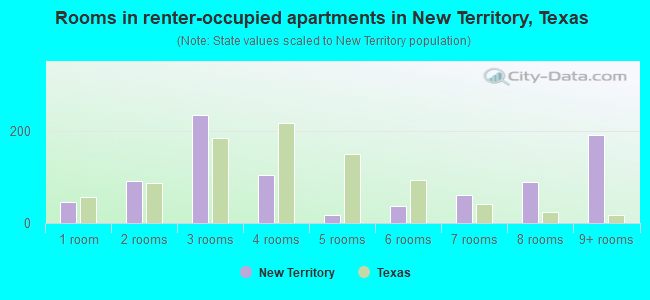
- Rooms in renter-occupied apartments in New Territory, Texas
- 451 room
- 922 rooms
- 2363 rooms
- 1054 rooms
- 185 rooms
- 376 rooms
- 627 rooms
- 898 rooms
- 1939+ rooms
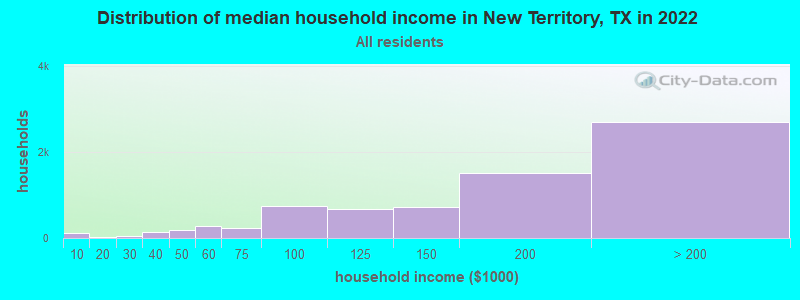
New Territory, TX household income distribution

- 118Less than $10,000
- 27$10,000 to $19,999
- 38$20,000 to $29,999
- 135$30,000 to $39,999
- 194$40,000 to $49,999
- 291$50,000 to $59,999
- 223$60,000 to $74,999
- 738$75,000 to $99,999
- 685$100,000 to $124,999
- 720$125,000 to $149,999
- 1,515$150,000 to $199,999
- 2,701$200,000 or more
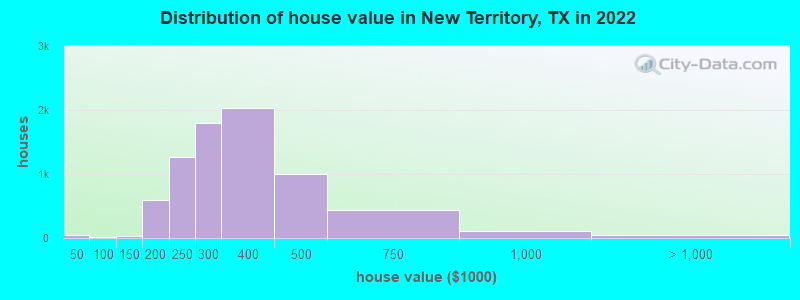
Home value of owner - occupied houses in 2022 in New Territory, TX
-
- 4Less than $10,000
- 5$15,000 to $19,999
- 29$20,000 to $24,999
- 9$25,000 to $29,999
- 13$70,000 to $79,999
- 9$100,000 to $124,999
- 17$125,000 to $149,999
- 131$150,000 to $174,999
- 462$175,000 to $199,999
- 1,264$200,000 to $249,999
- 1,799$250,000 to $299,999
- 2,036$300,000 to $399,999
- 1,005$400,000 to $499,999
- 435$500,000 to $749,999
- 112$750,000 to $999,999
- 51$1,000,000 to $1,499,999
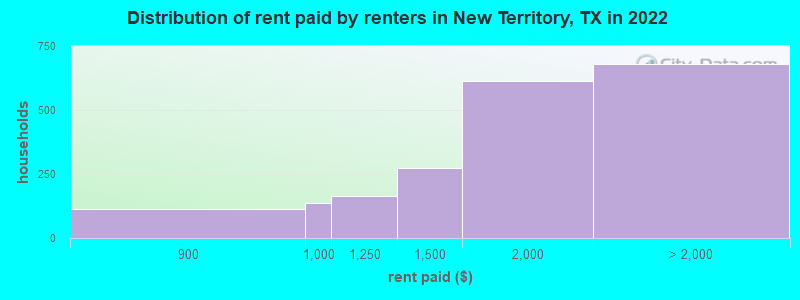
Rent paid by renters in 2022 in New Territory, TX
-
- 113$800 to $899
- 136$900 to $999
- 163$1,000 to $1,249
- 271$1,250 to $1,499
- 613$1,500 to $1,999
- 515$2,000 to $2,499
- 69$2,500 to $2,999
- 93No cash rent
Percentage of workers working in this county: 39.9%
Number of people working at home: 1,903 (21.9% of all workers)
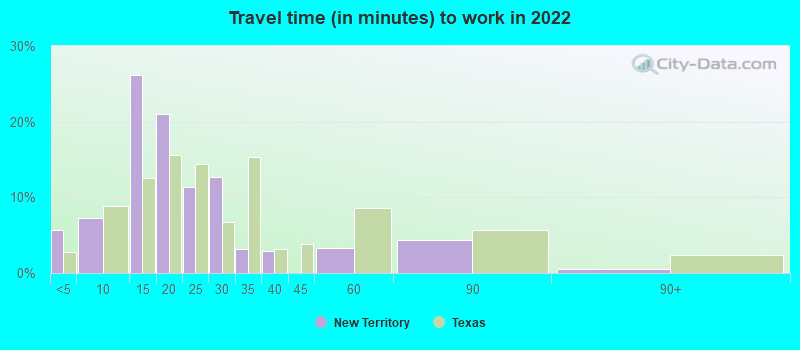
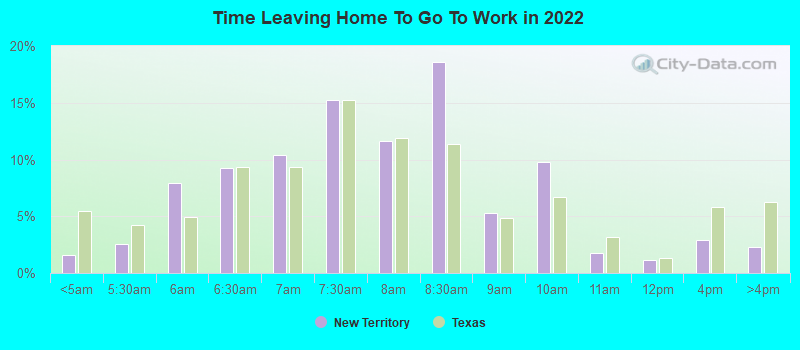
Travel time to work (commute)
- Less than 5 minutes: 112
- 5 to 9 minutes: 353
- 10 to 14 minutes: 645
- 15 to 19 minutes: 628
- 20 to 24 minutes: 445
- 25 to 29 minutes: 371
- 30 to 34 minutes: 1,724
- 35 to 39 minutes: 586
- 40 to 44 minutes: 639
- 45 to 59 minutes: 1,431
- 60 to 89 minutes: 582
- 90 or more minutes: 73
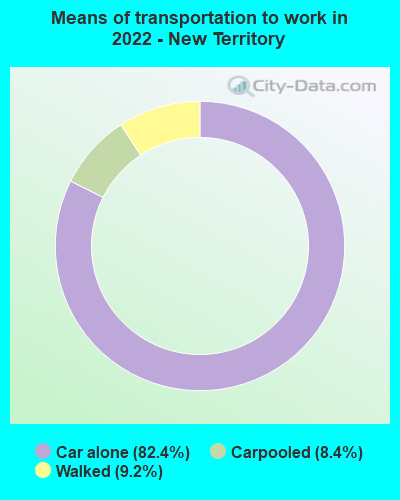
Means of transportation to work:
- Drove a car alone: 740 (46.0%)
- Carpooled: 74 (4.6%)
- Walked: 71 (4.4%)
- Worked at home: 1,708 (106.2%)
- Unemployment by race in 2022
- Unemployment rate for White non-Hispanic residents
- 8.3%Males
- 3.2%Females
- Unemployment rate for Black residents
- 3.1%Males
- 4.8%Females
- Unemployment rate for Asian residents
- 3.1%Males
- 2.6%Females
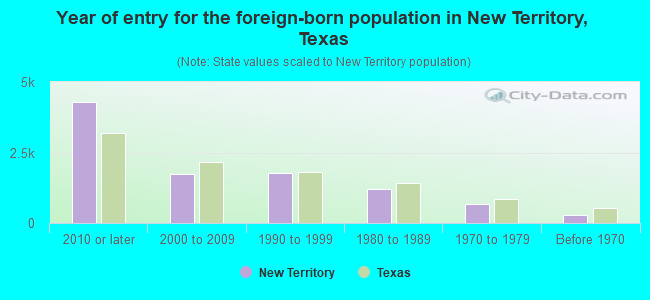
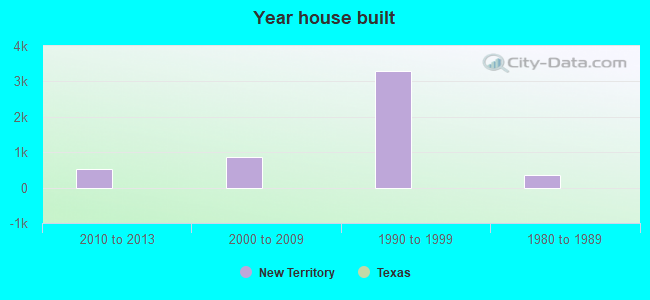
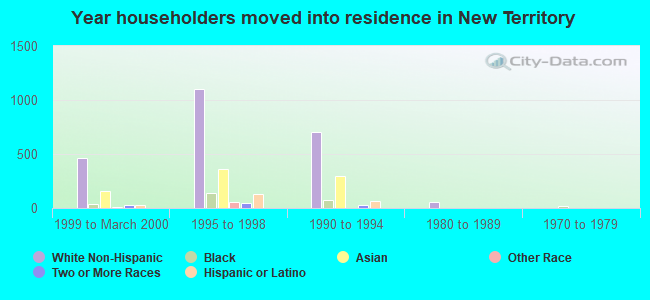
- Year of entry for the foreign-born population in New Territory, Texas
- 4,2992010 or later
- 1,7352000 to 2009
- 1,7751990 to 1999
- 1,2171980 to 1989
- 6651970 to 1979
- 272Before 1970
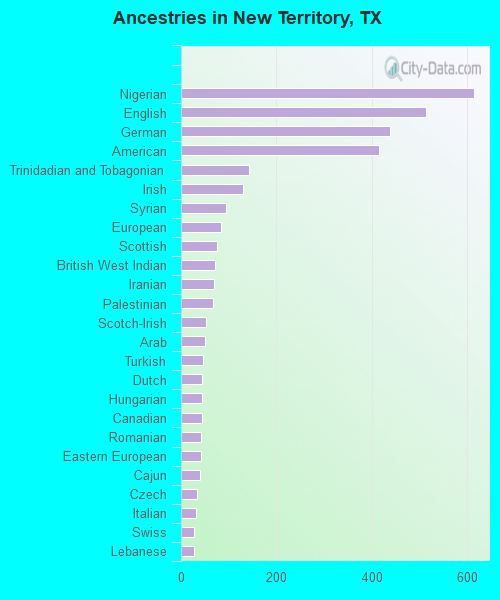
First ancestries reported:
- Nigerian: 615 (5.6%)
- English: 513 (4.7%)
- German: 438 (4.0%)
- American: 415 (3.8%)
- Trinidadian and Tobagonian: 142 (1.3%)
- Irish: 130 (1.2%)
- Syrian: 95 (0.9%)
- European: 83 (0.8%)
- Scottish: 76 (0.7%)
- British West Indian: 72 (0.7%)
- Iranian: 69 (0.6%)
- Palestinian: 68 (0.6%)
- Scotch-Irish: 52 (0.5%)
- Arab: 51 (0.5%)
- Turkish: 47 (0.4%)
- Dutch: 44 (0.4%)
- Hungarian: 44 (0.4%)
- Canadian: 43 (0.4%)
- Romanian: 41 (0.4%)
- Eastern European: 41 (0.4%)
- Cajun: 40 (0.4%)
- Czech: 33 (0.3%)
- Italian: 31 (0.3%)
- Swiss: 28 (0.3%)
- Lebanese: 27 (0.2%)
- Egyptian: 26 (0.2%)
- Polish: 24 (0.2%)
- African: 23 (0.2%)
- French Canadian: 22 (0.2%)
- Jordanian: 14 (0.1%)
- Cypriot: 13 (0.1%)
- Danish: 13 (0.1%)
- Australian: 12 (0.1%)
- Celtic: 11 (0.1%)
- Russian: 11 (0.1%)
- French: 4 (0.04%)
Most common places of birth for foreign-born residents (%):
| New Territory: | 38.6% (2,866) |
| Texas: | 100.0% (-1) |
| New Territory: | 18.2% (1,352) |
| Texas: | 100.0% (-1) |
| New Territory: | 9.1% (673) |
| Texas: | 100.0% (-1) |
| New Territory: | 7.8% (583) |
| Texas: | 100.0% (-1) |
| New Territory: | 3.8% (281) |
| Texas: | 100.0% (-1) |
| New Territory: | 2.8% (210) |
| Texas: | 100.0% (-1) |
| New Territory: | 2.0% (149) |
| Texas: | 100.0% (-1) |
| New Territory: | 1.7% (129) |
| Texas: | 100.0% (-1) |
| New Territory: | 1.6% (122) |
| Texas: | 100.0% (-1) |
Place of birth for U.S.-born residents:
- This state: 5,966
- Other state: 3,627
- Northeast: 838
- Midwest: 909
- South: 1,411
- West: 414
94.0% of New Territory residents lived in the same house 1 years ago.
Out of people who lived in different houses, 38.6% lived in this county.
Out of people who lived in different counties, 53.4% lived in Texas.
| New Territory: | 94.0% |
| State average: | 85.7% |
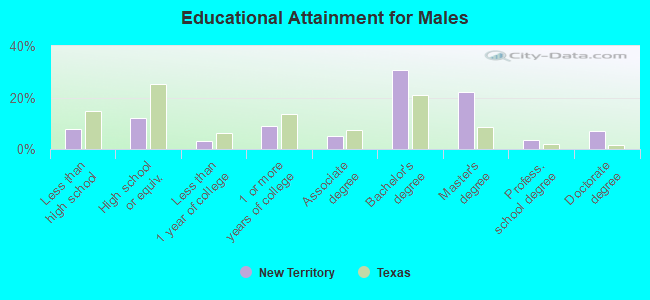
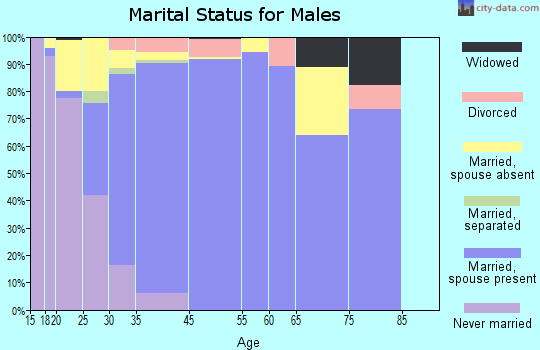
Education attainment for males 25 years and older:
- No schooling: 189
- Nursery to 4th grade: 41
- 5th and 6th grade: 5
- 7th and 8th grade: 0
- 9th grade: 2
- 10th grade: 52
- 11th grade: 17
- 12th grade, no diploma: 194
- High school graduate (or equivalency): 772
- Less than 1 year of college: 189
- Some college more than 1 year, no degree: 563
- Associate degree: 315
- Bachelor's degree: 1,952
- Master's degree: 1,427
- Professional school degree: 220
- Doctorate degree: 456
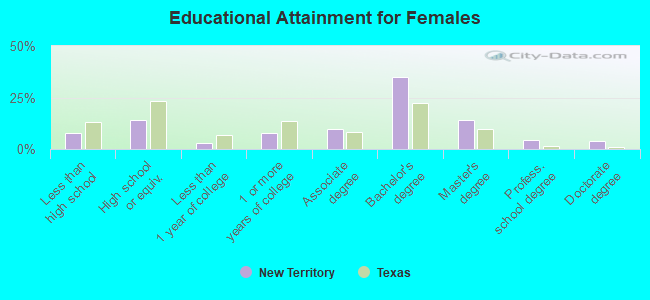
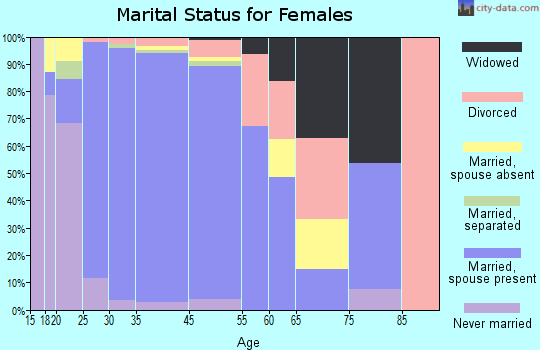
Education attainment for females 25 years and older:
- No schooling: 238
- Nursery to 4th grade: 29
- 5th and 6th grade: 0
- 7th and 8th grade: 7
- 9th grade: 0
- 10th grade: 44
- 11th grade: 0
- 12th grade, no diploma: 165
- High school graduate (or equivalency): 910
- Less than 1 year of college: 191
- Some college more than 1 year, no degree: 489
- Associate degree: 621
- Bachelor's degree: 2,229
- Master's degree: 901
- Professional school degree: 287
- Doctorate degree: 256
Housing units in structures:
- One, detached: 4,567
- Two: 30
- 5 to 9: 149
- 10 to 19: 77
- 20 to 49: 207
- 50 or more: 164
- Mobile homes: 81
Median worth of mobile homes: $16,792
Housing units lacking complete kitchen facilities in 2022: 1.7%
House/condo owner moved in on average 12 years ago
Renter moved in on average 3 years ago
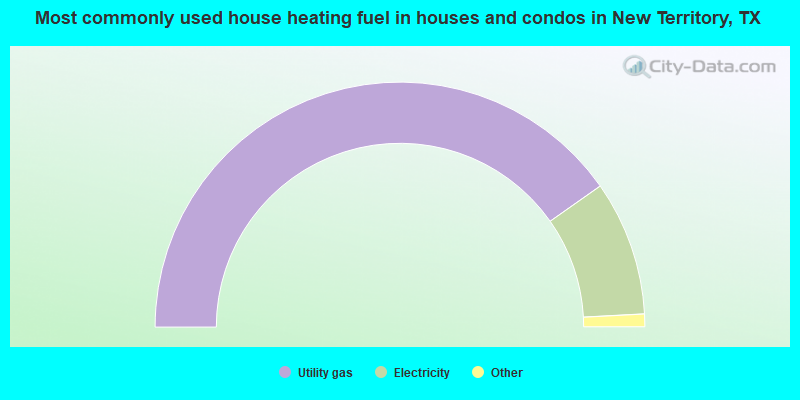
- 80.5%Utility gas
- 17.8%Electricity
- 1.1%No fuel used
- 0.6%Other fuel
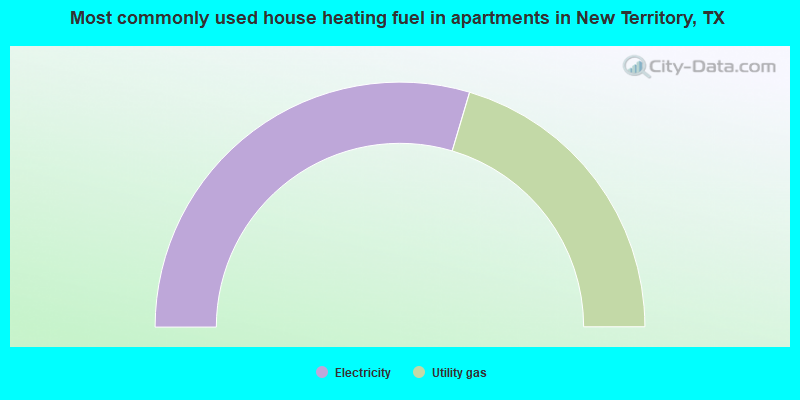
- 59.2%Electricity
- 40.8%Utility gas
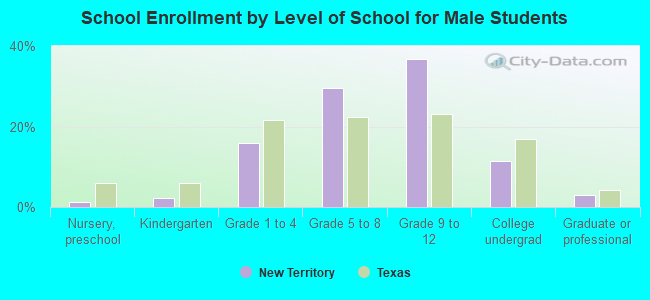
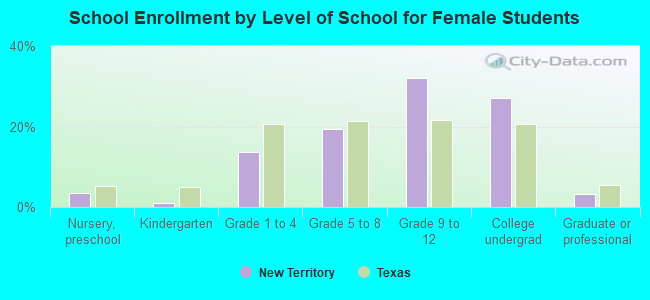
Private vs. public school enrollment:
| Here: | 3.2% |
| Texas: | 8.8% |
| Here: | 16.3% |
| Texas: | 8.0% |
| Here: | 18.8% |
| Texas: | 16.2% |