North Bethesda, MD (Maryland) Houses and Residents
| North Bethesda: | $744,953 |
| Maryland: | $398,100 |
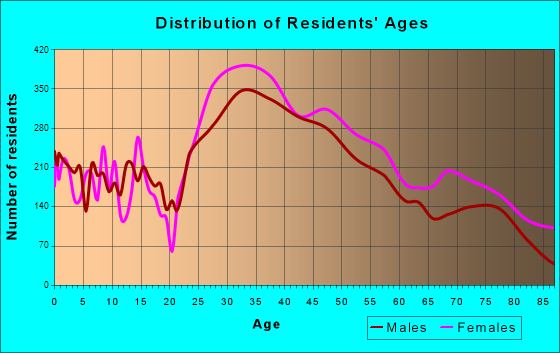
Total population: 43,828 (Urban population: 38,643, Rural population: 0)
Houses: 23,208 (21,886 occupied: 10,851 owner occupied, 11,201 renter occupied)
| % of renters here: | 51% |
| State: | 32% |
Housing density: 2,574 houses/condos per square mile
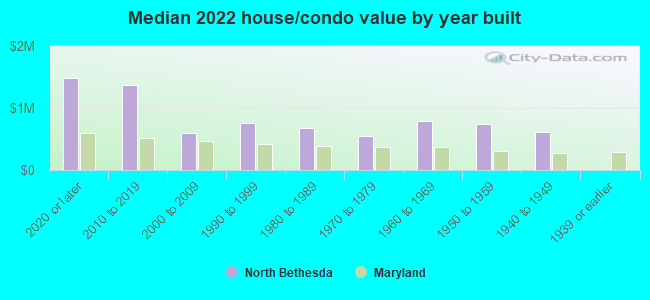
Median price asked for vacant for-sale houses and condos in 2022: $647,794.
Median contract rent in 2022: $1,908 (lower quartile is $1,550, upper quartile is over $2,000)
Median rent asked for vacant for-rent units in 2022: $2,006
Median gross rent in North Bethesda, MD in 2022: over $2,000
Housing units in North Bethesda with a mortgage: 6,744 (548 second mortgage, 6 home equity loan, 446 both second mortgage and home equity loan)
Houses without a mortgage: 216
Median household income for houses/condos with a mortgage: $193,215
Median household income for apartments without a mortgage: $138,035
Median monthly housing costs: $2,010
Compare current foreclosures near North Bethesda, MD:
| Photo | Address | Area | Beds / Baths | Price | Details |
|---|---|---|---|---|---|

|
#1
17th St NW Apt 504
Washington, DC 20009
|
800 sq. feet
|
1 baths 1 beds |
$419,900
|
show details |

|
#2
Eastern Ave NE
Washington, DC 20011
|
1,024 sq. feet
|
1 baths 3 beds |
$395,000
|
show details |

|
#3
Brooke Knolls Rd
Gaithersburg, MD 20882
|
1,704 sq. feet
|
3 baths 4 beds |
$681,500
|
show details |

|
#4
Cathedral Ave NW Apt 108
Washington, DC 20016
|
765 sq. feet
|
1 baths 1 beds |
$279,900
|
show details |

|
#5
Pooks Hill Rd Apt 1612s
Bethesda, MD 20814
|
1,250 sq. feet
|
1 baths 2 beds |
$289,000
|
show details |

|
#6
19th St NW
Washington, DC 20036
|
2,515 sq. feet
|
6 baths 8 beds |
$1,684,800
|
show details |

|
#7
Hammersmith Cir
Silver Spring, MD 20906
|
1,152 sq. feet
|
1 baths 3 beds |
$353,600
|
show details |

|
#8
Interlachen Dr Apt 111
Silver Spring, MD 20906
|
965 sq. feet
|
1 baths 2 beds |
$148,000
|
show details |

|
#9
T St SE Apt 3
Washington, DC 20020
|
- sq. feet
|
2 baths 4 beds |
$339,900
|
show details |

|
#10
Delaware Ave SW Apt N720
Washington, DC 20024
|
- sq. feet
|
1 baths 1 beds |
$155,000
|
show details |
| Photo | Address | Area | Beds / Baths | Price | Details |
|---|---|---|---|---|---|

|
#11
Walkers Choice Rd Apt 5
Montgomery Village, MD 20886
|
894 sq. feet
|
1 baths 1 beds |
show details | |

|
#12
Ruby Lockhart Blvd 1
Lanham, MD 20706
|
1,600 sq. feet
|
3 baths 3 beds |
show details | |

|
#13
Caledonia Ct Apt K
Germantown, MD 20874
|
1,087 sq. feet
|
2 baths 2 beds |
show details | |

|
#14
4th St NE Apt 2
Washington, DC 20002
|
1,061 sq. feet
|
2 baths 2 beds |
show details | |

|
#15
Toledo Ter Apt 423
Hyattsville, MD 20782
|
744 sq. feet
|
1 baths 1 beds |
show details | |

|
#16
Brock Bridge Rd
Laurel, MD 20724
|
1,428 sq. feet
|
1 baths 4 beds |
show details | |

|
#17
Webster St NW
Washington, DC 20011
|
1,116 sq. feet
|
1 baths 3 beds |
show details | |

|
#18
Floral Dr
Hyattsville, MD 20783
|
1,178 sq. feet
|
3 baths 5 beds |
show details | |

|
#19
S George Mason Dr Unit 918n
Falls Church, VA 22041
|
752 sq. feet
|
1 baths 1 beds |
show details | |

|
#20
Astor Pl SE
Washington, DC 20019
|
2,516 sq. feet
|
4 baths 4 beds |
show details |
| Photo | Address | Area | Beds / Baths | Price | Details |
|---|---|---|---|---|---|

|
#21
Connecticut Ave NW Apt 606
Washington, DC 20008
|
160 sq. feet
|
1 baths 1 beds |
show details | |

|
#22
N Royal St
Alexandria, VA 22314
|
- sq. feet
|
1 baths 1 beds |
show details | |

|
#23
Edwards Way Apt 102
Hyattsville, MD 20783
|
812 sq. feet
|
1 baths 1 beds |
show details | |

|
#24
Schwenger Pl
Herndon, VA 20170
|
1,530 sq. feet
|
2 baths 3 beds |
show details | |

|
#25
Wahler Pl SE
Washington, DC 20032
|
1,364 sq. feet
|
2 baths 3 beds |
show details | |

|
#26
New Mark Esplanade
Rockville, MD 20850
|
1,428 sq. feet
|
3 baths 2 beds |
show details | |

|
#27
12th St NW
Washington, DC 20012
|
2,163 sq. feet
|
2 baths 5 beds |
show details | |

|
#28
Girard St NE
Washington, DC 20017
|
1,270 sq. feet
|
1 baths 3 beds |
show details | |

|
#29
Dana Dr
Hyattsville, MD 20783
|
2,380 sq. feet
|
2 baths 3 beds |
show details | |

|
#30
Hunt Club Dr
Potomac, MD 20854
|
3,600 sq. feet
|
3 baths 4 beds |
show details |
| Photo | Address | Area | Beds / Baths | Price | Details |
|---|---|---|---|---|---|

|
#31
Brassie Pl Apt 201
Montgomery Village, MD 20886
|
1,050 sq. feet
|
2 baths 2 beds |
show details | |

|
#32
Oklahoma Ave NE Apt 203
Washington, DC 20002
|
- sq. feet
|
1 baths 1 beds |
show details | |

|
#33
Scott Ave
Rockville, MD 20851
|
1,188 sq. feet
|
1 baths 3 beds |
show details | |

|
#34
Barnaby St SE
Washington, DC 20032
|
2,092 sq. feet
|
2 baths 4 beds |
show details | |

|
#35
Winthrop St
Oxon Hill, MD 20745
|
1,020 sq. feet
|
1 baths 3 beds |
show details | |

|
#36
S Arbory Ln
Laurel, MD 20707
|
1,283 sq. feet
|
3 baths 3 beds |
show details | |

|
#37
Webster St NE
Washington, DC 20011
|
1,332 sq. feet
|
2 baths 2 beds |
show details | |

|
#38
T Pl SE
Washington, DC 20020
|
900 sq. feet
|
2 baths 2 beds |
show details | |

|
#39
Sunrise Valley Dr
Reston, VA 20191
|
980 sq. feet
|
2 baths 2 beds |
show details | |

|
#40
Harbour Town Dr
Silver Spring, MD 20905
|
5,292 sq. feet
|
4 baths 5 beds |
show details |
| Photo | Address | Area | Beds / Baths | Price | Details |
|---|---|---|---|---|---|

|
#41
Glen Eagles Dr
Silver Spring, MD 20906
|
3,328 sq. feet
|
3 baths 4 beds |
show details | |

|
#42
Saint Bernadines Way
Capitol Heights, MD 20743
|
1,176 sq. feet
|
1 baths 3 beds |
show details | |

|
#43
Ridge Rd SE
Washington, DC 20019
|
720 sq. feet
|
2 baths 1 beds |
show details | |

|
#44
Deanwood Dr
Capitol Heights, MD 20743
|
640 sq. feet
|
1 baths 1 beds |
show details | |

|
#45
Sweet Autumn Dr Apt 301
Gaithersburg, MD 20879
|
785 sq. feet
|
1 baths 1 beds |
show details | |

|
#46
Aquarius Ave
Silver Spring, MD 20906
|
1,407 sq. feet
|
2 baths 4 beds |
show details | |

|
#47
46th St SE
Washington, DC 20019
|
1,232 sq. feet
|
2 baths 3 beds |
show details | |

|
#48
Peppertree Ln
Silver Spring, MD 20906
|
1,309 sq. feet
|
2 baths 3 beds |
show details | |

|
#49
Rock Creek Church Rd NW
Washington, DC 20010
|
2,463 sq. feet
|
3 baths 6 beds |
show details | |

|
Check over 1 million property listings on Foreclosure.com!
|
browse all offers | |||


 | Townhomes to Rent in North Bethesda (2 replies) |
| Neighborhoods with non-cookie cutter homes? (9 replies) |
| Downtown Rockville vs "North Bethesda" Market: Plus let's talk modern apartments (14 replies) |
| Pet Rent and MD apartments... (4 replies) |
| Townhomes in Bethesda/North Bethesda/Rockville (7 replies) |
| Am I alone in hating Montgomery County? (258 replies) |
Median year apartment built: 1991
Household type by relationship:
Households: 49,556- Male householders: 11,122 (3,252 living alone), Female householders: 10,501 (4,529 living alone)
9,432 spouses (9,289 opposite-sex spouses), 1,531 unmarried partners, (1,481 opposite-sex unmarried partners), 11,519 children (11,228 natural, 143 adopted, 148 stepchildren), 493 grandchildren, 528 brothers or sisters, 671 parents, 0 foster children, 525 other relatives, 2,116 non-relatives
- In group quarters: 1,112
Size of family households: 5,406 2-persons, 2,589 3-persons, 2,575 4-persons, 637 5-persons, 184 6-persons, 95 7-or-more-persons.
Size of nonfamily households: 8,888 1-person, 1,611 2-persons, 279 3-persons, 91 4-persons.
6,824 married couples with children.
1,916 single-parent households (397 men, 1,519 women).
61.4% of residents of North Bethesda speak English at home.
12.8% of residents speak Spanish at home (62% speak English very well, 16% speak English well, 16% speak English not well, 7% don't speak English at all).
12.2% of residents speak other Indo-European language at home (75% speak English very well, 16% speak English well, 9% speak English not well).
9.5% of residents speak Asian or Pacific Island language at home (56% speak English very well, 33% speak English well, 10% speak English not well, 2% don't speak English at all).
3.6% of residents speak other language at home (89% speak English very well, 9% speak English well, 2% speak English not well).
Foreign born population: 16,308 (32.9%)
(55.0% of them are naturalized citizens)
| Here: | 6.7 |
| State: | 7.3 |
| Here: | 3.6 |
| State: | 4.2 |
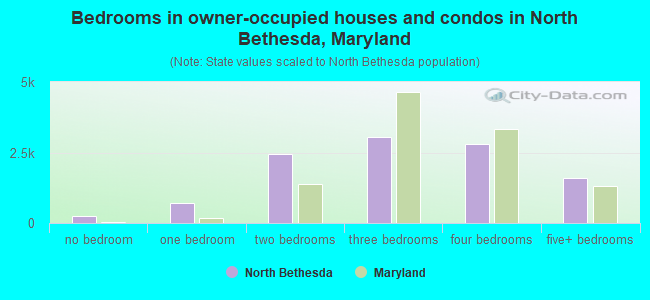
- Bedrooms in owner-occupied houses and condos in North Bethesda, Maryland
- 240no bedroom
- 7121 bedroom
- 2,4412 bedrooms
- 3,0573 bedrooms
- 2,7924 bedrooms
- 1,6115+ bedrooms
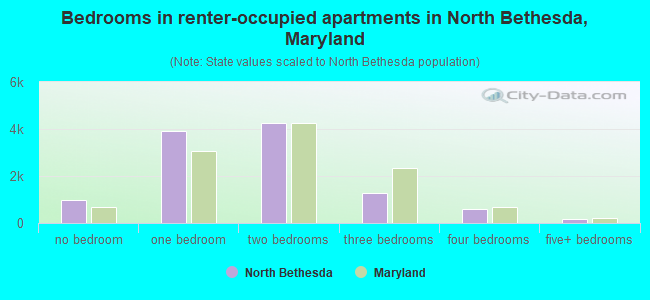
- Bedrooms in renter-occupied apartments in North Bethesda, Maryland
- 977no bedroom
- 3,9031 bedroom
- 4,2652 bedrooms
- 1,2803 bedrooms
- 6024 bedrooms
- 1755+ bedrooms
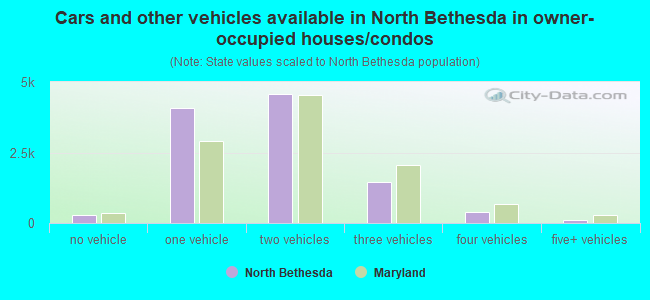
- Cars and other vehicles available in North Bethesda in owner-occupied houses/condos
- 292no vehicle
- 4,0661 vehicle
- 4,5602 vehicles
- 1,4533 vehicles
- 3734 vehicles
- 1075+ vehicles
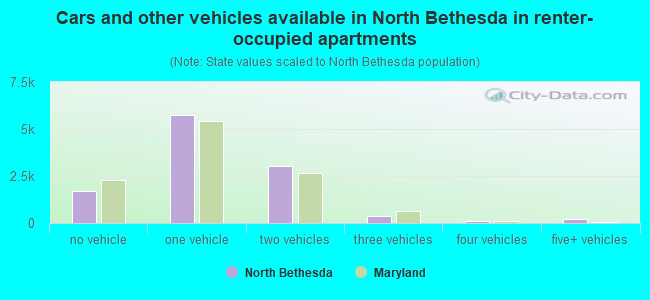
- Cars and other vehicles available in North Bethesda in renter-occupied apartments
- 1,708no vehicle
- 5,7491 vehicle
- 3,0492 vehicles
- 3833 vehicles
- 1234 vehicles
- 1895+ vehicles
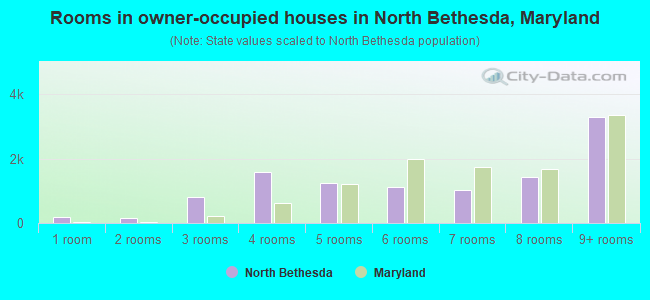
- Rooms in owner-occupied houses in North Bethesda, Maryland
- 1851 room
- 1612 rooms
- 8033 rooms
- 1,5754 rooms
- 1,2425 rooms
- 1,1236 rooms
- 1,0317 rooms
- 1,4228 rooms
- 3,3099+ rooms
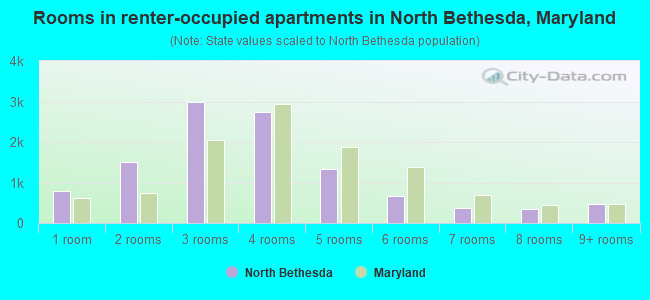
- Rooms in renter-occupied apartments in North Bethesda, Maryland
- 7901 room
- 1,5112 rooms
- 2,9853 rooms
- 2,7384 rooms
- 1,3315 rooms
- 6716 rooms
- 3727 rooms
- 3418 rooms
- 4619+ rooms
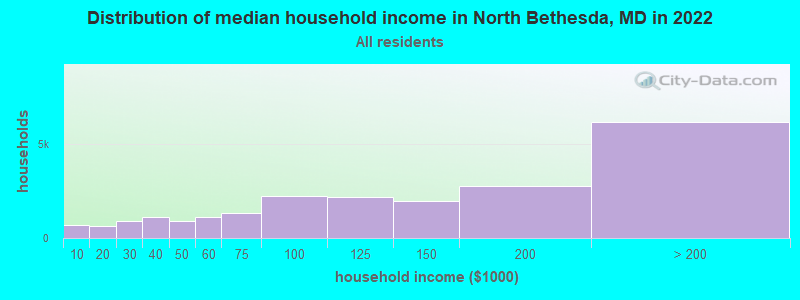
North Bethesda, MD household income distribution

- 677Less than $10,000
- 648$10,000 to $19,999
- 905$20,000 to $29,999
- 1,107$30,000 to $39,999
- 929$40,000 to $49,999
- 1,116$50,000 to $59,999
- 1,346$60,000 to $74,999
- 2,205$75,000 to $99,999
- 2,189$100,000 to $124,999
- 1,947$125,000 to $149,999
- 2,742$150,000 to $199,999
- 6,163$200,000 or more
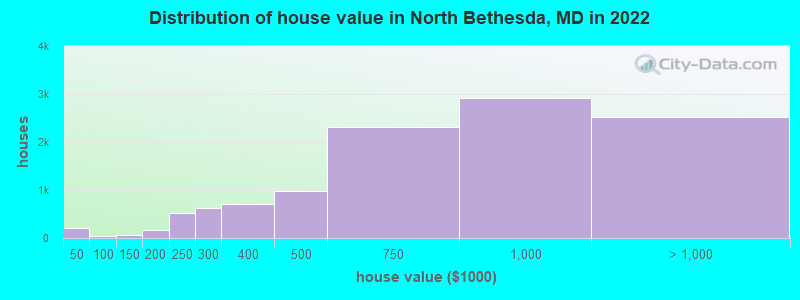
Home value of owner - occupied houses in 2022 in North Bethesda, MD
-
- 132Less than $10,000
- 28$10,000 to $14,999
- 43$35,000 to $39,999
- 32$50,000 to $59,999
- 1$70,000 to $79,999
- 3$80,000 to $89,999
- 37$100,000 to $124,999
- 16$125,000 to $149,999
- 34$150,000 to $174,999
- 128$175,000 to $199,999
- 512$200,000 to $249,999
- 630$250,000 to $299,999
- 701$300,000 to $399,999
- 975$400,000 to $499,999
- 2,305$500,000 to $749,999
- 2,924$750,000 to $999,999
- 1,630$1,000,000 to $1,499,999
- 652$1,500,000 to $1,999,999
- 229$2,000,000 or more
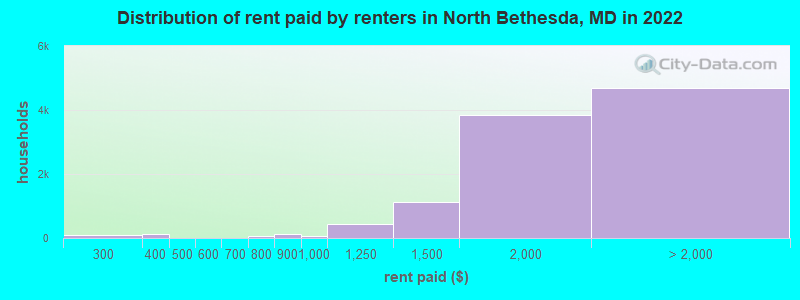
Rent paid by renters in 2022 in North Bethesda, MD
-
- 42$200 to $249
- 37$250 to $299
- 69$300 to $349
- 59$350 to $399
- 10$500 to $549
- 51$700 to $749
- 15$750 to $799
- 137$800 to $899
- 51$900 to $999
- 449$1,000 to $1,249
- 1,140$1,250 to $1,499
- 3,832$1,500 to $1,999
- 2,106$2,000 to $2,499
- 1,342$2,500 to $2,999
- 603$3,000 to $3,499
- 481$3,500 or more
- 148No cash rent
Percentage of workers working in this county: 76.2%
Number of people working at home: 10,181 (36.9% of all workers)
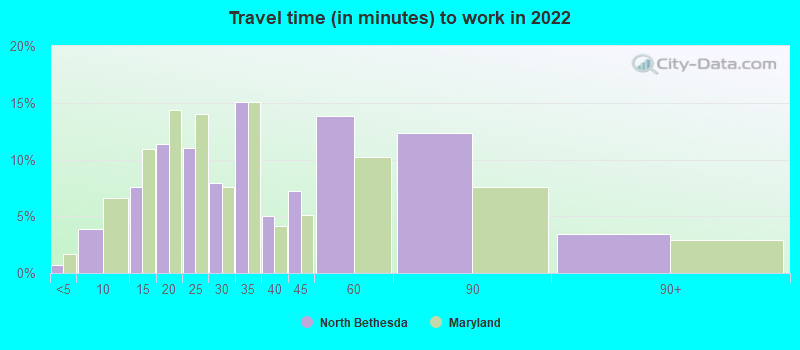
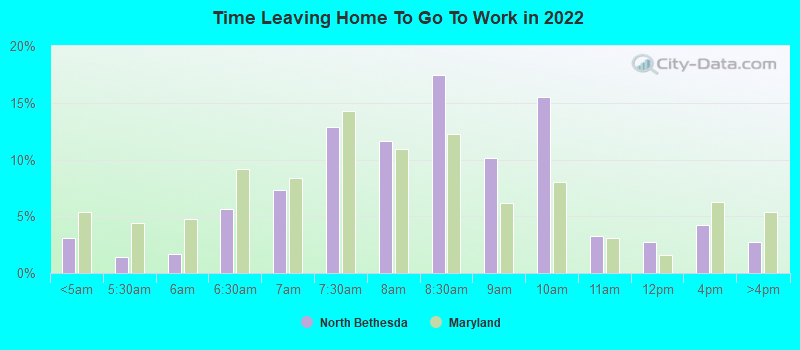
Travel time to work (commute)
- Less than 5 minutes: 209
- 5 to 9 minutes: 1,026
- 10 to 14 minutes: 1,938
- 15 to 19 minutes: 2,991
- 20 to 24 minutes: 2,240
- 25 to 29 minutes: 1,345
- 30 to 34 minutes: 2,347
- 35 to 39 minutes: 932
- 40 to 44 minutes: 1,484
- 45 to 59 minutes: 2,150
- 60 to 89 minutes: 1,370
- 90 or more minutes: 262
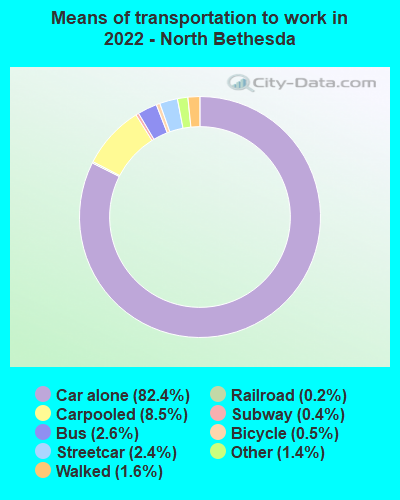
Means of transportation to work:
- Drove a car alone: 29,611 (63.3%)
- Carpooled: 3,272 (7.0%)
- Bus: 809 (1.7%)
- Subway or elevated rail: 707 (1.5%)
- Long-distance train or commuter rail: 130 (0.3%)
- Light rail, streetcar or trolley: 70 (0.1%)
- Taxi: 548 (1.2%)
- Bicycle: 268 (0.6%)
- Walked: 479 (1.0%)
- Worked at home: 10,181 (21.8%)
- Unemployment by race in 2022
- Unemployment rate for White non-Hispanic residents
- 2.4%Males
- 1.2%Females
- Unemployment rate for Black residents
- 2.9%Males
- 4.7%Females
- Unemployment rate for Asian residents
- 6.9%Males
- 2.1%Females
- Unemployment rate for other race residents
- 3.6%Males
- 12.6%Females
- Unemployment rate for two or more race residents
- 0.4%Males
- 3.1%Females
- Unemployment rate for Hispanic or Latino residents
- 1.6%Males
- 5.0%Females
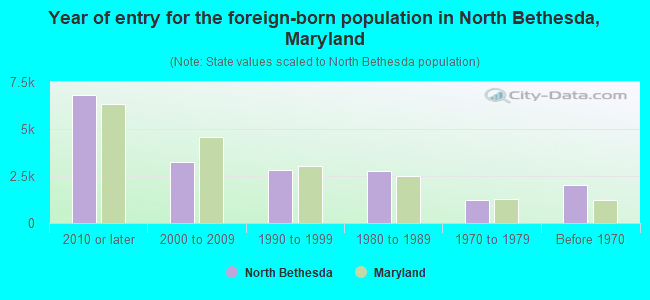
- Year of entry for the foreign-born population in North Bethesda, Maryland
- 6,8062010 or later
- 3,2422000 to 2009
- 2,8251990 to 1999
- 2,7681980 to 1989
- 1,2261970 to 1979
- 2,020Before 1970
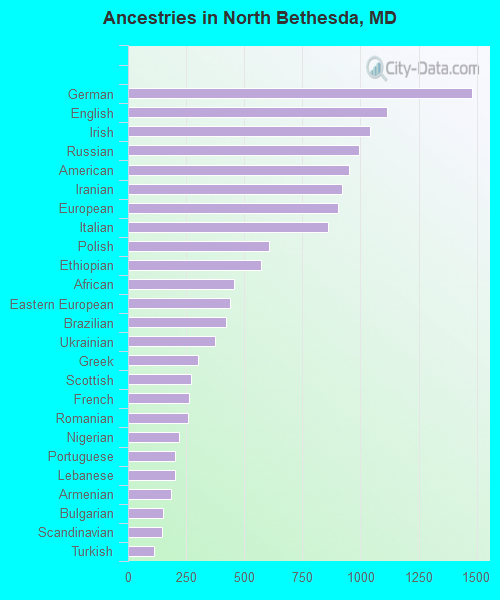
First ancestries reported:
- German: 1,479 (4.9%)
- English: 1,113 (3.7%)
- Irish: 1,041 (3.5%)
- Russian: 993 (3.3%)
- American: 952 (3.2%)
- Iranian: 922 (3.1%)
- European: 904 (3.0%)
- Italian: 859 (2.9%)
- Polish: 605 (2.0%)
- Ethiopian: 573 (1.9%)
- African: 458 (1.5%)
- Eastern European: 437 (1.5%)
- Brazilian: 421 (1.4%)
- Ukrainian: 374 (1.2%)
- Greek: 299 (1.0%)
- Scottish: 270 (0.9%)
- French: 263 (0.9%)
- Romanian: 257 (0.9%)
- Nigerian: 218 (0.7%)
- Portuguese: 204 (0.7%)
- Lebanese: 201 (0.7%)
- Armenian: 186 (0.6%)
- Bulgarian: 151 (0.5%)
- Scandinavian: 148 (0.5%)
- Turkish: 110 (0.4%)
- Slovak: 92 (0.3%)
- Jamaican: 92 (0.3%)
- Egyptian: 90 (0.3%)
- British: 90 (0.3%)
- Iraqi: 82 (0.3%)
- Scotch-Irish: 79 (0.3%)
- Dutch: 72 (0.2%)
- Austrian: 70 (0.2%)
- Sudanese: 70 (0.2%)
- Lithuanian: 68 (0.2%)
- Finnish: 65 (0.2%)
- Israeli: 57 (0.2%)
- Hungarian: 57 (0.2%)
- Welsh: 53 (0.2%)
- Trinidadian and Tobagonian: 52 (0.2%)
- Serbian: 47 (0.2%)
- Swedish: 47 (0.2%)
- Croatian: 45 (0.2%)
- Arab: 44 (0.1%)
- Northern European: 37 (0.1%)
- Ghanaian: 37 (0.1%)
- Jordanian: 28 (0.09%)
- Zimbabwean: 28 (0.09%)
- Haitian: 28 (0.09%)
- Czech: 24 (0.08%)
- Norwegian: 24 (0.08%)
- Moroccan: 21 (0.07%)
- Slavic: 21 (0.07%)
- French Canadian: 20 (0.07%)
- Latvian: 19 (0.06%)
- Kenyan: 16 (0.05%)
- Albanian: 16 (0.05%)
- Bahamian: 16 (0.05%)
- Belgian: 15 (0.05%)
- West Indian: 13 (0.04%)
- Czechoslovakian: 10 (0.03%)
- U.S. Virgin Islander: 9 (0.03%)
- Syrian: 8 (0.03%)
- Danish: 8 (0.03%)
- Palestinian: 7 (0.02%)
- Guyanese: 7 (0.02%)
- Swiss: 6 (0.02%)
- Senegalese: 6 (0.02%)
- Canadian: 2 (0.01%)
Most common places of birth for foreign-born residents (%):
| North Bethesda: | 5.8% (951) |
| Maryland: | 12.0% (115,412) |
| North Bethesda: | 5.2% (844) |
| Maryland: | 4.6% (44,742) |
| North Bethesda: | 5.1% (837) |
| Maryland: | 1.3% (12,074) |
| North Bethesda: | 5.0% (809) |
| Maryland: | 6.4% (61,725) |
| North Bethesda: | 4.7% (771) |
| Maryland: | 3.8% (36,698) |
| North Bethesda: | 4.5% (741) |
| Maryland: | 3.4% (32,635) |
| North Bethesda: | 4.5% (736) |
| Maryland: | 0.5% (4,995) |
| North Bethesda: | 3.9% (638) |
| Maryland: | 1.0% (9,481) |
| North Bethesda: | 3.8% (618) |
| Maryland: | 2.5% (24,026) |
| North Bethesda: | 3.1% (503) |
| Maryland: | 1.2% (11,980) |
| North Bethesda: | 3.1% (503) |
| Maryland: | 0.7% (7,000) |
| North Bethesda: | 2.7% (443) |
| Maryland: | 0.1% (767) |
| North Bethesda: | 2.4% (393) |
| Maryland: | 3.2% (30,870) |
| North Bethesda: | 2.4% (392) |
| Maryland: | 0.9% (8,520) |
| North Bethesda: | 2.1% (339) |
| Maryland: | 1.8% (17,161) |
| North Bethesda: | 2.0% (333) |
| Maryland: | 0.7% (6,326) |
| North Bethesda: | 1.8% (289) |
| Maryland: | 1.2% (11,265) |
| North Bethesda: | 1.8% (286) |
| Maryland: | 0.4% (4,217) |
| North Bethesda: | 1.7% (284) |
| Maryland: | 0.3% (3,199) |
| North Bethesda: | 1.7% (280) |
| Maryland: | 0.7% (7,124) |
| North Bethesda: | 1.6% (262) |
| Maryland: | 1.9% (18,716) |
Place of birth for U.S.-born residents:
- This state: 10,167
- Other state: 21,930
- Northeast: 6,742
- Midwest: 2,611
- South: 10,081
- West: 2,491
83.5% of North Bethesda residents lived in the same house 1 years ago.
Out of people who lived in different houses, 33.4% lived in this county.
Out of people who lived in different counties, 28.2% lived in Maryland.
| North Bethesda: | 83.5% |
| State average: | 88.5% |
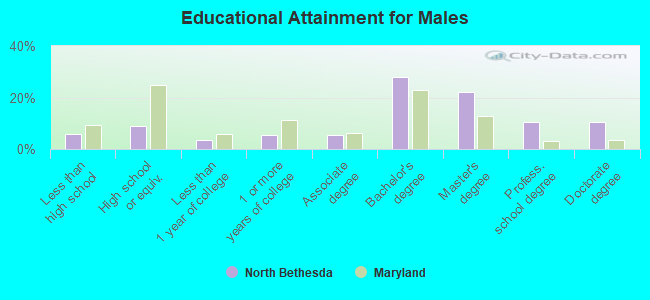
Education attainment for males 25 years and older:
- No schooling: 525
- Nursery to 4th grade: 60
- 5th and 6th grade: 59
- 7th and 8th grade: 59
- 9th grade: 117
- 10th grade: 24
- 11th grade: 95
- 12th grade, no diploma: 92
- High school graduate (or equivalency): 1,581
- Less than 1 year of college: 582
- Some college more than 1 year, no degree: 960
- Associate degree: 923
- Bachelor's degree: 4,857
- Master's degree: 3,877
- Professional school degree: 1,856
- Doctorate degree: 1,824
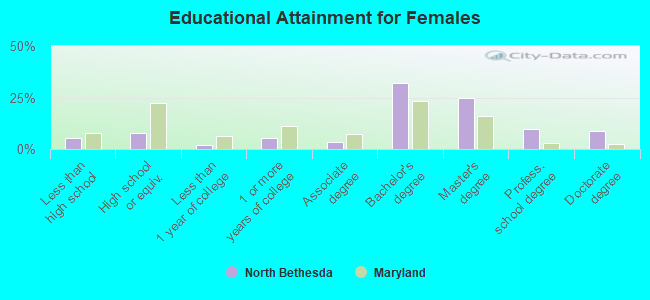
Education attainment for females 25 years and older:
- No schooling: 333
- Nursery to 4th grade: 22
- 5th and 6th grade: 98
- 7th and 8th grade: 38
- 9th grade: 44
- 10th grade: 20
- 11th grade: 171
- 12th grade, no diploma: 335
- High school graduate (or equivalency): 1,548
- Less than 1 year of college: 410
- Some college more than 1 year, no degree: 1,007
- Associate degree: 698
- Bachelor's degree: 6,217
- Master's degree: 4,836
- Professional school degree: 1,895
- Doctorate degree: 1,737
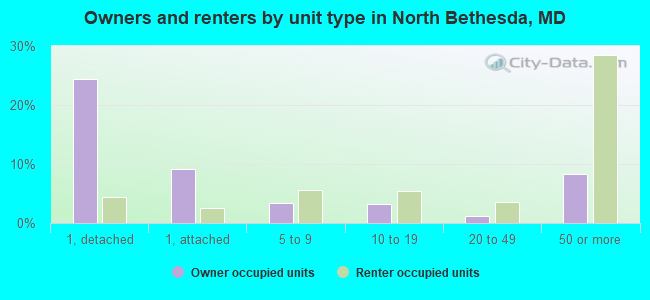
Housing units in structures:
- One, detached: 6,776
- One, attached: 2,618
- Two: 97
- 3 or 4: 271
- 5 to 9: 1,870
- 10 to 19: 2,034
- 20 to 49: 1,172
- 50 or more: 8,358
- Mobile homes: 9
Housing units lacking complete kitchen facilities in 2022: 0.4%
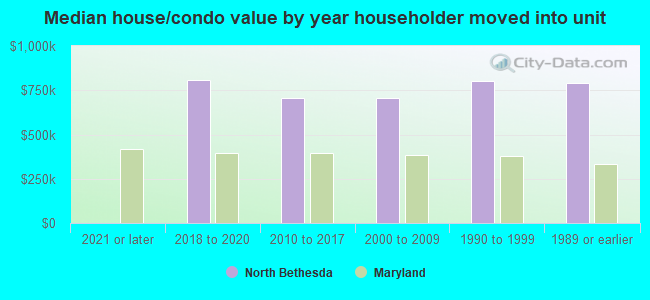
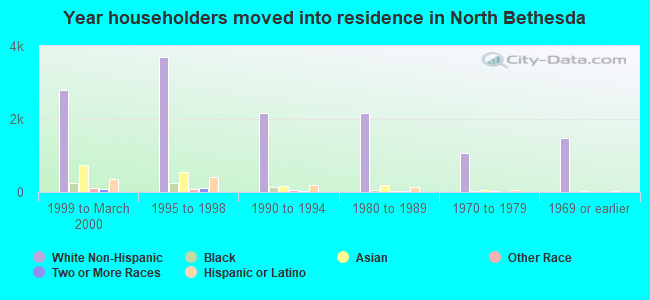
House/condo owner moved in on average 10 years ago
Renter moved in on average 3 years ago
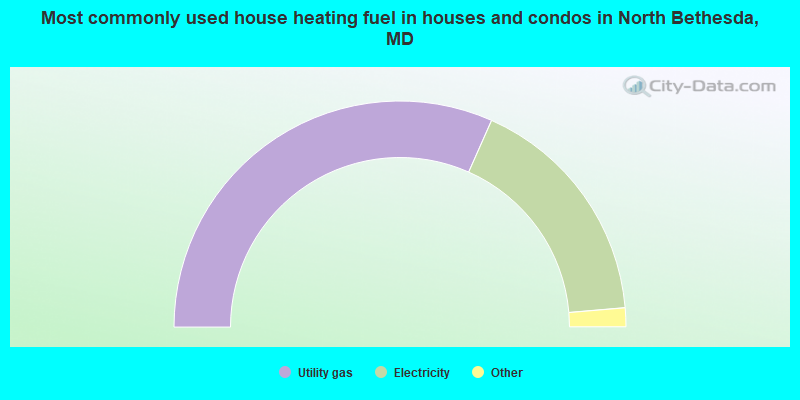
- 63.3%Utility gas
- 34.0%Electricity
- 1.2%Fuel oil, kerosene, etc.
- 0.7%Bottled, tank, or LP gas
- 0.4%Other fuel
- 0.3%No fuel used
- 0.1%Wood
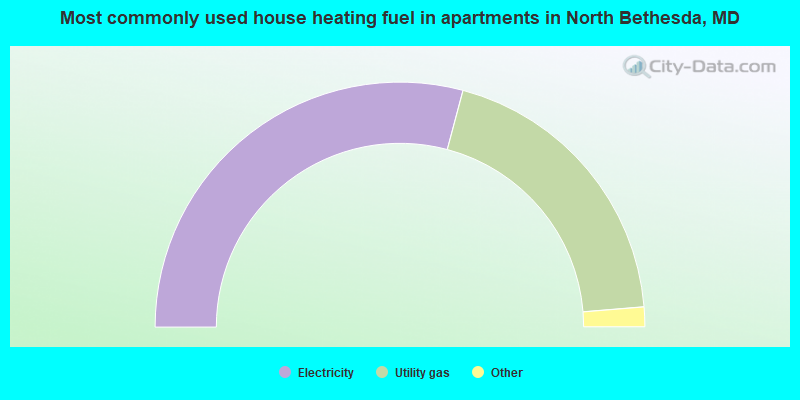
- 58.3%Electricity
- 39.1%Utility gas
- 1.1%Bottled, tank, or LP gas
- 0.7%Fuel oil, kerosene, etc.
- 0.6%No fuel used
- 0.1%Other fuel
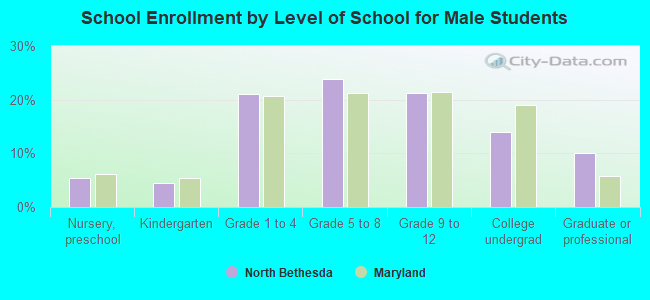
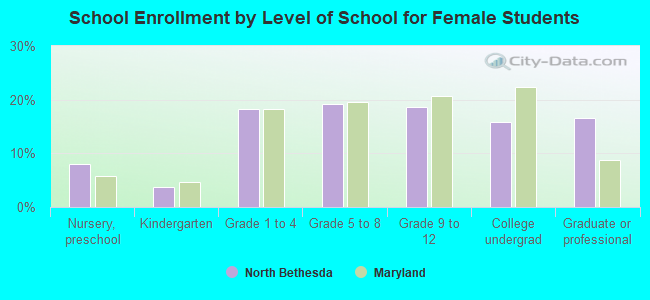
Private vs. public school enrollment:
| Here: | 13.6% |
| Maryland: | 15.2% |
| Here: | 17.2% |
| Maryland: | 14.4% |
| Here: | 34.4% |
| Maryland: | 20.2% |