North Miami, FL (Florida) Houses and Residents
Estimated median house or condo value in 2022: $355,846 (it was $85,800 in 2000 )
North Miami:
$355,846Florida:
$354,100
Lower value quartile - upper value quartile: $241,802 - $480,638Mean price in 2022: Detached houses: $373,729 Here:
$373,729State:
$500,941
Townhouses or other attached units: $192,213 Here:
$192,213State:
$370,869
In 2-unit structures: $274,071 Here:
$274,071State:
$423,188
In 3-to-4-unit structures: $210,585 Here:
$210,585State:
$309,944
In 5-or-more-unit structures: $195,617 Here:
$195,617State:
$447,145
Total population: 61,420 (Urban population: 60,036, Rural population: 0)
Houses: 22,312 (20,594 occupied: 9,067 owner occupied, 11,800 renter occupied )
% of renters here:
57%State:
33%
Housing density: 2,638 houses/condos per square mile
Median price asked for vacant for-sale houses and condos in 2022: $809,457.
Median contract rent in 2022: $1,380 (lower quartile is $1,114, upper quartile is $1,715)
Median rent asked for vacant for-rent units in 2022: $1,598
Median gross rent in North Miami, FL in 2022: $1,481
Housing units in North Miami with a mortgage: 5,503 (354 second mortgage, 0 home equity loan, 283 both second mortgage and home equity loan )Houses without a mortgage: 54
Median household income for houses/condos with a mortgage: $74,283
Median household income for apartments without a mortgage: $52,709
Median monthly housing costs: $1,454
Data:
Median house or condo value ($)
Median house or condo value ($ change since 2000)
Median house or condo value ($) - White
Median house or condo value ($) - Black or African American
Median house or condo value ($) - Asian
Median house or condo value ($) - Hispanic or Latino
Median house or condo value ($) - American Indian and Alaska Native
Median house or condo value ($) - Multirace
Median house or condo value ($) - Other Race
Median price asked for mobile homes ($)
Household density (households per square mile)
Mean house or condo value by units in structure - 1, detached ($)
Mean house or condo value by units in structure - 1, attached ($)
Mean house or condo value by units in structure - 2 ($)
Mean house or condo value by units in structure by units in structure - 3 or 4 ($)
Mean house or condo value by units in structure - 5 or more ($)
Mean house or condo value by units in structure - Boat, RV, van, etc. ($)
Mean house or condo value by units in structure - Mobile home ($)
Median contract rent ($)
Median contract rent - Lower quartile ($)
Median contract rent - Upper quartile ($)
Median gross rent ($)
Urban houses (%)
Rural houses (%)
Houses occupied (%)
Houses occupied (% change since 2000)
Houses owner occupied (%)
Houses owner occupied (% change since 2000)
Houses renter occupied (%)
Houses renter occupied (% change since 2000)
Vacant housing units - For rent (%)
Vacant housing units - For rent (% change since 2000)
Vacant housing units - For sale only (%)
Vacant housing units - For sale only (% change since 2000)
Vacant housing units - Rented or sold, not occupied (%)
Vacant housing units - Rented or sold, not occupied (% change since 2000)
Vacant housing units - For seasonal, recreational, or occasional use (%)
Vacant housing units - For seasonal, recreational, or occasional use (% change since 2000)
Vacant housing units - For migrant workers (%)
Vacant housing units - For migrant workers (% change since 2000)
Vacant housing units - Other vacant (%)
Vacant housing units - Other vacant (% change since 2000)
Median monthly housing costs ($)
Median household income for houses/condos with a mortgage ($)
Median household income for houses/condos without a mortgage ($)
Median household income ($)
Median household income ($) - White
Median household income ($) - Black or African American
Median household income ($) - Asian
Median household income ($) - Hispanic or Latino
Median household income ($) - American Indian and Alaska Native
Median household income ($) - Multirace
Median household income ($) - Other Race
Mortgage status - with mortgage (%)
Mortgage status - with second mortgage (%)
Mortgage status - with home equity loan (%)
Mortgage status - with both second mortgage and home equity loan (%)
Mortgage status - without a mortgage (%)
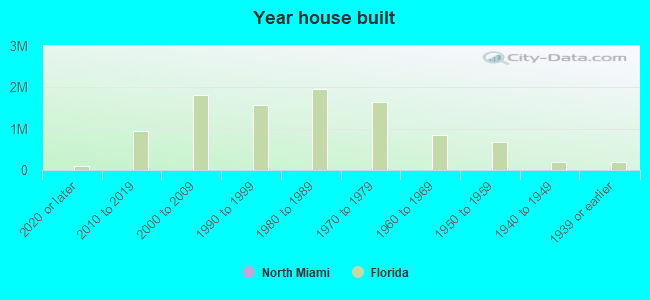
Median year house/condo built
Median year apartment built
Household type by relationship - Male householder living alone (%)
Household type by relationship - Male householder not living alone (%)
Household type by relationship - Female householder living alone (%)
Household type by relationship - Female householder not living alone (%)
Household type by relationship - Opposite-Sex spouse (%)
Household type by relationship - Same-Sex spouse (%)
Household type by relationship - Opposite-Sex unmarried partner (%)
Household type by relationship - Same-Sex unmarried partner (%)
Household type by relationship - In group quarters (%)
Size of family households - 2-person household (%)
Size of family households - 3-person household (%)
Size of family households - 4-person household (%)
Size of family households - 5-person household (%)
Size of family households - 6-person household (%)
Size of family households - 7-or-more-person household (%)
Size of nonfamily households - 1-person household (%)
Size of nonfamily households - 2-person household (%)
Size of nonfamily households - 3-person household (%)
Size of nonfamily households - 4-person household (%)
Size of nonfamily households - 5-person household (%)
Size of nonfamily households - 6-person household (%)
Size of nonfamily households - 7-or-moreperson household (%)
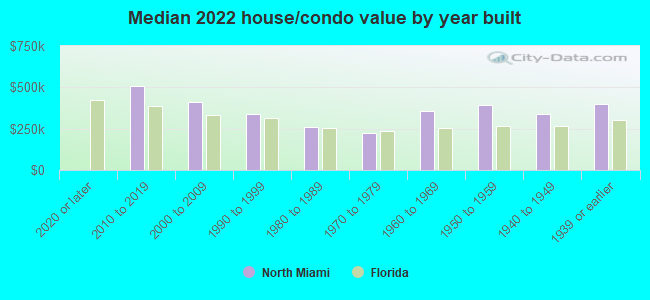
Year house built - Built 2010 or later (%)
Year house built - Built 2000 to 2009 (%)
Year house built - Built 1990 to 1999 (%)
Year house built - Built 1980 to 1989 (%)
Year house built - Built 1970 to 1979 (%)
Year house built - Built 1960 to 1969 (%)
Year house built - Built 1950 to 1959 (%)
Year house built - Built 1940 to 1949 (%)
Year house built - Built 1939 or earlier (%)
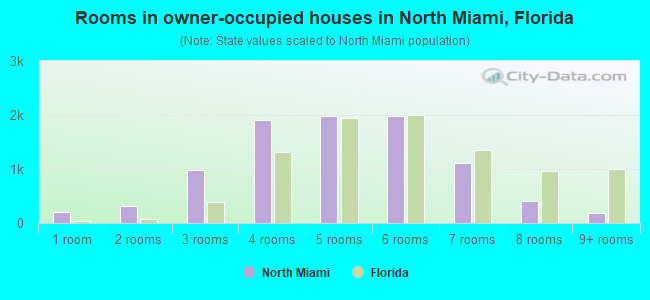
Median number of rooms in houses and condos
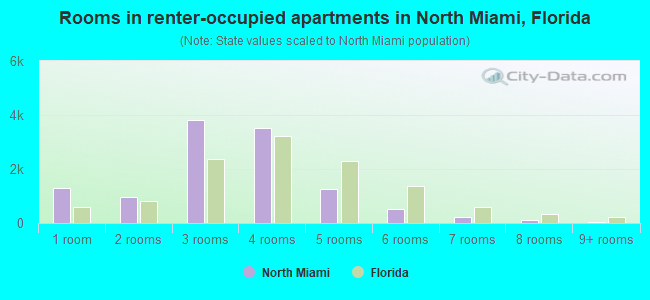
Median number of rooms in apartments
Median number of bedrooms in owner occupied houses
Mean number of bedrooms in owner occupied houses
Median number of bedrooms in renter occupied houses
Mean number of bedrooms in renter occupied houses
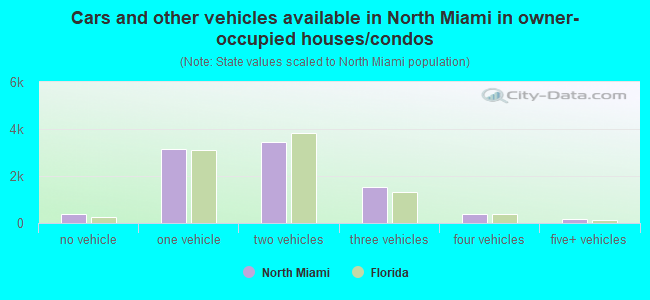
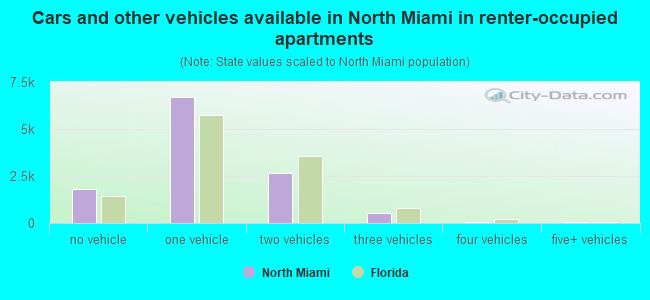
Median number of vehichles in owner occupied houses
Mean number of vehichles in owner occupied houses
Median number of vehichles in renter occupied houses
Mean number of vehichles in renter occupied houses
Rooms in owner-occupied houses - 1 room (%)
Rooms in owner-occupied houses - 2 rooms (%)
Rooms in owner-occupied houses - 3 rooms (%)
Rooms in owner-occupied houses - 4 rooms (%)
Rooms in owner-occupied houses - 5 rooms (%)
Rooms in owner-occupied houses - 6 rooms (%)
Rooms in owner-occupied houses - 7 rooms (%)
Rooms in owner-occupied houses - 8 rooms (%)
Rooms in owner-occupied houses - 9+ rooms (%)
Rooms in renter-occupied houses - 1 room (%)
Rooms in renter-occupied houses - 2 rooms (%)
Rooms in renter-occupied houses - 3 rooms (%)
Rooms in renter-occupied houses - 4 rooms (%)
Rooms in renter-occupied houses - 5 rooms (%)
Rooms in renter-occupied houses - 6 rooms (%)
Rooms in renter-occupied houses - 7 rooms (%)
Rooms in renter-occupied houses - 8 rooms (%)
Rooms in renter-occupied houses - 9+ rooms (%)
Bedrooms in owner-occupied houses - no bedrooms (%)
Bedrooms in owner-occupied houses - 1 bedroom (%)
Bedrooms in owner-occupied houses - 2 bedrooms (%)
Bedrooms in owner-occupied houses - 3 bedrooms (%)
Bedrooms in owner-occupied houses - 4 bedrooms (%)
Bedrooms in owner-occupied houses - 5+ bedrooms (%)
Bedrooms in renter-occupied houses - no bedrooms (%)
Bedrooms in renter-occupied houses - 1 bedroom (%)
Bedrooms in renter-occupied houses - 2 bedrooms (%)
Bedrooms in renter-occupied houses - 3 bedrooms (%)
Bedrooms in renter-occupied houses - 4 bedrooms (%)
Bedrooms in renter-occupied houses - 5+ bedrooms (%)
Vehicles available in owner-occupied houses - no vehicle available (%)
Vehicles available in owner-occupied houses - 1 vehicle available(%)
Vehicles available in owner-occupied houses - 2 Vehicles available (%)
Vehicles available in owner-occupied houses - 3 Vehicles available (%)
Vehicles available in owner-occupied houses - 4 Vehicles available (%)
Vehicles available in owner-occupied houses - 5+ Vehicles available (%)
Vehicles available in renter-occupied houses - no vehicle available (%)
Vehicles available in renter-occupied houses - 1 vehicle available (%)
Vehicles available in renter-occupied houses - 2 Vehicles available (%)
Vehicles available in renter-occupied houses - 3 Vehicles available (%)
Vehicles available in renter-occupied houses - 4 Vehicles available (%)
Vehicles available in renter-occupied houses - 5+ Vehicles available (%)
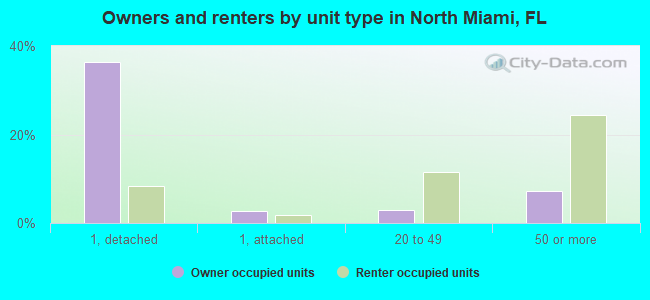
Housing units in structures - 1, detached (%)
Housing units in structures - 1, attached (%)
Housing units in structures - 2 (%)
Housing units in structures - 3 or 4 (%)
Housing units in structures - 5 to 9 (%)
Housing units in structures - 10 to 19 (%)
Housing units in structures - 20 to 49 (%)
Housing units in structures - 50 or more (%)
Housing units in structures - Mobile home (%)
Housing units in structures - Boat, RV, van, etc. (%)
Housing units in structures - Owners - 1, detached (%)
Housing units in structures - Owners - 1, attached (%)
Housing units in structures - Owners - 2 (%)
Housing units in structures - Owners - 3 or 4 (%)
Housing units in structures - Owners - 5 to 9 (%)
Housing units in structures - Owners - 10 to 19 (%)
Housing units in structures - Owners - 20 to 49 (%)
Housing units in structures - Owners - 50 or more (%)
Housing units in structures - Owners - Mobile home (%)
Housing units in structures - Owners - Boat, RV, van, etc. (%)
Housing units in structures - Renters - 1, detached (%)
Housing units in structures - Renters - 1, attached (%)
Housing units in structures - Renters - 2 (%)
Housing units in structures - Renters - 3 or 4 (%)
Housing units in structures - Renters - 5 to 9 (%)
Housing units in structures - Renters - 10 to 19 (%)
Housing units in structures - Renters - 20 to 49 (%)
Housing units in structures - Renters - 50 or more (%)
Housing units in structures - Renters - Mobile home (%)
Housing units in structures - Renters - Boat, RV, van, etc. (%)
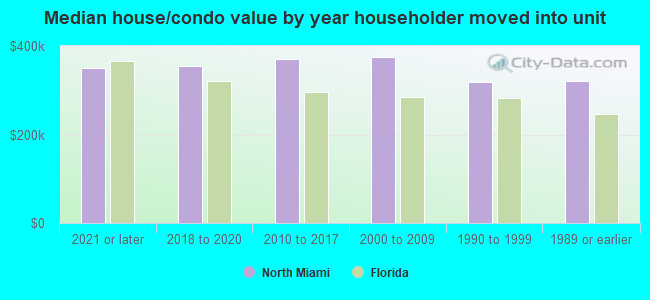
House/condo owner moved in on average (years ago)
Renter moved in on average (years ago)
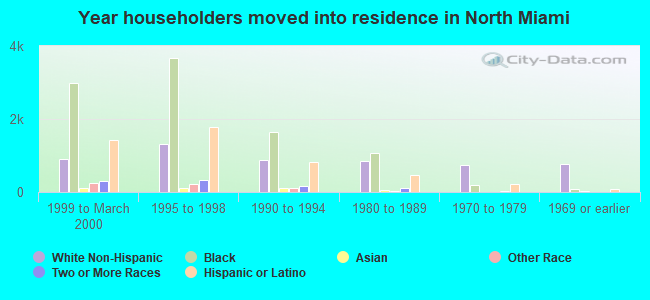
Year householder moved into unit - Moved in 1999 to March 2000 (%)
Year householder moved into unit - Moved in 1999 to March 2000 (%) - White
Year householder moved into unit - Moved in 1999 to March 2000 (%) - Black or African American
Year householder moved into unit - Moved in 1999 to March 2000 (%) - Asian
Year householder moved into unit - Moved in 1999 to March 2000 (%) - Hispanic or Latino
Year householder moved into unit - Moved in 1999 to March 2000 (%) - American Indian and Alaska Native
Year householder moved into unit - Moved in 1999 to March 2000 (%) - Multirace
Year householder moved into unit - Moved in 1999 to March 2000 (%) - Other Race
Year householder moved into unit - Moved in 1995 to 1998 (%)
Year householder moved into unit - Moved in 1995 to 1998 (%) - White
Year householder moved into unit - Moved in 1995 to 1998 (%) - Black or African American
Year householder moved into unit - Moved in 1995 to 1998 (%) - Asian
Year householder moved into unit - Moved in 1995 to 1998 (%) - Hispanic or Latino
Year householder moved into unit - Moved in 1995 to 1998 (%) - American Indian and Alaska Native
Year householder moved into unit - Moved in 1995 to 1998 (%) - Multirace
Year householder moved into unit - Moved in 1995 to 1998 (%) - Other Race
Year householder moved into unit - Moved in 1990 to 1994 (%)
Year householder moved into unit - Moved in 1990 to 1994 (%) - White
Year householder moved into unit - Moved in 1990 to 1994 (%) - Black or African American
Year householder moved into unit - Moved in 1990 to 1994 (%) - Asian
Year householder moved into unit - Moved in 1990 to 1994 (%) - Hispanic or Latino
Year householder moved into unit - Moved in 1990 to 1994 (%) - American Indian and Alaska Native
Year householder moved into unit - Moved in 1990 to 1994 (%) - Multirace
Year householder moved into unit - Moved in 1990 to 1994 (%) - Other Race
Year householder moved into unit - Moved in 1980 to 1989 (%)
Year householder moved into unit - Moved in 1980 to 1989 (%) - White
Year householder moved into unit - Moved in 1980 to 1989 (%) - Black or African American
Year householder moved into unit - Moved in 1980 to 1989 (%) - Asian
Year householder moved into unit - Moved in 1980 to 1989 (%) - Hispanic or Latino
Year householder moved into unit - Moved in 1980 to 1989 (%) - American Indian and Alaska Native
Year householder moved into unit - Moved in 1980 to 1989 (%) - Multirace
Year householder moved into unit - Moved in 1980 to 1989 (%) - Other Race
Year householder moved into unit - Moved in 1970 to 1979 (%)
Year householder moved into unit - Moved in 1970 to 1979 (%) - White
Year householder moved into unit - Moved in 1970 to 1979 (%) - Black or African American
Year householder moved into unit - Moved in 1970 to 1979 (%) - Asian
Year householder moved into unit - Moved in 1970 to 1979 (%) - Hispanic or Latino
Year householder moved into unit - Moved in 1970 to 1979 (%) - American Indian and Alaska Native
Year householder moved into unit - Moved in 1970 to 1979 (%) - Multirace
Year householder moved into unit - Moved in 1970 to 1979 (%) - Other Race
Year householder moved into unit - Moved in 1969 or earlier (%)
Year householder moved into unit - Moved in 1969 or earlier (%) - White
Year householder moved into unit - Moved in 1969 or earlier (%) - Black or African American
Year householder moved into unit - Moved in 1969 or earlier (%) - Asian
Year householder moved into unit - Moved in 1969 or earlier (%) - Hispanic or Latino
Year householder moved into unit - Moved in 1969 or earlier (%) - American Indian and Alaska Native
Year householder moved into unit - Moved in 1969 or earlier (%) - Multirace
Year householder moved into unit - Moved in 1969 or earlier (%) - Other Race
Housing units lacking complete plumbing facilities (%)
Housing units lacking complete kitchen facilities (%)
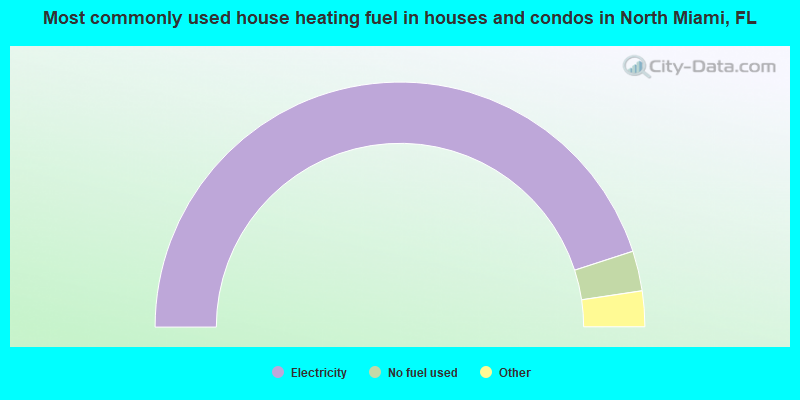
House heating fuel used in houses and condos - Utility gas (%)
House heating fuel used in houses and condos - Bottled, tank, or LP gas (%)
House heating fuel used in houses and condos - Electricity (%)
House heating fuel used in houses and condos - Fuel oil, kerosene, etc. (%)
House heating fuel used in houses and condos - Coal or coke (%)
House heating fuel used in houses and condos - Wood (%)
House heating fuel used in houses and condos - Solar energy (%)
House heating fuel used in houses and condos - Other fuel (%)
House heating fuel used in houses and condos - No fuel used (%)
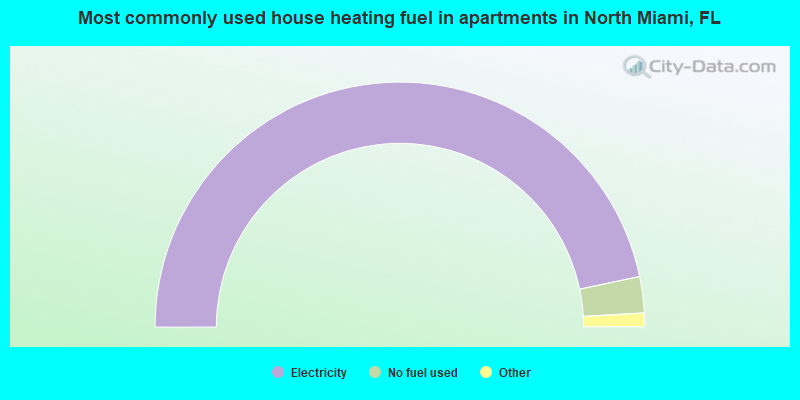
House heating fuel used in apartments - Utility gas (%)
House heating fuel used in apartments - Bottled, tank, or LP gas (%)
House heating fuel used in apartments - Electricity (%)
House heating fuel used in apartments - Fuel oil, kerosene, etc. (%)
House heating fuel used in apartments - Coal or coke (%)
House heating fuel used in apartments - Wood (%)
House heating fuel used in apartments - Solar energy (%)
House heating fuel used in apartments - Other fuel (%)
House heating fuel used in apartments - No fuel used (%)
Median year house/condo built: 1958Median year apartment built: 1972Household type by relationship:
Households: 59,533
Male householders: 9,970 (2,641 living alone ), Female householders: 10,135 (3,092 living alone )7,487 spouses (7,460 opposite-sex spouses ), 1,537 unmarried partners , (1,431 opposite-sex unmarried partners ), 19,439 children (18,461 natural , 320 adopted , 657 stepchildren ), 1,676 grandchildren , 1,534 brothers or sisters , 2,066 parents , 0 foster children , 1,745 other relatives , 2,136 non-relatives In group quarters: 1,802
Size of family households: 4,517 2-persons , 3,730 3-persons , 2,268 4-persons , 1,451 5-persons , 1,167 6-persons , 308 7-or-more-persons .
Size of nonfamily households: 6,145 1-person , 1,165 2-persons , 101 3-persons , 62 4-persons , 28 5-persons .
6,343 married couples with children. single-parent households (1,620 men , 3,118 women ).
23.7% of residents of North Miami speak English at home. of residents speak Spanish at home (55% speak English very well , 20% speak English well , 17% speak English not well , 8% don't speak English at all ).of residents speak other Indo-European language at home (64% speak English very well , 21% speak English well , 12% speak English not well , 3% don't speak English at all ).of residents speak Asian or Pacific Island language at home (83% speak English very well , 17% speak English well ).of residents speak other language at home (56% speak English very well , 37% speak English well , 7% speak English not well ).
Foreign born population: 32,800 (55.1%)of them are naturalized citizens )
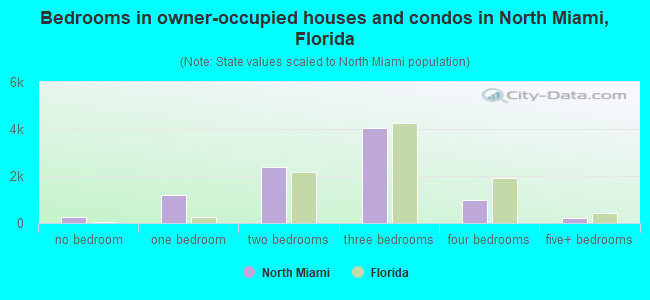
Median number of rooms in houses and condos:
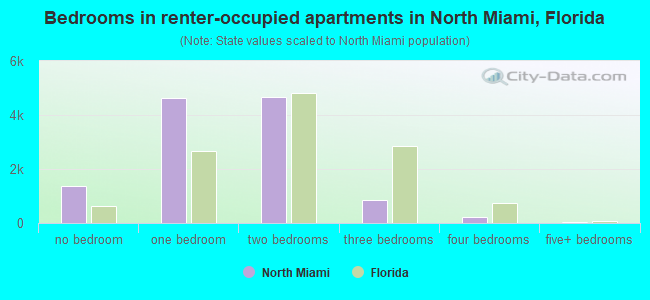
Median number of rooms in apartments
Owner-occupied Renter-occupied
Rooms in owner-occupied houses in North Miami, Florida
212 1 room 317 2 rooms 987 3 rooms 1,907 4 rooms 1,985 5 rooms 1,974 6 rooms 1,102 7 rooms 405 8 rooms 180 9+ rooms
Rooms in renter-occupied apartments in North Miami, Florida
1,309 1 room 979 2 rooms 3,820 3 rooms 3,517 4 rooms 1,255 5 rooms 536 6 rooms 215 7 rooms 125 8 rooms 45 9+ rooms
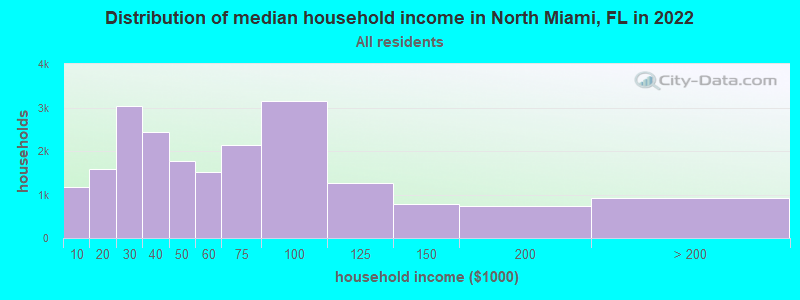
North Miami, FL household income distribution 1,177 Less than $10,0001,590 $10,000 to $19,9993,044 $20,000 to $29,9992,429 $30,000 to $39,9991,777 $40,000 to $49,9991,523 $50,000 to $59,9992,129 $60,000 to $74,9993,146 $75,000 to $99,9991,257 $100,000 to $124,999784 $125,000 to $149,999741 $150,000 to $199,999910 $200,000 or more
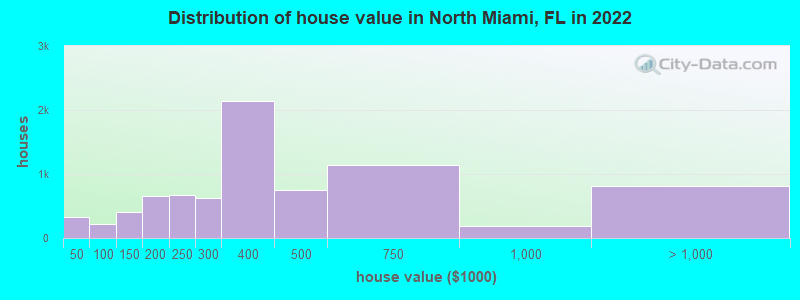
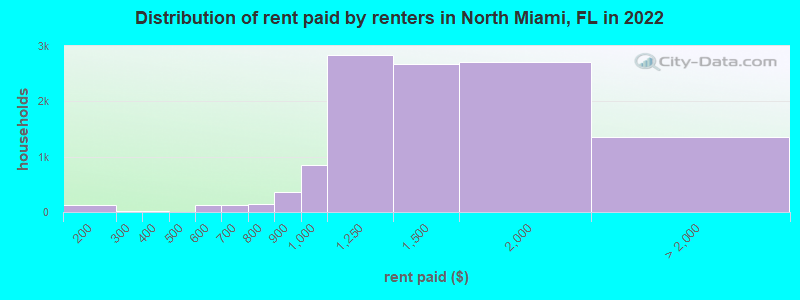
Home value of owner - occupied houses in 2022 in North Miami, FL 187 Less than $10,00034 $10,000 to $14,99921 $20,000 to $24,99916 $25,000 to $29,99921 $30,000 to $34,99952 $40,000 to $49,9997 $50,000 to $59,99929 $60,000 to $69,99918 $70,000 to $79,99947 $80,000 to $89,99969 $90,000 to $99,999189 $100,000 to $124,999221 $125,000 to $149,999338 $150,000 to $174,999324 $175,000 to $199,999672 $200,000 to $249,999632 $250,000 to $299,9992,134 $300,000 to $399,999747 $400,000 to $499,9991,142 $500,000 to $749,999190 $750,000 to $999,999310 $1,000,000 to $1,499,999187 $1,500,000 to $1,999,999314 $2,000,000 or moreRent paid by renters in 2022 in North Miami, FL 24 $100 to $149110 $150 to $19915 $200 to $2499 $250 to $29914 $300 to $3494 $450 to $499100 $500 to $54934 $550 to $59992 $600 to $64933 $650 to $69972 $700 to $74972 $750 to $799364 $800 to $899857 $900 to $9992,845 $1,000 to $1,2492,676 $1,250 to $1,4992,715 $1,500 to $1,999814 $2,000 to $2,499158 $2,500 to $2,99976 $3,000 to $3,49989 $3,500 or more217 No cash rent
Percentage of workers working in this county: 87.6%Number of people working at home: 2,497 (8.7% of all workers )
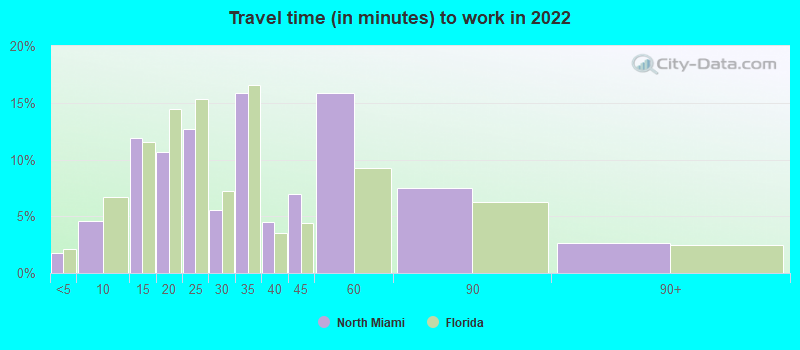
Travel time to work (commute)
Less than 5 minutes: 2945 to 9 minutes: 86610 to 14 minutes: 1,79715 to 19 minutes: 2,29420 to 24 minutes: 3,25625 to 29 minutes: 2,39430 to 34 minutes: 5,83335 to 39 minutes: 1,59040 to 44 minutes: 1,40245 to 59 minutes: 3,02760 to 89 minutes: 2,07090 or more minutes: 311
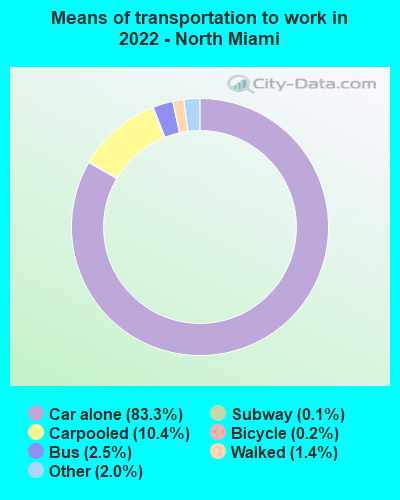
Means of transportation to work:
Drove a car alone: 11,525 (69.2%)Carpooled: 1,626 (9.8%)Bus : 329 (2.0%)Long-distance train or commuter rail : 15 (0.1%)Light rail, streetcar or trolley : 9 (0.1%)Taxi: 351 (2.1%)Bicycle: 35 (0.2%)Walked: 218 (1.3%)Worked at home: 2,497 (15.0%)
Unemployment by race in 2022
Unemployment rate for White non-Hispanic residents 2.0% Males4.5% FemalesUnemployment rate for Black residents 5.3% Males5.0% FemalesUnemployment rate for Asian residents 5.1% FemalesUnemployment rate for other race residents 7.8% Males8.0% FemalesUnemployment rate for two or more race residents 3.9% Males6.3% FemalesUnemployment rate for Hispanic or Latino residents 4.1% Males3.3% Females
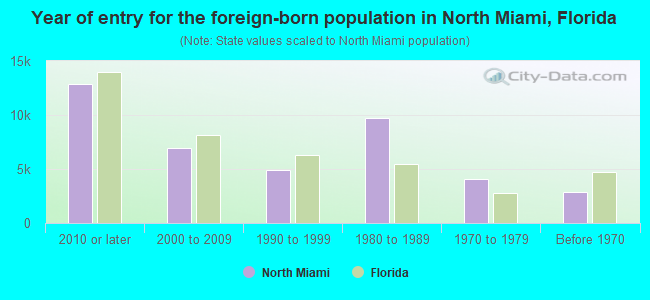
Year of entry for the foreign-born population in North Miami, Florida
12,908 2010 or later 6,929 2000 to 2009 4,922 1990 to 1999 9,750 1980 to 1989 4,078 1970 to 1979 2,830 Before 1970
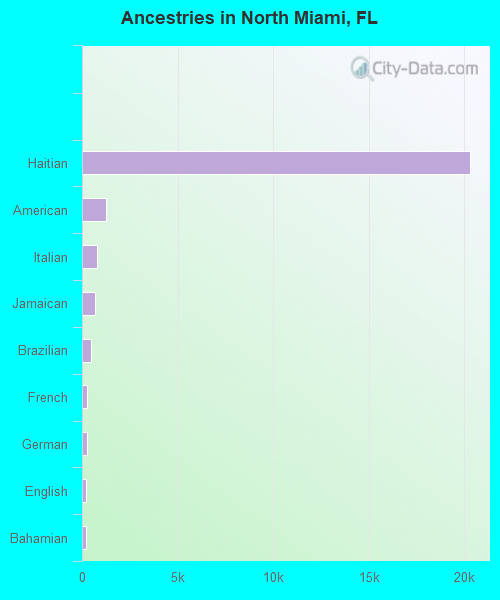
First ancestries reported:
Haitian: 20,286 (46.1%)
American: 1,232 (2.8%)
Italian: 797 (1.8%)
Jamaican: 674 (1.5%)
Brazilian: 460 (1.0%)
French: 247 (0.6%)
German: 246 (0.6%)
English: 229 (0.5%)
Bahamian: 185 (0.4%)
Russian: 171 (0.4%)
European: 169 (0.4%)
Nigerian: 145 (0.3%)
Polish: 142 (0.3%)
African: 98 (0.2%)
Guyanese: 92 (0.2%)
Irish: 84 (0.2%)
British: 71 (0.2%)
Egyptian: 50 (0.1%)
Turkish: 49 (0.1%)
Bulgarian: 47 (0.1%)
Norwegian: 46 (0.1%)
Eastern European: 41 (0.09%)
Israeli: 33 (0.08%)
Barbadian: 29 (0.07%)
Serbian: 26 (0.06%)
Portuguese: 26 (0.06%)
British West Indian: 25 (0.06%)
Hungarian: 22 (0.05%)
Dutch West Indian: 20 (0.05%)
Moroccan: 17 (0.04%)
Dutch: 16 (0.04%)
West Indian: 13 (0.03%)
French Canadian: 13 (0.03%)
Estonian: 12 (0.03%)
South African: 9 (0.02%)
Slovak: 9 (0.02%)
Lebanese: 8 (0.02%)
Greek: 7 (0.02%)
Ukrainian: 7 (0.02%)
Czech: 7 (0.02%)
Canadian: 7 (0.02%)
Arab: 7 (0.02%)
Afghan: 7 (0.02%)
Finnish: 3 (0.01%) Most common places of birth for foreign-born residents (%): Haiti North Miami:
49.4% (16,209)Florida:
7.5% (342,375)
Cuba North Miami:
8.9% (2,904)Florida:
22.0% (1,006,576)
Colombia North Miami:
7.5% (2,462)Florida:
6.5% (298,669)
Venezuela North Miami:
5.4% (1,784)Florida:
5.7% (262,042)
Nicaragua North Miami:
3.3% (1,069)Florida:
2.3% (105,066)
Dominican Republic North Miami:
2.8% (924)Florida:
3.0% (137,727)
Brazil North Miami:
2.8% (908)Florida:
2.7% (122,906)
Honduras North Miami:
2.5% (817)Florida:
2.3% (107,160)
Argentina North Miami:
2.3% (746)Florida:
1.3% (57,263)
Bahamas North Miami:
1.7% (569)Florida:
0.4% (17,749)
Place of birth for U.S.-born residents:
This state: 19,327Other state: 5,336Northeast: 2,589Midwest: 894South: 1,340West: 507 86.9% of North Miami residents lived in the same house 1 years ago.
Out of people who lived in different houses, 38.9% lived in this county.
Out of people who lived in different counties, 42.1% lived in Florida.
North Miami:
86.9%State average:
86.3%
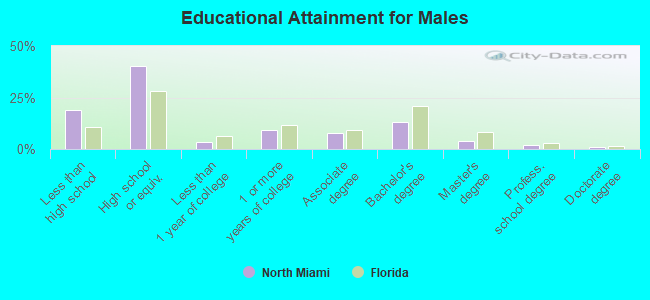
Education attainment for males 25 years and older:
No schooling: 1,434Nursery to 4th grade: 1705th and 6th grade: 1357th and 8th grade: 6459th grade: 13510th grade: 19011th grade: 44712th grade, no diploma: 512High school graduate (or equivalency): 7,931Less than 1 year of college: 707Some college more than 1 year, no degree: 1,845Associate degree: 1,515Bachelor's degree: 2,604Master's degree: 727Professional school degree: 404Doctorate degree: 204
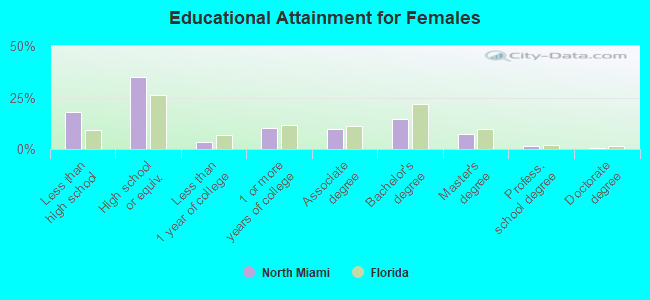
Education attainment for females 25 years and older:
No schooling: 1,401Nursery to 4th grade: 2665th and 6th grade: 2437th and 8th grade: 6179th grade: 27710th grade: 22611th grade: 28512th grade, no diploma: 407High school graduate (or equivalency): 7,133Less than 1 year of college: 702Some college more than 1 year, no degree: 2,047Associate degree: 1,978Bachelor's degree: 2,991Master's degree: 1,504Professional school degree: 280Doctorate degree: 134
Housing units in structures:
One, detached: 7,928One, attached: 801Two: 2093 or 4: 5575 to 9: 86910 to 19: 1,81720 to 49: 3,94250 or more: 5,981Mobile homes: 191Boats, RVs, vans, etc.: 12Median worth of mobile homes: $315,999
Housing units lacking complete plumbing facilities in 2022: 1.0%Housing units lacking complete kitchen facilities in 2022: 1.2%House/condo owner moved in on average 15 years ago
Renter moved in on average 3 years ago
Private vs. public school enrollment:
Students in private schools in grades 1 to 8 (elementary and middle school): 460 Students in private schools in grades 9 to 12 (high school): 282 Students in private undergraduate colleges: 1,524