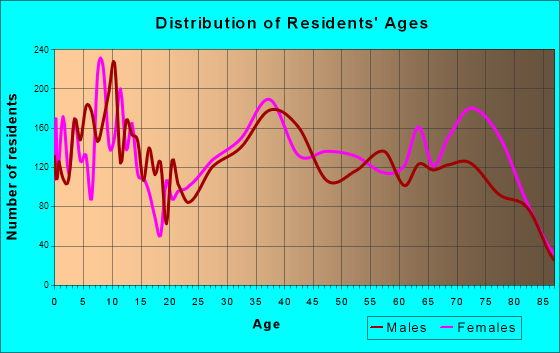
North Port, FL (Florida) Houses and Residents
Estimated median house or condo value in 2022: $364,400 (it was $81,700 in 2000 )
North Port:
$364,400Florida:
$354,100
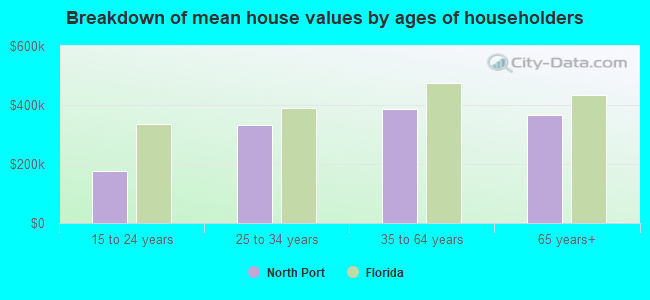
Lower value quartile - upper value quartile: $286,300 - $467,600Mean price in 2022: Detached houses: $386,213 Here:
$386,213State:
$500,941
Townhouses or other attached units: $374,474 Here:
$374,474State:
$370,869
In 3-to-4-unit structures: $214,768 Here:
$214,768State:
$309,944
In 5-or-more-unit structures: $606,601 Here:
$606,601State:
$447,145
Mobile homes: $103,670 Here:
$103,670State:
$113,202
Total population: 60,380 (Urban population: 19,133, Rural population: 3,584 (all nonfarm) )
Houses: 39,117 (34,297 occupied: 27,328 owner occupied, 6,969 renter occupied )
% of renters here:
20%State:
33%
Housing density: 523 houses/condos per square mile
Median price asked for vacant for-sale houses and condos in 2022: $113,641.
Median contract rent in 2022: $1,652 (lower quartile is $1,161, upper quartile is $1,967)
Median rent asked for vacant for-rent units in 2022: $1,389
Median gross rent in North Port, FL in 2022: $1,743
Housing units in North Port with a mortgage: 17,296 (1,055 second mortgage, 0 home equity loan, 835 both second mortgage and home equity loan )Houses without a mortgage: 652
Median household income for houses/condos with a mortgage: $88,901
Median household income for apartments without a mortgage: $77,050
Median monthly housing costs: $1,126
Data:
Median house or condo value ($)
Median house or condo value ($ change since 2000)
Median house or condo value ($) - White
Median house or condo value ($) - Black or African American
Median house or condo value ($) - Asian
Median house or condo value ($) - Hispanic or Latino
Median house or condo value ($) - American Indian and Alaska Native
Median house or condo value ($) - Multirace
Median house or condo value ($) - Other Race
Median price asked for mobile homes ($)
Household density (households per square mile)
Mean house or condo value by units in structure - 1, detached ($)
Mean house or condo value by units in structure - 1, attached ($)
Mean house or condo value by units in structure - 2 ($)
Mean house or condo value by units in structure by units in structure - 3 or 4 ($)
Mean house or condo value by units in structure - 5 or more ($)
Mean house or condo value by units in structure - Boat, RV, van, etc. ($)
Mean house or condo value by units in structure - Mobile home ($)
Median contract rent ($)
Median contract rent - Lower quartile ($)
Median contract rent - Upper quartile ($)
Median gross rent ($)
Urban houses (%)
Rural houses (%)
Houses occupied (%)
Houses occupied (% change since 2000)
Houses owner occupied (%)
Houses owner occupied (% change since 2000)
Houses renter occupied (%)
Houses renter occupied (% change since 2000)
Vacant housing units - For rent (%)
Vacant housing units - For rent (% change since 2000)
Vacant housing units - For sale only (%)
Vacant housing units - For sale only (% change since 2000)
Vacant housing units - Rented or sold, not occupied (%)
Vacant housing units - Rented or sold, not occupied (% change since 2000)
Vacant housing units - For seasonal, recreational, or occasional use (%)
Vacant housing units - For seasonal, recreational, or occasional use (% change since 2000)
Vacant housing units - For migrant workers (%)
Vacant housing units - For migrant workers (% change since 2000)
Vacant housing units - Other vacant (%)
Vacant housing units - Other vacant (% change since 2000)
Median monthly housing costs ($)
Median household income for houses/condos with a mortgage ($)
Median household income for houses/condos without a mortgage ($)
Median household income ($)
Median household income ($) - White
Median household income ($) - Black or African American
Median household income ($) - Asian
Median household income ($) - Hispanic or Latino
Median household income ($) - American Indian and Alaska Native
Median household income ($) - Multirace
Median household income ($) - Other Race
Mortgage status - with mortgage (%)
Mortgage status - with second mortgage (%)
Mortgage status - with home equity loan (%)
Mortgage status - with both second mortgage and home equity loan (%)
Mortgage status - without a mortgage (%)
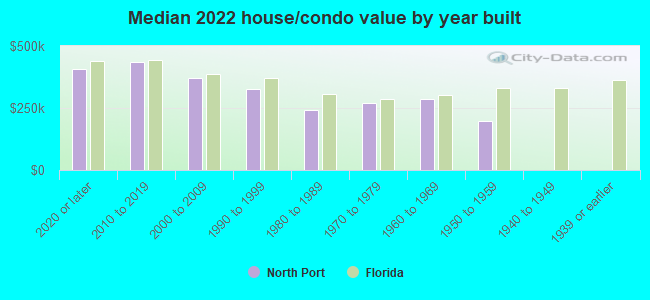
Median year house/condo built
Median year apartment built
Household type by relationship - Male householder living alone (%)
Household type by relationship - Male householder not living alone (%)
Household type by relationship - Female householder living alone (%)
Household type by relationship - Female householder not living alone (%)
Household type by relationship - Opposite-Sex spouse (%)
Household type by relationship - Same-Sex spouse (%)
Household type by relationship - Opposite-Sex unmarried partner (%)
Household type by relationship - Same-Sex unmarried partner (%)
Household type by relationship - In group quarters (%)
Size of family households - 2-person household (%)
Size of family households - 3-person household (%)
Size of family households - 4-person household (%)
Size of family households - 5-person household (%)
Size of family households - 6-person household (%)
Size of family households - 7-or-more-person household (%)
Size of nonfamily households - 1-person household (%)
Size of nonfamily households - 2-person household (%)
Size of nonfamily households - 3-person household (%)
Size of nonfamily households - 4-person household (%)
Size of nonfamily households - 5-person household (%)
Size of nonfamily households - 6-person household (%)
Size of nonfamily households - 7-or-moreperson household (%)
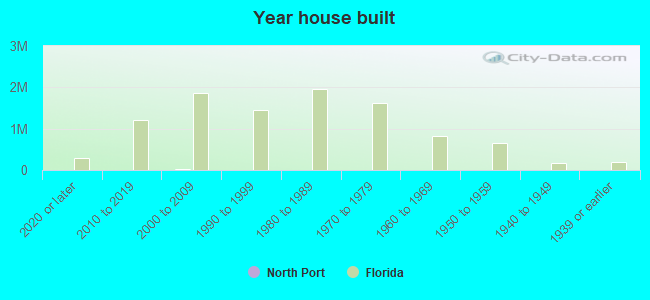
Year house built - Built 2010 or later (%)
Year house built - Built 2000 to 2009 (%)
Year house built - Built 1990 to 1999 (%)
Year house built - Built 1980 to 1989 (%)
Year house built - Built 1970 to 1979 (%)
Year house built - Built 1960 to 1969 (%)
Year house built - Built 1950 to 1959 (%)
Year house built - Built 1940 to 1949 (%)
Year house built - Built 1939 or earlier (%)
Median number of rooms in houses and condos
Median number of rooms in apartments
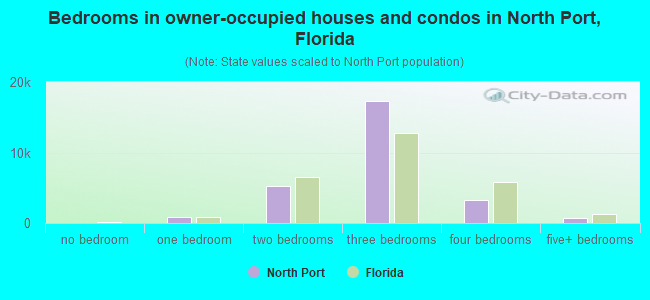
Median number of bedrooms in owner occupied houses
Mean number of bedrooms in owner occupied houses
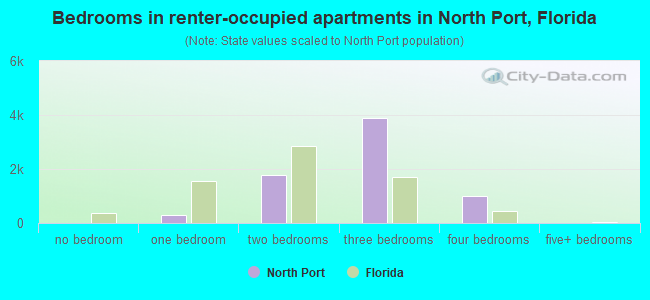
Median number of bedrooms in renter occupied houses
Mean number of bedrooms in renter occupied houses
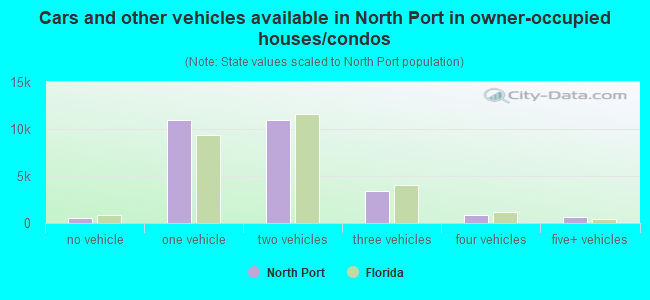
Median number of vehichles in owner occupied houses
Mean number of vehichles in owner occupied houses
Median number of vehichles in renter occupied houses
Mean number of vehichles in renter occupied houses
Rooms in owner-occupied houses - 1 room (%)
Rooms in owner-occupied houses - 2 rooms (%)
Rooms in owner-occupied houses - 3 rooms (%)
Rooms in owner-occupied houses - 4 rooms (%)
Rooms in owner-occupied houses - 5 rooms (%)
Rooms in owner-occupied houses - 6 rooms (%)
Rooms in owner-occupied houses - 7 rooms (%)
Rooms in owner-occupied houses - 8 rooms (%)
Rooms in owner-occupied houses - 9+ rooms (%)
Rooms in renter-occupied houses - 1 room (%)
Rooms in renter-occupied houses - 2 rooms (%)
Rooms in renter-occupied houses - 3 rooms (%)
Rooms in renter-occupied houses - 4 rooms (%)
Rooms in renter-occupied houses - 5 rooms (%)
Rooms in renter-occupied houses - 6 rooms (%)
Rooms in renter-occupied houses - 7 rooms (%)
Rooms in renter-occupied houses - 8 rooms (%)
Rooms in renter-occupied houses - 9+ rooms (%)
Bedrooms in owner-occupied houses - no bedrooms (%)
Bedrooms in owner-occupied houses - 1 bedroom (%)
Bedrooms in owner-occupied houses - 2 bedrooms (%)
Bedrooms in owner-occupied houses - 3 bedrooms (%)
Bedrooms in owner-occupied houses - 4 bedrooms (%)
Bedrooms in owner-occupied houses - 5+ bedrooms (%)
Bedrooms in renter-occupied houses - no bedrooms (%)
Bedrooms in renter-occupied houses - 1 bedroom (%)
Bedrooms in renter-occupied houses - 2 bedrooms (%)
Bedrooms in renter-occupied houses - 3 bedrooms (%)
Bedrooms in renter-occupied houses - 4 bedrooms (%)
Bedrooms in renter-occupied houses - 5+ bedrooms (%)
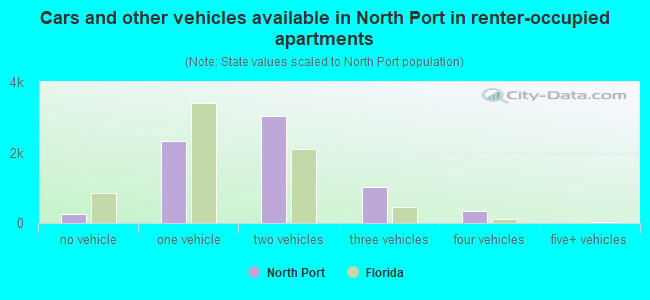
Vehicles available in owner-occupied houses - no vehicle available (%)
Vehicles available in owner-occupied houses - 1 vehicle available(%)
Vehicles available in owner-occupied houses - 2 Vehicles available (%)
Vehicles available in owner-occupied houses - 3 Vehicles available (%)
Vehicles available in owner-occupied houses - 4 Vehicles available (%)
Vehicles available in owner-occupied houses - 5+ Vehicles available (%)
Vehicles available in renter-occupied houses - no vehicle available (%)
Vehicles available in renter-occupied houses - 1 vehicle available (%)
Vehicles available in renter-occupied houses - 2 Vehicles available (%)
Vehicles available in renter-occupied houses - 3 Vehicles available (%)
Vehicles available in renter-occupied houses - 4 Vehicles available (%)
Vehicles available in renter-occupied houses - 5+ Vehicles available (%)
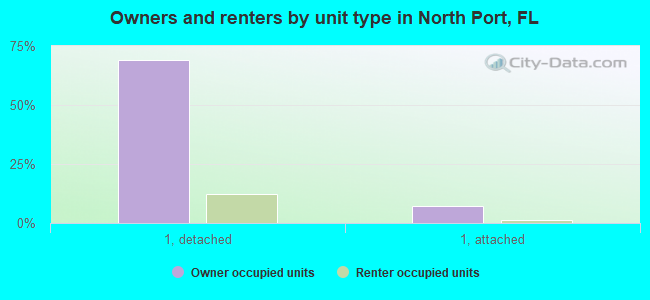
Housing units in structures - 1, detached (%)
Housing units in structures - 1, attached (%)
Housing units in structures - 2 (%)
Housing units in structures - 3 or 4 (%)
Housing units in structures - 5 to 9 (%)
Housing units in structures - 10 to 19 (%)
Housing units in structures - 20 to 49 (%)
Housing units in structures - 50 or more (%)
Housing units in structures - Mobile home (%)
Housing units in structures - Boat, RV, van, etc. (%)
Housing units in structures - Owners - 1, detached (%)
Housing units in structures - Owners - 1, attached (%)
Housing units in structures - Owners - 2 (%)
Housing units in structures - Owners - 3 or 4 (%)
Housing units in structures - Owners - 5 to 9 (%)
Housing units in structures - Owners - 10 to 19 (%)
Housing units in structures - Owners - 20 to 49 (%)
Housing units in structures - Owners - 50 or more (%)
Housing units in structures - Owners - Mobile home (%)
Housing units in structures - Owners - Boat, RV, van, etc. (%)
Housing units in structures - Renters - 1, detached (%)
Housing units in structures - Renters - 1, attached (%)
Housing units in structures - Renters - 2 (%)
Housing units in structures - Renters - 3 or 4 (%)
Housing units in structures - Renters - 5 to 9 (%)
Housing units in structures - Renters - 10 to 19 (%)
Housing units in structures - Renters - 20 to 49 (%)
Housing units in structures - Renters - 50 or more (%)
Housing units in structures - Renters - Mobile home (%)
Housing units in structures - Renters - Boat, RV, van, etc. (%)
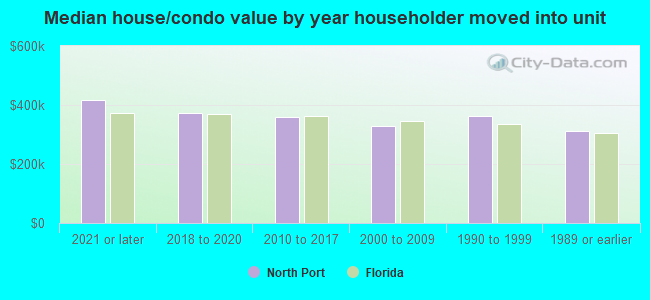
House/condo owner moved in on average (years ago)
Renter moved in on average (years ago)
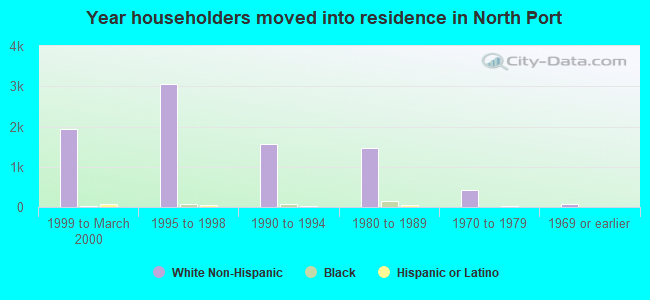
Year householder moved into unit - Moved in 1999 to March 2000 (%)
Year householder moved into unit - Moved in 1999 to March 2000 (%) - White
Year householder moved into unit - Moved in 1999 to March 2000 (%) - Black or African American
Year householder moved into unit - Moved in 1999 to March 2000 (%) - Asian
Year householder moved into unit - Moved in 1999 to March 2000 (%) - Hispanic or Latino
Year householder moved into unit - Moved in 1999 to March 2000 (%) - American Indian and Alaska Native
Year householder moved into unit - Moved in 1999 to March 2000 (%) - Multirace
Year householder moved into unit - Moved in 1999 to March 2000 (%) - Other Race
Year householder moved into unit - Moved in 1995 to 1998 (%)
Year householder moved into unit - Moved in 1995 to 1998 (%) - White
Year householder moved into unit - Moved in 1995 to 1998 (%) - Black or African American
Year householder moved into unit - Moved in 1995 to 1998 (%) - Asian
Year householder moved into unit - Moved in 1995 to 1998 (%) - Hispanic or Latino
Year householder moved into unit - Moved in 1995 to 1998 (%) - American Indian and Alaska Native
Year householder moved into unit - Moved in 1995 to 1998 (%) - Multirace
Year householder moved into unit - Moved in 1995 to 1998 (%) - Other Race
Year householder moved into unit - Moved in 1990 to 1994 (%)
Year householder moved into unit - Moved in 1990 to 1994 (%) - White
Year householder moved into unit - Moved in 1990 to 1994 (%) - Black or African American
Year householder moved into unit - Moved in 1990 to 1994 (%) - Asian
Year householder moved into unit - Moved in 1990 to 1994 (%) - Hispanic or Latino
Year householder moved into unit - Moved in 1990 to 1994 (%) - American Indian and Alaska Native
Year householder moved into unit - Moved in 1990 to 1994 (%) - Multirace
Year householder moved into unit - Moved in 1990 to 1994 (%) - Other Race
Year householder moved into unit - Moved in 1980 to 1989 (%)
Year householder moved into unit - Moved in 1980 to 1989 (%) - White
Year householder moved into unit - Moved in 1980 to 1989 (%) - Black or African American
Year householder moved into unit - Moved in 1980 to 1989 (%) - Asian
Year householder moved into unit - Moved in 1980 to 1989 (%) - Hispanic or Latino
Year householder moved into unit - Moved in 1980 to 1989 (%) - American Indian and Alaska Native
Year householder moved into unit - Moved in 1980 to 1989 (%) - Multirace
Year householder moved into unit - Moved in 1980 to 1989 (%) - Other Race
Year householder moved into unit - Moved in 1970 to 1979 (%)
Year householder moved into unit - Moved in 1970 to 1979 (%) - White
Year householder moved into unit - Moved in 1970 to 1979 (%) - Black or African American
Year householder moved into unit - Moved in 1970 to 1979 (%) - Asian
Year householder moved into unit - Moved in 1970 to 1979 (%) - Hispanic or Latino
Year householder moved into unit - Moved in 1970 to 1979 (%) - American Indian and Alaska Native
Year householder moved into unit - Moved in 1970 to 1979 (%) - Multirace
Year householder moved into unit - Moved in 1970 to 1979 (%) - Other Race
Year householder moved into unit - Moved in 1969 or earlier (%)
Year householder moved into unit - Moved in 1969 or earlier (%) - White
Year householder moved into unit - Moved in 1969 or earlier (%) - Black or African American
Year householder moved into unit - Moved in 1969 or earlier (%) - Asian
Year householder moved into unit - Moved in 1969 or earlier (%) - Hispanic or Latino
Year householder moved into unit - Moved in 1969 or earlier (%) - American Indian and Alaska Native
Year householder moved into unit - Moved in 1969 or earlier (%) - Multirace
Year householder moved into unit - Moved in 1969 or earlier (%) - Other Race
Housing units lacking complete plumbing facilities (%)
Housing units lacking complete kitchen facilities (%)
House heating fuel used in houses and condos - Utility gas (%)
House heating fuel used in houses and condos - Bottled, tank, or LP gas (%)
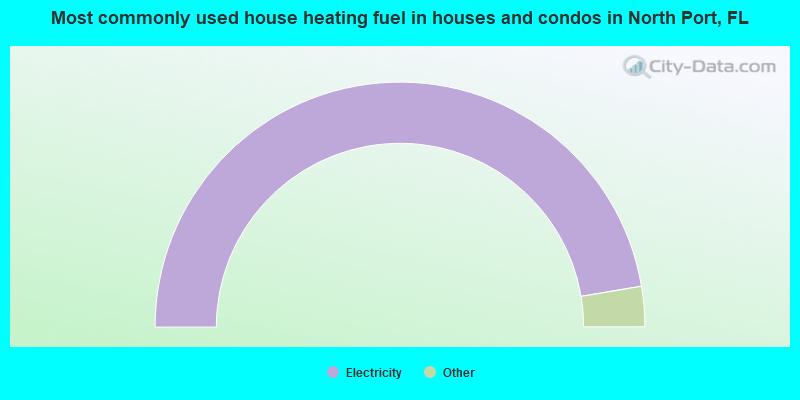
House heating fuel used in houses and condos - Electricity (%)
House heating fuel used in houses and condos - Fuel oil, kerosene, etc. (%)
House heating fuel used in houses and condos - Coal or coke (%)
House heating fuel used in houses and condos - Wood (%)
House heating fuel used in houses and condos - Solar energy (%)
House heating fuel used in houses and condos - Other fuel (%)
House heating fuel used in houses and condos - No fuel used (%)
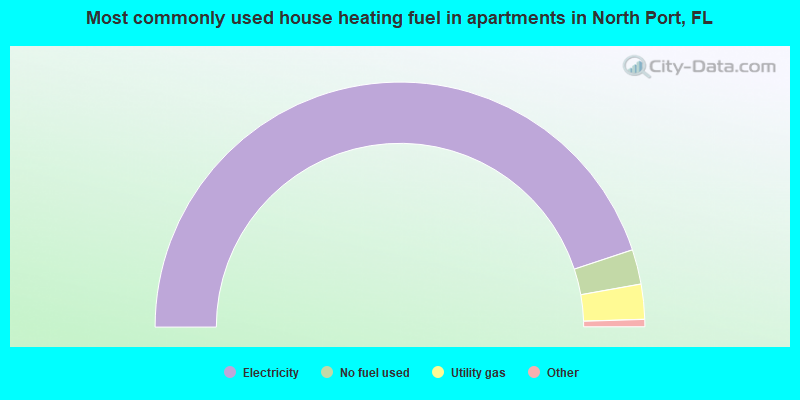
House heating fuel used in apartments - Utility gas (%)
House heating fuel used in apartments - Bottled, tank, or LP gas (%)
House heating fuel used in apartments - Electricity (%)
House heating fuel used in apartments - Fuel oil, kerosene, etc. (%)
House heating fuel used in apartments - Coal or coke (%)
House heating fuel used in apartments - Wood (%)
House heating fuel used in apartments - Solar energy (%)
House heating fuel used in apartments - Other fuel (%)
House heating fuel used in apartments - No fuel used (%)
Median year house/condo built: 2005Median year apartment built: 2005Household type by relationship:
Households: 85,102
Male householders: 17,391 (3,819 living alone ), Female householders: 16,906 (4,503 living alone )17,778 spouses (17,373 opposite-sex spouses ), 3,508 unmarried partners , (3,440 opposite-sex unmarried partners ), 20,960 children (18,810 natural , 243 adopted , 1,907 stepchildren ), 2,013 grandchildren , 224 brothers or sisters , 1,136 parents , 0 foster children , 1,368 other relatives , 3,618 non-relatives In group quarters: 200
Size of family households: 12,476 2-persons , 3,698 3-persons , 4,048 4-persons , 2,005 5-persons , 246 6-persons , 764 7-or-more-persons .
Size of nonfamily households: 8,322 1-person , 2,279 2-persons , 297 3-persons , 162 4-persons .
9,236 married couples with children. single-parent households (983 men , 1,962 women ).
85.6% of residents of North Port speak English at home. of residents speak Spanish at home (60% speak English very well , 23% speak English well , 14% speak English not well , 3% don't speak English at all ).of residents speak other Indo-European language at home (75% speak English very well , 19% speak English well , 6% speak English not well , 1% don't speak English at all ).of residents speak Asian or Pacific Island language at home (49% speak English very well , 26% speak English well , 24% speak English not well , 1% don't speak English at all ).of residents speak other language at home (95% speak English very well , 5% speak English not well ).
Foreign born population: 15,832 (18.6%)of them are naturalized citizens )
Median number of rooms in houses and condos:
Median number of rooms in apartments
Owner-occupied Renter-occupied
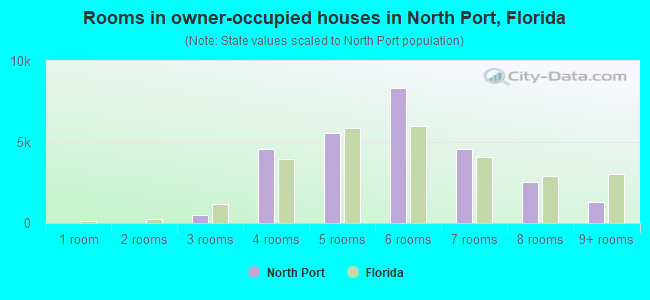
Rooms in owner-occupied houses in North Port, Florida
0 1 room 0 2 rooms 483 3 rooms 4,583 4 rooms 5,558 5 rooms 8,335 6 rooms 4,559 7 rooms 2,505 8 rooms 1,305 9+ rooms
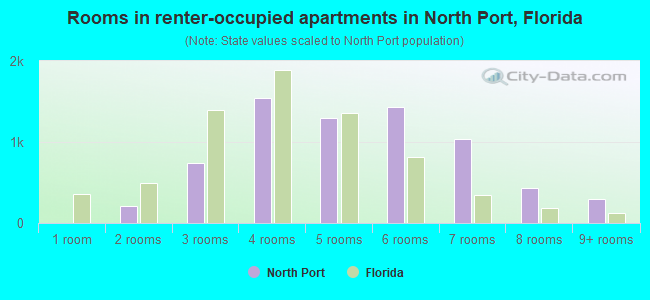
Rooms in renter-occupied apartments in North Port, Florida
0 1 room 211 2 rooms 739 3 rooms 1,539 4 rooms 1,296 5 rooms 1,428 6 rooms 1,038 7 rooms 427 8 rooms 291 9+ rooms
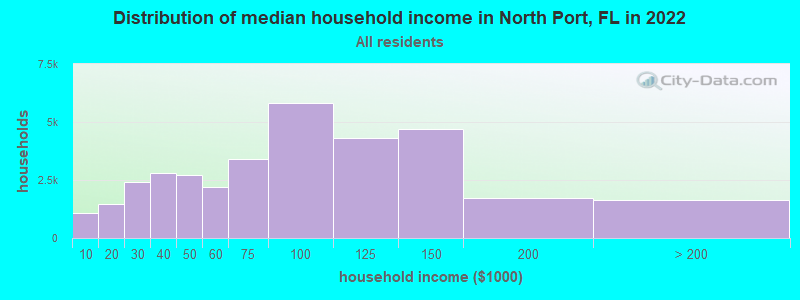
North Port, FL household income distribution 1,057 Less than $10,0001,452 $10,000 to $19,9992,432 $20,000 to $29,9992,817 $30,000 to $39,9992,718 $40,000 to $49,9992,207 $50,000 to $59,9993,424 $60,000 to $74,9995,819 $75,000 to $99,9994,318 $100,000 to $124,9994,687 $125,000 to $149,9991,737 $150,000 to $199,9991,629 $200,000 or more
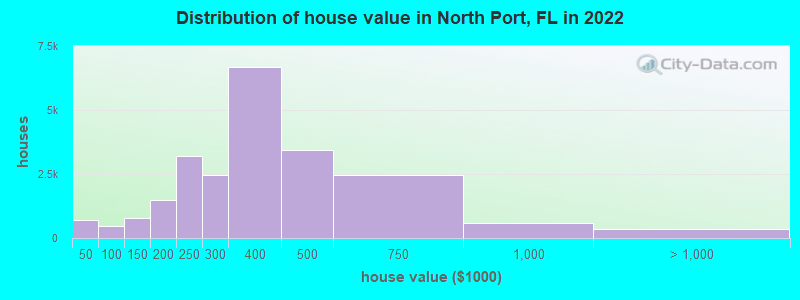
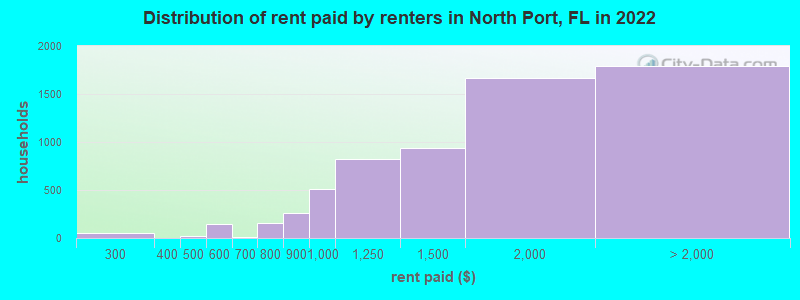
Home value of owner - occupied houses in 2022 in North Port, FL 251 Less than $10,0009 $10,000 to $14,99935 $15,000 to $19,999138 $20,000 to $24,999129 $25,000 to $29,999101 $30,000 to $34,99927 $40,000 to $49,99953 $50,000 to $59,99982 $60,000 to $69,99956 $70,000 to $79,99972 $80,000 to $89,999184 $90,000 to $99,999382 $100,000 to $124,999382 $125,000 to $149,999751 $150,000 to $174,999732 $175,000 to $199,9993,220 $200,000 to $249,9992,465 $250,000 to $299,9996,671 $300,000 to $399,9993,418 $400,000 to $499,9992,463 $500,000 to $749,999599 $750,000 to $999,99988 $1,000,000 to $1,499,999228 $1,500,000 to $1,999,99948 $2,000,000 or moreRent paid by renters in 2022 in North Port, FL 9 Less than $10013 $100 to $14947 $200 to $24919 $400 to $44943 $500 to $549107 $550 to $59914 $600 to $64968 $700 to $74986 $750 to $799256 $800 to $899513 $900 to $999821 $1,000 to $1,249933 $1,250 to $1,4991,666 $1,500 to $1,999416 $2,000 to $2,499224 $2,500 to $2,999124 $3,500 or more1,027 No cash rent
Percentage of workers working in this county: 73.3%Number of people working at home: 3,640 (10.8% of all workers )
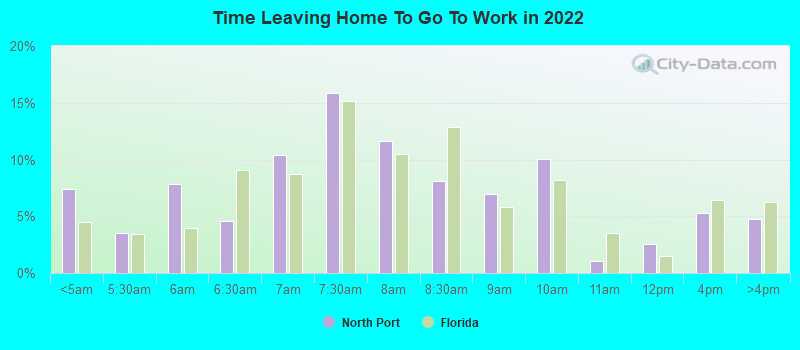
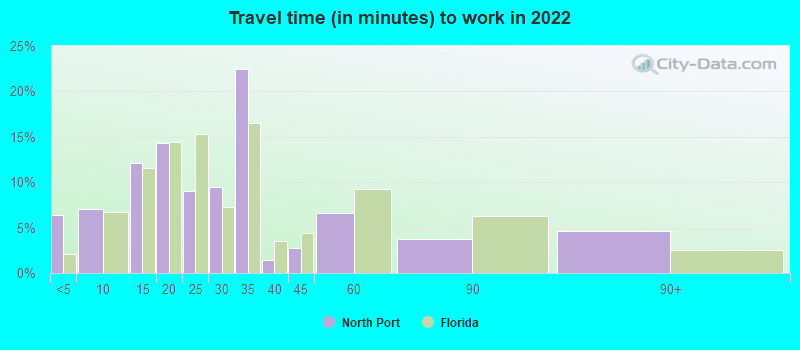
Travel time to work (commute)
Less than 5 minutes: 1,2425 to 9 minutes: 1,06910 to 14 minutes: 3,92515 to 19 minutes: 2,18920 to 24 minutes: 4,24525 to 29 minutes: 3,11230 to 34 minutes: 6,49235 to 39 minutes: 2,46240 to 44 minutes: 1,00945 to 59 minutes: 4,12160 to 89 minutes: 3,06690 or more minutes: 502
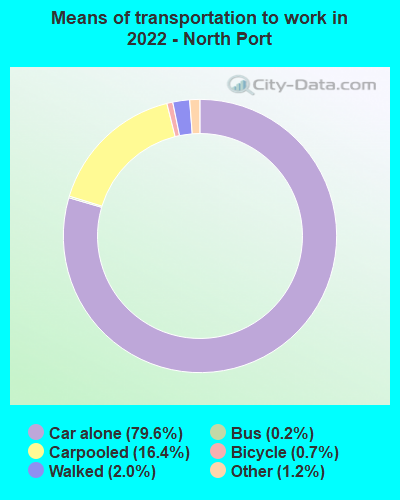
Means of transportation to work:
Drove a car alone: 9,294 (60.6%)Carpooled: 2,230 (14.6%)Bus : 10 (0.1%)Taxi: 211 (1.4%)Bicycle: 78 (0.5%)Walked: 423 (2.8%)Worked at home: 3,640 (23.8%)
Unemployment by race in 2022
Unemployment rate for White non-Hispanic residents 0.8% Males3.9% FemalesUnemployment rate for Black residents 14.8% MalesUnemployment rate for Asian residents 3.5% FemalesUnemployment rate for other race residents 6.4% FemalesUnemployment rate for two or more race residents 3.9% Males1.2% FemalesUnemployment rate for Hispanic or Latino residents 1.3% Males0.6% Females
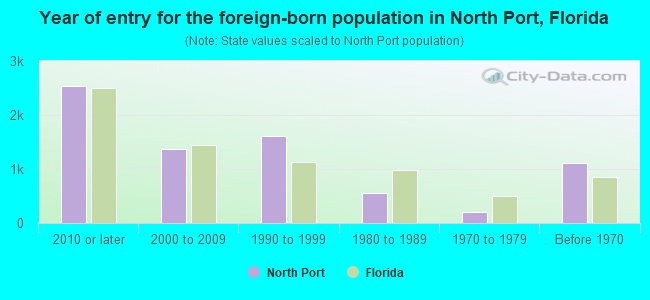
Year of entry for the foreign-born population in North Port, Florida
2,536 2010 or later 1,376 2000 to 2009 1,618 1990 to 1999 552 1980 to 1989 199 1970 to 1979 1,108 Before 1970
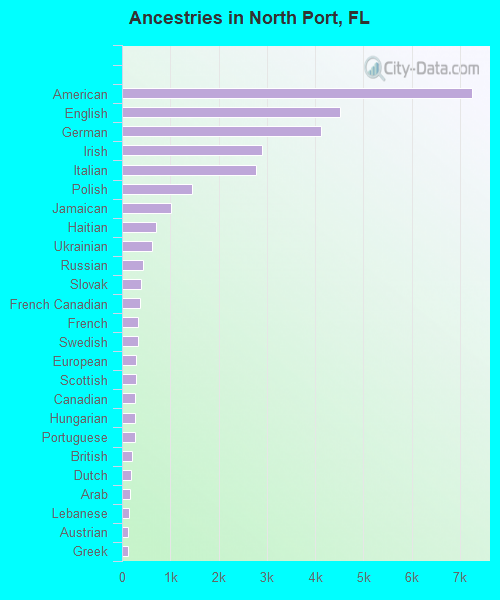
First ancestries reported:
American: 7,242 (18.6%)
English: 4,516 (11.6%)
German: 4,115 (10.6%)
Irish: 2,903 (7.5%)
Italian: 2,776 (7.1%)
Polish: 1,441 (3.7%)
Jamaican: 1,023 (2.6%)
Haitian: 695 (1.8%)
Ukrainian: 615 (1.6%)
Russian: 436 (1.1%)
Slovak: 397 (1.0%)
French Canadian: 364 (0.9%)
French: 340 (0.9%)
Swedish: 336 (0.9%)
European: 286 (0.7%)
Scottish: 284 (0.7%)
Canadian: 273 (0.7%)
Hungarian: 262 (0.7%)
Portuguese: 259 (0.7%)
British: 197 (0.5%)
Dutch: 183 (0.5%)
Arab: 157 (0.4%)
Lebanese: 151 (0.4%)
Austrian: 130 (0.3%)
Greek: 129 (0.3%)
Danish: 126 (0.3%)
African: 106 (0.3%)
Slavic: 100 (0.3%)
Bahamian: 96 (0.2%)
Guyanese: 95 (0.2%)
Armenian: 75 (0.2%)
Scotch-Irish: 73 (0.2%)
Scandinavian: 73 (0.2%)
Romanian: 71 (0.2%)
Norwegian: 70 (0.2%)
Czech: 68 (0.2%)
Welsh: 67 (0.2%)
Syrian: 62 (0.2%)
Finnish: 58 (0.1%)
Lithuanian: 57 (0.1%)
Pennsylvania German: 45 (0.1%)
Bulgarian: 44 (0.1%)
Serbian: 44 (0.1%)
Trinidadian and Tobagonian: 36 (0.09%)
Northern European: 20 (0.05%)
Czechoslovakian: 12 (0.03%)
Swiss: 11 (0.03%)
Brazilian: 10 (0.03%)
Belgian: 10 (0.03%)
Maltese: 7 (0.02%)
Eastern European: 7 (0.02%)
Croatian: 5 (0.01%)
Most common places of birth for foreign-born residents (%): Cuba North Port:
11.9% (999)Florida:
22.0% (1,006,576)
Peru North Port:
9.7% (817)Florida:
2.1% (96,693)
Canada North Port:
6.6% (557)Florida:
2.4% (109,132)
Jamaica North Port:
6.6% (554)Florida:
5.0% (227,319)
Haiti North Port:
6.4% (533)Florida:
7.5% (342,375)
Guatemala North Port:
5.0% (423)Florida:
2.1% (97,632)
Ukraine North Port:
4.4% (366)Florida:
0.5% (21,886)
Germany North Port:
3.6% (300)Florida:
1.2% (54,272)
Russia North Port:
3.1% (256)Florida:
0.7% (31,076)
Philippines North Port:
2.4% (197)Florida:
1.8% (84,403)
Thailand North Port:
2.2% (183)Florida:
0.3% (12,303)
Czechoslovakia (includes Czech Republic and Slovakia) North Port:
2.1% (177)Florida:
0.2% (8,038)
Poland North Port:
2.1% (174)Florida:
0.6% (25,219)
Venezuela North Port:
2.0% (169)Florida:
5.7% (262,042)
England North Port:
1.7% (144)Florida:
0.8% (37,723)
Guyana North Port:
1.6% (136)Florida:
0.7% (33,556)
Colombia North Port:
1.6% (134)Florida:
6.5% (298,669)
Bolivia North Port:
1.6% (134)Florida:
0.2% (10,861)
Place of birth for U.S.-born residents:
This state: 22,540Other state: 45,222Northeast: 19,687Midwest: 15,170South: 7,231West: 3,134 86.0% of North Port residents lived in the same house 1 years ago.
Out of people who lived in different houses, 19.5% lived in this county.
Out of people who lived in different counties, 42.8% lived in Florida.
North Port:
86.0%State average:
86.3%
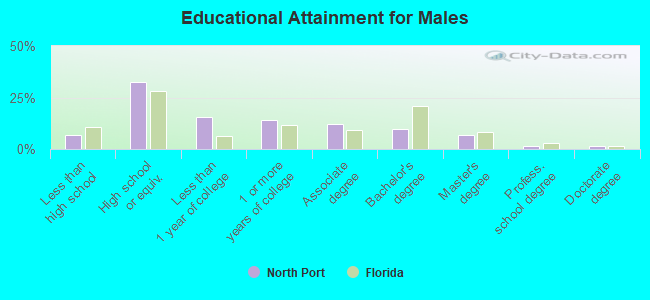
Education attainment for males 25 years and older:
No schooling: 282Nursery to 4th grade: 05th and 6th grade: 747th and 8th grade: 3679th grade: 010th grade: 14611th grade: 70112th grade, no diploma: 394High school graduate (or equivalency): 9,463Less than 1 year of college: 4,502Some college more than 1 year, no degree: 4,058Associate degree: 3,588Bachelor's degree: 2,895Master's degree: 1,981Professional school degree: 406Doctorate degree: 422
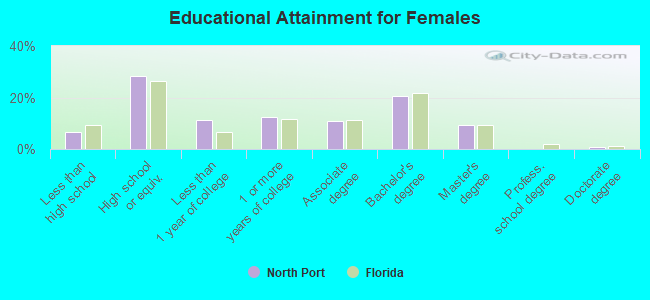
Education attainment for females 25 years and older:
No schooling: 276Nursery to 4th grade: 1035th and 6th grade: 3357th and 8th grade: 09th grade: 010th grade: 13811th grade: 13012th grade, no diploma: 1,072High school graduate (or equivalency): 9,023Less than 1 year of college: 3,574Some college more than 1 year, no degree: 3,974Associate degree: 3,422Bachelor's degree: 6,539Master's degree: 2,996Professional school degree: 0Doctorate degree: 296
Housing units in structures:
One, detached: 28,687One, attached: 3,645Two: 453 or 4: 7025 to 9: 42410 to 19: 38420 to 49: 87450 or more: 280Mobile homes: 1,351Median worth of mobile homes: $75,000
Housing units lacking complete kitchen facilities in 2022: 0.7%House/condo owner moved in on average 5 years ago
Renter moved in on average 3 years ago
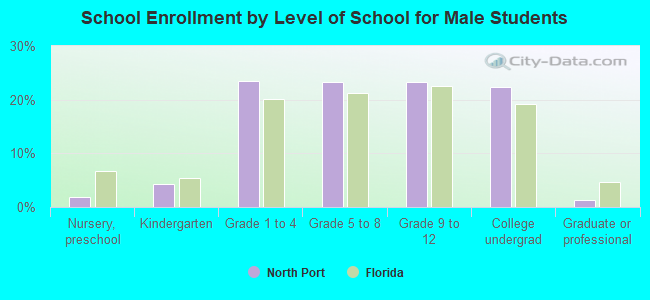
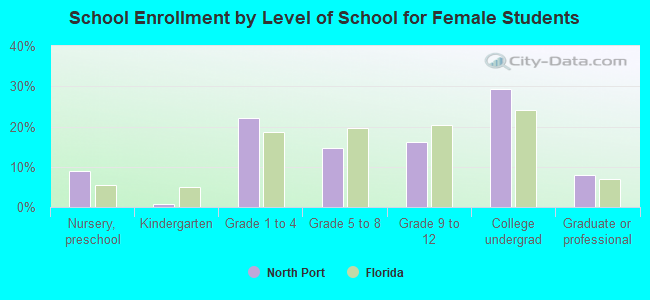
Private vs. public school enrollment:
Students in private schools in grades 1 to 8 (elementary and middle school): 853 Students in private schools in grades 9 to 12 (high school): 437 Students in private undergraduate colleges: 645