North Potomac, MD (Maryland) Houses and Residents
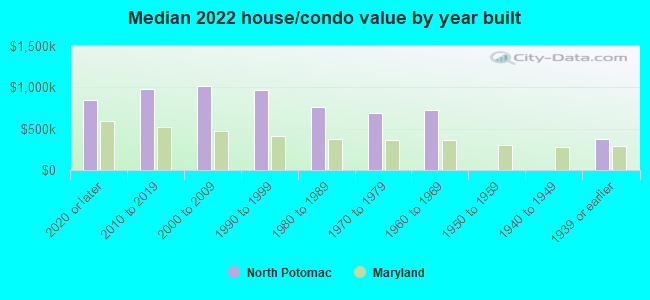
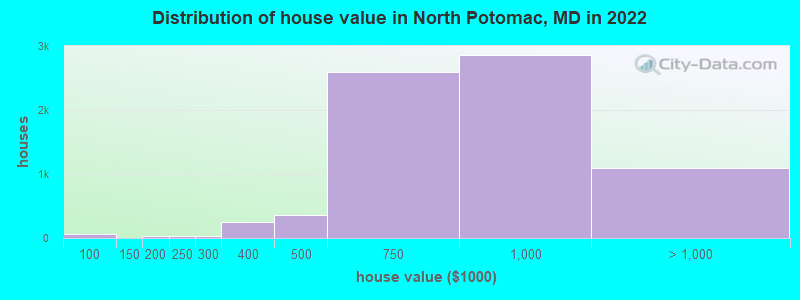
Estimated median house or condo value in 2022: $802,819 (it was $305,400 in 2000 )
North Potomac:
$802,819Maryland:
$398,100
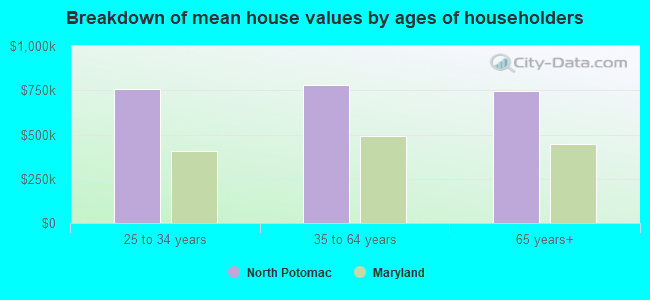
Lower value quartile - upper value quartile: $599,104 - $955,688Mean price in 2022: Detached houses: $1,028,685 Here:
$1,028,685State:
$526,819
Townhouses or other attached units: $696,352 Here:
$696,352State:
$328,305
In 3-to-4-unit structures: $438,808 Here:
$438,808State:
$295,378
In 5-or-more-unit structures: $461,849 Here:
$461,849State:
$350,378
Total population: 24,410 (Urban population: 22,945, Rural population: 0)
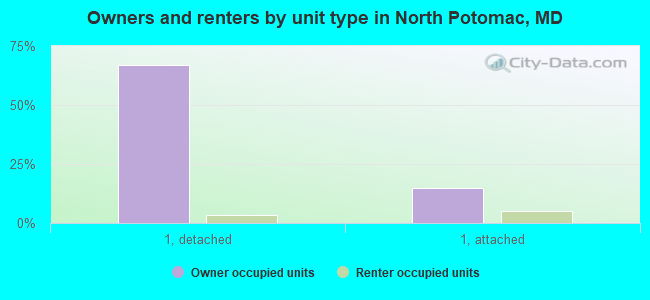
Houses: 8,567 (8,337 occupied: 6,978 owner occupied, 1,422 renter occupied )
% of renters here:
17%State:
32%
Housing density: 1,309 houses/condos per square mile
Median price asked for vacant for-sale houses and condos in 2022: $636,757.
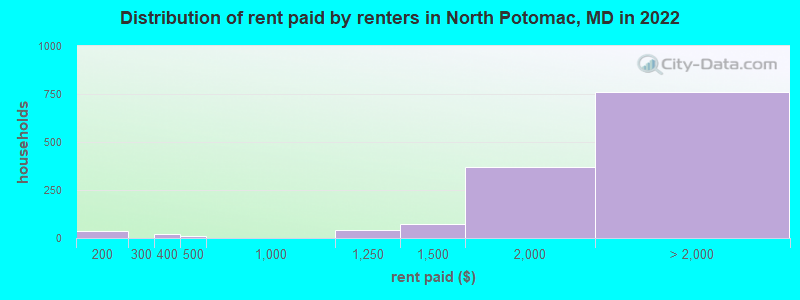
Median contract rent in 2022: over $2,000 (lower quartile is $1,662, upper quartile is over $2,000)
Median rent asked for vacant for-rent units in 2022: $1,890
Median gross rent in North Potomac, MD in 2022: over $2,000
Housing units in North Potomac with a mortgage: 4,633 (723 second mortgage, 0 home equity loan, 702 both second mortgage and home equity loan )Houses without a mortgage: 57
Median household income for houses/condos with a mortgage: $204,077
Median household income for apartments without a mortgage: $153,571
Median monthly housing costs: $2,370
Data:
Median house or condo value ($)
Median house or condo value ($ change since 2000)
Median house or condo value ($) - White
Median house or condo value ($) - Black or African American
Median house or condo value ($) - Asian
Median house or condo value ($) - Hispanic or Latino
Median house or condo value ($) - American Indian and Alaska Native
Median house or condo value ($) - Multirace
Median house or condo value ($) - Other Race
Median price asked for mobile homes ($)
Household density (households per square mile)
Mean house or condo value by units in structure - 1, detached ($)
Mean house or condo value by units in structure - 1, attached ($)
Mean house or condo value by units in structure - 2 ($)
Mean house or condo value by units in structure by units in structure - 3 or 4 ($)
Mean house or condo value by units in structure - 5 or more ($)
Mean house or condo value by units in structure - Boat, RV, van, etc. ($)
Mean house or condo value by units in structure - Mobile home ($)
Median contract rent ($)
Median contract rent - Lower quartile ($)
Median contract rent - Upper quartile ($)
Median gross rent ($)
Urban houses (%)
Rural houses (%)
Houses occupied (%)
Houses occupied (% change since 2000)
Houses owner occupied (%)
Houses owner occupied (% change since 2000)
Houses renter occupied (%)
Houses renter occupied (% change since 2000)
Vacant housing units - For rent (%)
Vacant housing units - For rent (% change since 2000)
Vacant housing units - For sale only (%)
Vacant housing units - For sale only (% change since 2000)
Vacant housing units - Rented or sold, not occupied (%)
Vacant housing units - Rented or sold, not occupied (% change since 2000)
Vacant housing units - For seasonal, recreational, or occasional use (%)
Vacant housing units - For seasonal, recreational, or occasional use (% change since 2000)
Vacant housing units - For migrant workers (%)
Vacant housing units - For migrant workers (% change since 2000)
Vacant housing units - Other vacant (%)
Vacant housing units - Other vacant (% change since 2000)
Median monthly housing costs ($)
Median household income for houses/condos with a mortgage ($)
Median household income for houses/condos without a mortgage ($)
Median household income ($)
Median household income ($) - White
Median household income ($) - Black or African American
Median household income ($) - Asian
Median household income ($) - Hispanic or Latino
Median household income ($) - American Indian and Alaska Native
Median household income ($) - Multirace
Median household income ($) - Other Race
Mortgage status - with mortgage (%)
Mortgage status - with second mortgage (%)
Mortgage status - with home equity loan (%)
Mortgage status - with both second mortgage and home equity loan (%)
Mortgage status - without a mortgage (%)
Median year house/condo built
Median year apartment built
Household type by relationship - Male householder living alone (%)
Household type by relationship - Male householder not living alone (%)
Household type by relationship - Female householder living alone (%)
Household type by relationship - Female householder not living alone (%)
Household type by relationship - Opposite-Sex spouse (%)
Household type by relationship - Same-Sex spouse (%)
Household type by relationship - Opposite-Sex unmarried partner (%)
Household type by relationship - Same-Sex unmarried partner (%)
Household type by relationship - In group quarters (%)
Size of family households - 2-person household (%)
Size of family households - 3-person household (%)
Size of family households - 4-person household (%)
Size of family households - 5-person household (%)
Size of family households - 6-person household (%)
Size of family households - 7-or-more-person household (%)
Size of nonfamily households - 1-person household (%)
Size of nonfamily households - 2-person household (%)
Size of nonfamily households - 3-person household (%)
Size of nonfamily households - 4-person household (%)
Size of nonfamily households - 5-person household (%)
Size of nonfamily households - 6-person household (%)
Size of nonfamily households - 7-or-moreperson household (%)
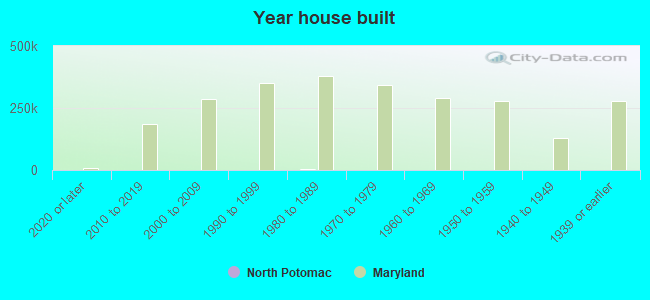
Year house built - Built 2010 or later (%)
Year house built - Built 2000 to 2009 (%)
Year house built - Built 1990 to 1999 (%)
Year house built - Built 1980 to 1989 (%)
Year house built - Built 1970 to 1979 (%)
Year house built - Built 1960 to 1969 (%)
Year house built - Built 1950 to 1959 (%)
Year house built - Built 1940 to 1949 (%)
Year house built - Built 1939 or earlier (%)
Median number of rooms in houses and condos
Median number of rooms in apartments
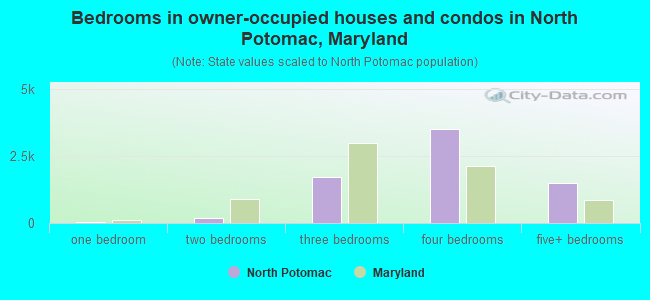
Median number of bedrooms in owner occupied houses
Mean number of bedrooms in owner occupied houses
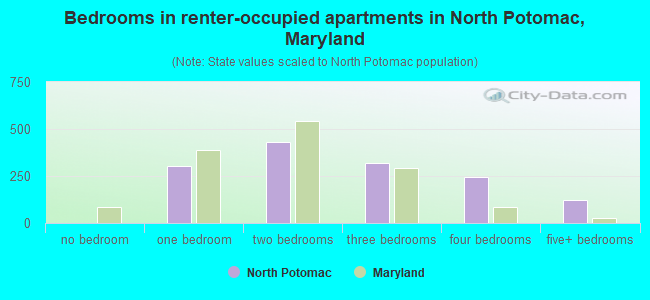
Median number of bedrooms in renter occupied houses
Mean number of bedrooms in renter occupied houses
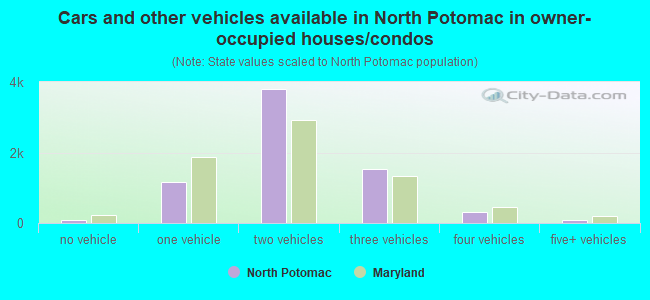
Median number of vehichles in owner occupied houses
Mean number of vehichles in owner occupied houses
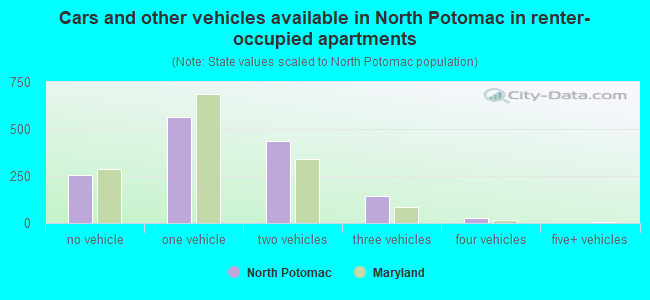
Median number of vehichles in renter occupied houses
Mean number of vehichles in renter occupied houses
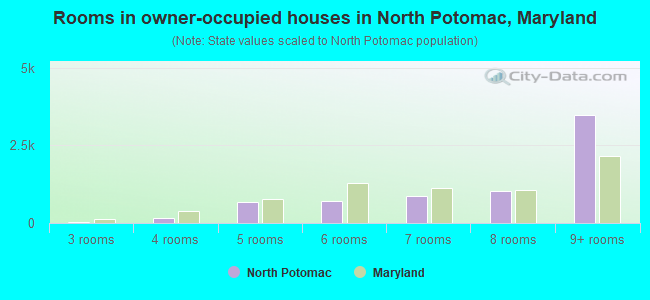
Rooms in owner-occupied houses - 1 room (%)
Rooms in owner-occupied houses - 2 rooms (%)
Rooms in owner-occupied houses - 3 rooms (%)
Rooms in owner-occupied houses - 4 rooms (%)
Rooms in owner-occupied houses - 5 rooms (%)
Rooms in owner-occupied houses - 6 rooms (%)
Rooms in owner-occupied houses - 7 rooms (%)
Rooms in owner-occupied houses - 8 rooms (%)
Rooms in owner-occupied houses - 9+ rooms (%)
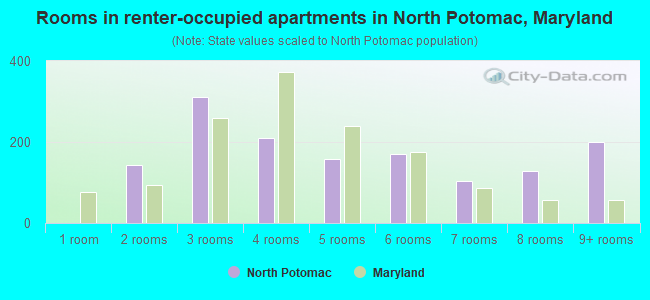
Rooms in renter-occupied houses - 1 room (%)
Rooms in renter-occupied houses - 2 rooms (%)
Rooms in renter-occupied houses - 3 rooms (%)
Rooms in renter-occupied houses - 4 rooms (%)
Rooms in renter-occupied houses - 5 rooms (%)
Rooms in renter-occupied houses - 6 rooms (%)
Rooms in renter-occupied houses - 7 rooms (%)
Rooms in renter-occupied houses - 8 rooms (%)
Rooms in renter-occupied houses - 9+ rooms (%)
Bedrooms in owner-occupied houses - no bedrooms (%)
Bedrooms in owner-occupied houses - 1 bedroom (%)
Bedrooms in owner-occupied houses - 2 bedrooms (%)
Bedrooms in owner-occupied houses - 3 bedrooms (%)
Bedrooms in owner-occupied houses - 4 bedrooms (%)
Bedrooms in owner-occupied houses - 5+ bedrooms (%)
Bedrooms in renter-occupied houses - no bedrooms (%)
Bedrooms in renter-occupied houses - 1 bedroom (%)
Bedrooms in renter-occupied houses - 2 bedrooms (%)
Bedrooms in renter-occupied houses - 3 bedrooms (%)
Bedrooms in renter-occupied houses - 4 bedrooms (%)
Bedrooms in renter-occupied houses - 5+ bedrooms (%)
Vehicles available in owner-occupied houses - no vehicle available (%)
Vehicles available in owner-occupied houses - 1 vehicle available(%)
Vehicles available in owner-occupied houses - 2 Vehicles available (%)
Vehicles available in owner-occupied houses - 3 Vehicles available (%)
Vehicles available in owner-occupied houses - 4 Vehicles available (%)
Vehicles available in owner-occupied houses - 5+ Vehicles available (%)
Vehicles available in renter-occupied houses - no vehicle available (%)
Vehicles available in renter-occupied houses - 1 vehicle available (%)
Vehicles available in renter-occupied houses - 2 Vehicles available (%)
Vehicles available in renter-occupied houses - 3 Vehicles available (%)
Vehicles available in renter-occupied houses - 4 Vehicles available (%)
Vehicles available in renter-occupied houses - 5+ Vehicles available (%)
Housing units in structures - 1, detached (%)
Housing units in structures - 1, attached (%)
Housing units in structures - 2 (%)
Housing units in structures - 3 or 4 (%)
Housing units in structures - 5 to 9 (%)
Housing units in structures - 10 to 19 (%)
Housing units in structures - 20 to 49 (%)
Housing units in structures - 50 or more (%)
Housing units in structures - Mobile home (%)
Housing units in structures - Boat, RV, van, etc. (%)
Housing units in structures - Owners - 1, detached (%)
Housing units in structures - Owners - 1, attached (%)
Housing units in structures - Owners - 2 (%)
Housing units in structures - Owners - 3 or 4 (%)
Housing units in structures - Owners - 5 to 9 (%)
Housing units in structures - Owners - 10 to 19 (%)
Housing units in structures - Owners - 20 to 49 (%)
Housing units in structures - Owners - 50 or more (%)
Housing units in structures - Owners - Mobile home (%)
Housing units in structures - Owners - Boat, RV, van, etc. (%)
Housing units in structures - Renters - 1, detached (%)
Housing units in structures - Renters - 1, attached (%)
Housing units in structures - Renters - 2 (%)
Housing units in structures - Renters - 3 or 4 (%)
Housing units in structures - Renters - 5 to 9 (%)
Housing units in structures - Renters - 10 to 19 (%)
Housing units in structures - Renters - 20 to 49 (%)
Housing units in structures - Renters - 50 or more (%)
Housing units in structures - Renters - Mobile home (%)
Housing units in structures - Renters - Boat, RV, van, etc. (%)
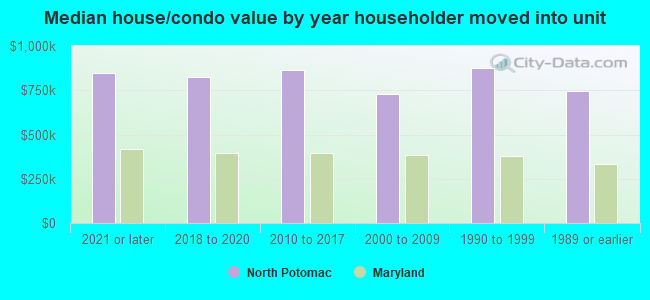
House/condo owner moved in on average (years ago)
Renter moved in on average (years ago)
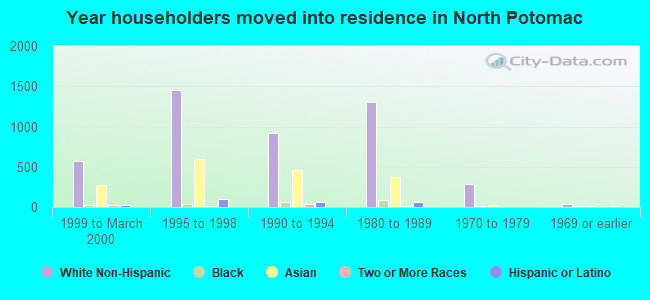
Year householder moved into unit - Moved in 1999 to March 2000 (%)
Year householder moved into unit - Moved in 1999 to March 2000 (%) - White
Year householder moved into unit - Moved in 1999 to March 2000 (%) - Black or African American
Year householder moved into unit - Moved in 1999 to March 2000 (%) - Asian
Year householder moved into unit - Moved in 1999 to March 2000 (%) - Hispanic or Latino
Year householder moved into unit - Moved in 1999 to March 2000 (%) - American Indian and Alaska Native
Year householder moved into unit - Moved in 1999 to March 2000 (%) - Multirace
Year householder moved into unit - Moved in 1999 to March 2000 (%) - Other Race
Year householder moved into unit - Moved in 1995 to 1998 (%)
Year householder moved into unit - Moved in 1995 to 1998 (%) - White
Year householder moved into unit - Moved in 1995 to 1998 (%) - Black or African American
Year householder moved into unit - Moved in 1995 to 1998 (%) - Asian
Year householder moved into unit - Moved in 1995 to 1998 (%) - Hispanic or Latino
Year householder moved into unit - Moved in 1995 to 1998 (%) - American Indian and Alaska Native
Year householder moved into unit - Moved in 1995 to 1998 (%) - Multirace
Year householder moved into unit - Moved in 1995 to 1998 (%) - Other Race
Year householder moved into unit - Moved in 1990 to 1994 (%)
Year householder moved into unit - Moved in 1990 to 1994 (%) - White
Year householder moved into unit - Moved in 1990 to 1994 (%) - Black or African American
Year householder moved into unit - Moved in 1990 to 1994 (%) - Asian
Year householder moved into unit - Moved in 1990 to 1994 (%) - Hispanic or Latino
Year householder moved into unit - Moved in 1990 to 1994 (%) - American Indian and Alaska Native
Year householder moved into unit - Moved in 1990 to 1994 (%) - Multirace
Year householder moved into unit - Moved in 1990 to 1994 (%) - Other Race
Year householder moved into unit - Moved in 1980 to 1989 (%)
Year householder moved into unit - Moved in 1980 to 1989 (%) - White
Year householder moved into unit - Moved in 1980 to 1989 (%) - Black or African American
Year householder moved into unit - Moved in 1980 to 1989 (%) - Asian
Year householder moved into unit - Moved in 1980 to 1989 (%) - Hispanic or Latino
Year householder moved into unit - Moved in 1980 to 1989 (%) - American Indian and Alaska Native
Year householder moved into unit - Moved in 1980 to 1989 (%) - Multirace
Year householder moved into unit - Moved in 1980 to 1989 (%) - Other Race
Year householder moved into unit - Moved in 1970 to 1979 (%)
Year householder moved into unit - Moved in 1970 to 1979 (%) - White
Year householder moved into unit - Moved in 1970 to 1979 (%) - Black or African American
Year householder moved into unit - Moved in 1970 to 1979 (%) - Asian
Year householder moved into unit - Moved in 1970 to 1979 (%) - Hispanic or Latino
Year householder moved into unit - Moved in 1970 to 1979 (%) - American Indian and Alaska Native
Year householder moved into unit - Moved in 1970 to 1979 (%) - Multirace
Year householder moved into unit - Moved in 1970 to 1979 (%) - Other Race
Year householder moved into unit - Moved in 1969 or earlier (%)
Year householder moved into unit - Moved in 1969 or earlier (%) - White
Year householder moved into unit - Moved in 1969 or earlier (%) - Black or African American
Year householder moved into unit - Moved in 1969 or earlier (%) - Asian
Year householder moved into unit - Moved in 1969 or earlier (%) - Hispanic or Latino
Year householder moved into unit - Moved in 1969 or earlier (%) - American Indian and Alaska Native
Year householder moved into unit - Moved in 1969 or earlier (%) - Multirace
Year householder moved into unit - Moved in 1969 or earlier (%) - Other Race
Housing units lacking complete plumbing facilities (%)
Housing units lacking complete kitchen facilities (%)
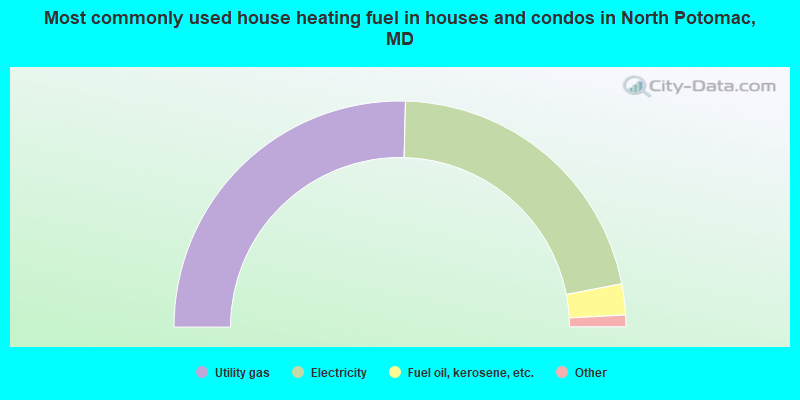
House heating fuel used in houses and condos - Utility gas (%)
House heating fuel used in houses and condos - Bottled, tank, or LP gas (%)
House heating fuel used in houses and condos - Electricity (%)
House heating fuel used in houses and condos - Fuel oil, kerosene, etc. (%)
House heating fuel used in houses and condos - Coal or coke (%)
House heating fuel used in houses and condos - Wood (%)
House heating fuel used in houses and condos - Solar energy (%)
House heating fuel used in houses and condos - Other fuel (%)
House heating fuel used in houses and condos - No fuel used (%)
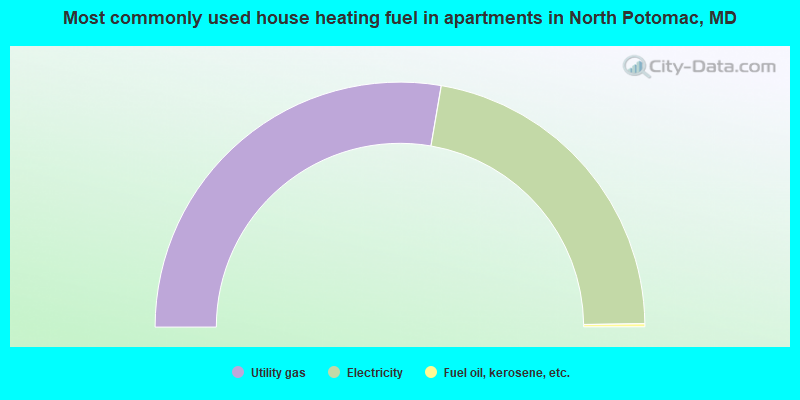
House heating fuel used in apartments - Utility gas (%)
House heating fuel used in apartments - Bottled, tank, or LP gas (%)
House heating fuel used in apartments - Electricity (%)
House heating fuel used in apartments - Fuel oil, kerosene, etc. (%)
House heating fuel used in apartments - Coal or coke (%)
House heating fuel used in apartments - Wood (%)
House heating fuel used in apartments - Solar energy (%)
House heating fuel used in apartments - Other fuel (%)
House heating fuel used in apartments - No fuel used (%)
Median year house/condo built: 1987Median year apartment built: 1997Household type by relationship:
Households: 24,589
Male householders: 5,020 (395 living alone ), Female householders: 3,217 (834 living alone )5,903 spouses (5,903 opposite-sex spouses ), 264 unmarried partners , (264 opposite-sex unmarried partners ), 8,422 children (8,121 natural , 146 adopted , 155 stepchildren ), 165 grandchildren , 140 brothers or sisters , 639 parents , 0 foster children , 381 other relatives , 414 non-relatives In group quarters: 19
Size of family households: 2,346 2-persons , 1,571 3-persons , 1,834 4-persons , 629 5-persons , 222 6-persons , 14 7-or-more-persons .
Size of nonfamily households: 1,404 1-person , 217 2-persons , 15 4-persons .
4,526 married couples with children. single-parent households (44 men , 520 women ).
49.6% of residents of North Potomac speak English at home. of residents speak Spanish at home (66% speak English very well , 19% speak English well , 9% speak English not well , 6% don't speak English at all ).of residents speak other Indo-European language at home (81% speak English very well , 14% speak English well , 4% speak English not well , 1% don't speak English at all ).of residents speak Asian or Pacific Island language at home (62% speak English very well , 19% speak English well , 16% speak English not well , 3% don't speak English at all ).of residents speak other language at home (94% speak English very well , 6% speak English well ).
Foreign born population: 10,463 (42.6%)of them are naturalized citizens )
Median number of rooms in houses and condos:
Median number of rooms in apartments
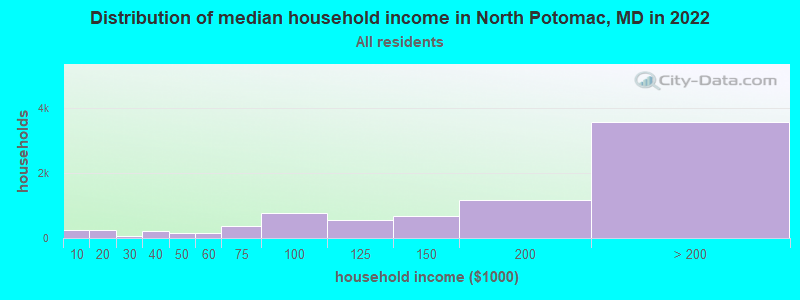
North Potomac, MD household income distribution 248 Less than $10,000252 $10,000 to $19,99977 $20,000 to $29,999217 $30,000 to $39,999153 $40,000 to $49,999152 $50,000 to $59,999363 $60,000 to $74,999784 $75,000 to $99,999559 $100,000 to $124,999678 $125,000 to $149,9991,178 $150,000 to $199,9993,582 $200,000 or more
Home value of owner - occupied houses in 2022 in North Potomac, MD 25 Less than $10,00053 $60,000 to $69,9996 $80,000 to $89,9991 $125,000 to $149,9996 $150,000 to $174,99917 $175,000 to $199,99926 $200,000 to $249,99929 $250,000 to $299,999257 $300,000 to $399,999365 $400,000 to $499,9992,590 $500,000 to $749,9992,853 $750,000 to $999,9991,032 $1,000,000 to $1,499,99934 $1,500,000 to $1,999,99929 $2,000,000 or moreRent paid by renters in 2022 in North Potomac, MD 36 $150 to $19916 $300 to $3496 $350 to $3999 $400 to $44943 $1,000 to $1,24970 $1,250 to $1,499371 $1,500 to $1,999205 $2,000 to $2,499205 $2,500 to $2,999157 $3,000 to $3,499112 $3,500 or more81 No cash rent
Percentage of workers working in this county: 82.6%Number of people working at home: 5,207 (41.5% of all workers )
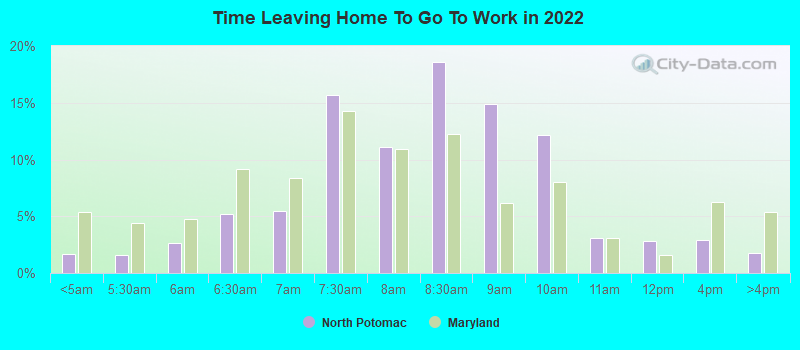
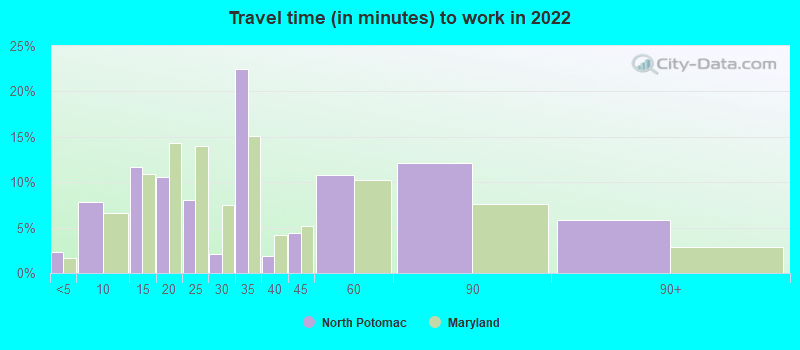
Travel time to work (commute)
Less than 5 minutes: 475 to 9 minutes: 33210 to 14 minutes: 64615 to 19 minutes: 1,30120 to 24 minutes: 77025 to 29 minutes: 54230 to 34 minutes: 1,17335 to 39 minutes: 26940 to 44 minutes: 61345 to 59 minutes: 79860 to 89 minutes: 1,15990 or more minutes: 149
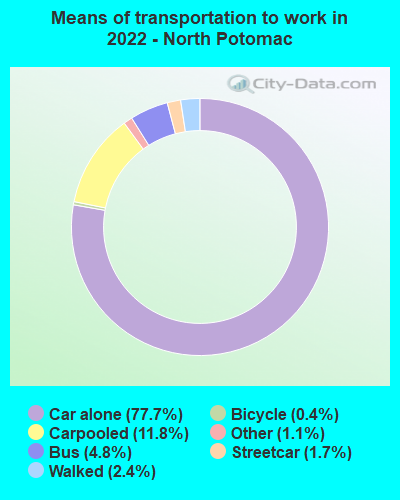
Means of transportation to work:
Drove a car alone: 2,054 (29.4%)Carpooled: 333 (4.8%)Bus : 109 (1.6%)Subway or elevated rail : 36 (0.5%)Taxi: 32 (0.5%)Bicycle: 17 (0.2%)Walked: 53 (0.8%)Worked at home: 5,207 (74.5%)
Unemployment by race in 2022
Unemployment rate for White non-Hispanic residents 3.0% Males5.9% FemalesUnemployment rate for Black residents 5.3% Males10.7% FemalesUnemployment rate for Asian residents 1.1% Males5.9% FemalesUnemployment rate for two or more race residents 3.9% FemalesUnemployment rate for Hispanic or Latino residents 1.4% Males5.5% Females
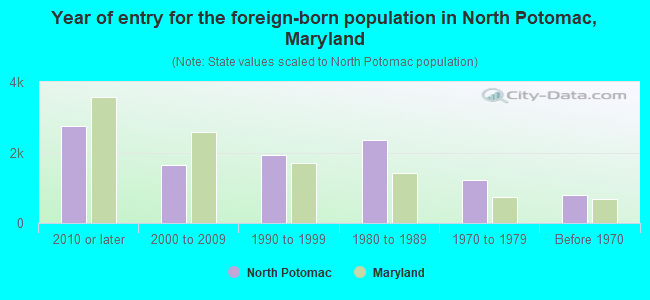
Year of entry for the foreign-born population in North Potomac, Maryland
2,754 2010 or later 1,652 2000 to 2009 1,930 1990 to 1999 2,341 1980 to 1989 1,223 1970 to 1979 804 Before 1970
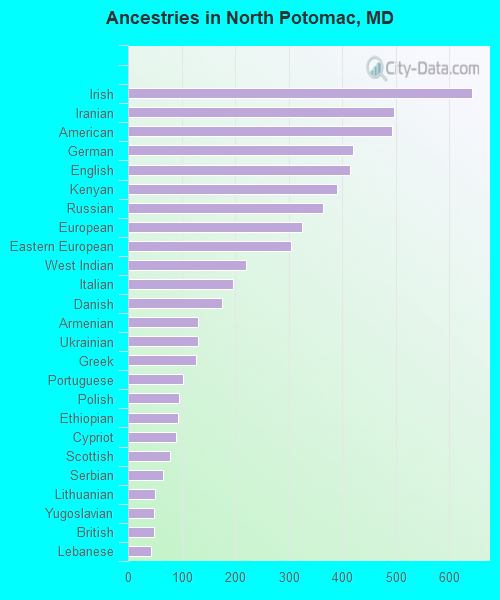
First ancestries reported:
Irish: 642 (3.8%)
Iranian: 496 (3.0%)
American: 493 (2.9%)
German: 421 (2.5%)
English: 415 (2.5%)
Kenyan: 391 (2.3%)
Russian: 365 (2.2%)
European: 325 (1.9%)
Eastern European: 304 (1.8%)
West Indian: 220 (1.3%)
Italian: 196 (1.2%)
Danish: 176 (1.1%)
Armenian: 131 (0.8%)
Ukrainian: 131 (0.8%)
Greek: 127 (0.8%)
Portuguese: 102 (0.6%)
Polish: 95 (0.6%)
Ethiopian: 93 (0.6%)
Cypriot: 90 (0.5%)
Scottish: 78 (0.5%)
Serbian: 65 (0.4%)
Lithuanian: 50 (0.3%)
Yugoslavian: 49 (0.3%)
British: 48 (0.3%)
Lebanese: 43 (0.3%)
Egyptian: 37 (0.2%)
Welsh: 36 (0.2%)
Brazilian: 34 (0.2%)
French: 30 (0.2%)
Nigerian: 30 (0.2%)
Romanian: 28 (0.2%)
African: 25 (0.1%)
Dutch: 24 (0.1%)
Finnish: 21 (0.1%)
Northern European: 20 (0.1%)
Scotch-Irish: 18 (0.1%)
Norwegian: 16 (0.10%)
Swedish: 16 (0.10%)
Slovak: 11 (0.07%)
Hungarian: 8 (0.05%)
Czechoslovakian: 8 (0.05%)
Syrian: 7 (0.04%)
Icelander: 7 (0.04%)
Scandinavian: 7 (0.04%)
Carpatho Rusyn: 7 (0.04%)
French Canadian: 6 (0.04%)
Austrian: 6 (0.04%)
Swiss: 5 (0.03%)
Jamaican: 5 (0.03%)
Latvian: 4 (0.02%)
Israeli: 4 (0.02%)
Most common places of birth for foreign-born residents (%): China, excluding Hong Kong and Taiwan North Potomac:
26.7% (2,796)Maryland:
4.6% (44,742)
India North Potomac:
14.6% (1,528)Maryland:
6.4% (61,725)
Taiwan North Potomac:
7.9% (828)Maryland:
0.9% (8,520)
Korea North Potomac:
6.4% (665)Maryland:
3.4% (32,635)
Iran North Potomac:
5.5% (571)Maryland:
1.3% (12,074)
Kenya North Potomac:
3.3% (341)Maryland:
0.8% (7,497)
Philippines North Potomac:
2.8% (290)Maryland:
3.8% (36,698)
Russia North Potomac:
2.4% (250)Maryland:
1.0% (9,481)
Vietnam North Potomac:
2.3% (236)Maryland:
1.9% (18,716)
Ukraine North Potomac:
2.0% (207)Maryland:
0.7% (6,326)
Germany North Potomac:
1.9% (204)Maryland:
1.2% (11,265)
Hong Kong North Potomac:
1.8% (184)Maryland:
0.4% (4,118)
Colombia North Potomac:
1.6% (172)Maryland:
1.3% (12,898)
Place of birth for U.S.-born residents:
This state: 6,299Other state: 7,588Northeast: 2,269Midwest: 1,028South: 3,444West: 850 90.1% of North Potomac residents lived in the same house 1 years ago.
Out of people who lived in different houses, 37.0% lived in this county.
Out of people who lived in different counties, 26.3% lived in Maryland.
North Potomac:
90.1%State average:
88.5%
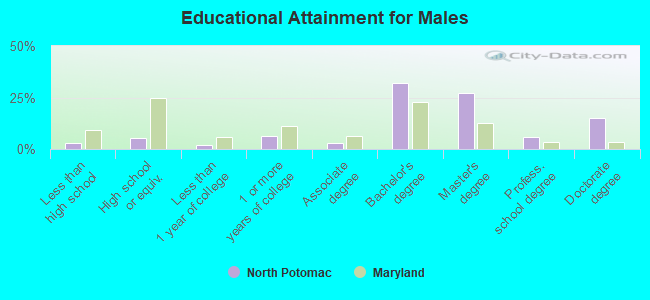
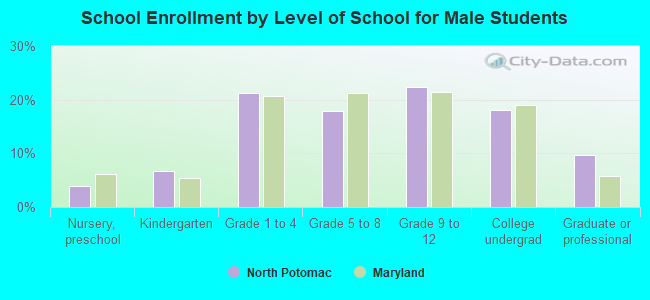
Education attainment for males 25 years and older:
No schooling: 85Nursery to 4th grade: 05th and 6th grade: 617th and 8th grade: 189th grade: 010th grade: 011th grade: 1112th grade, no diploma: 71High school graduate (or equivalency): 441Less than 1 year of college: 175Some college more than 1 year, no degree: 536Associate degree: 243Bachelor's degree: 2,646Master's degree: 2,271Professional school degree: 465Doctorate degree: 1,264
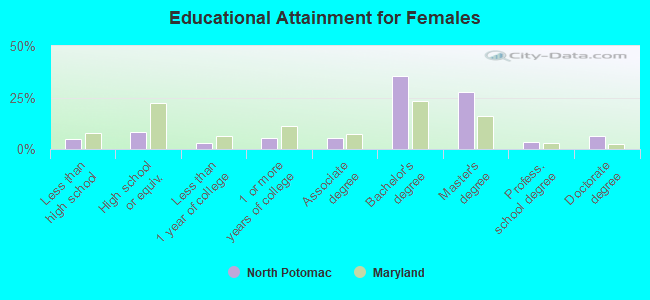
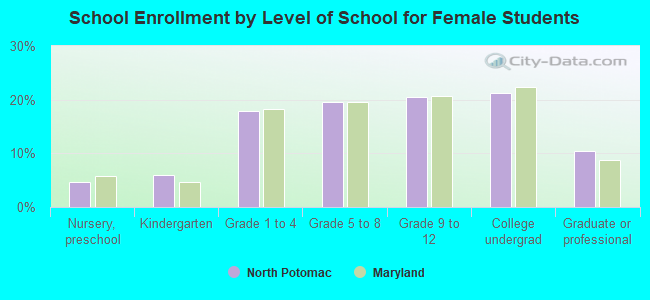
Education attainment for females 25 years and older:
No schooling: 108Nursery to 4th grade: 1235th and 6th grade: 367th and 8th grade: 99th grade: 010th grade: 3511th grade: 2212th grade, no diploma: 99High school graduate (or equivalency): 713Less than 1 year of college: 259Some college more than 1 year, no degree: 454Associate degree: 481Bachelor's degree: 3,090Master's degree: 2,406Professional school degree: 293Doctorate degree: 566
Housing units in structures:
One, detached: 5,646One, attached: 2,111Two: 463 or 4: 245 to 9: 7310 to 19: 41620 to 49: 11650 or more: 122Mobile homes: 9Housing units lacking complete plumbing facilities in 2022: 0.6%Housing units lacking complete kitchen facilities in 2022: 0.9%House/condo owner moved in on average 17 years ago
Renter moved in on average 3 years ago
Private vs. public school enrollment:
Students in private schools in grades 1 to 8 (elementary and middle school): 145 Students in private schools in grades 9 to 12 (high school): 126 Students in private undergraduate colleges: 216